|
|
||||||
|
|

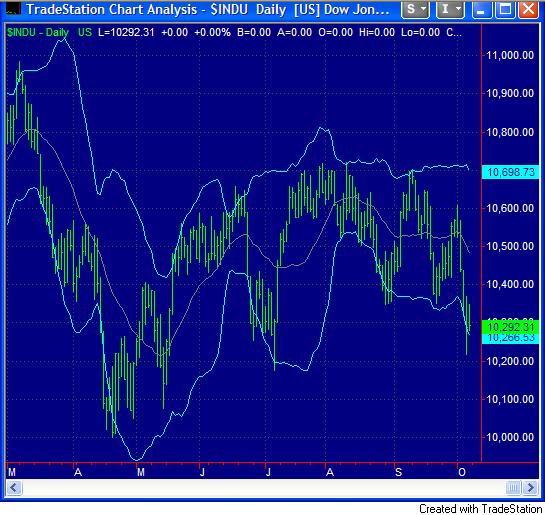
October 10, 2005 Wednesday's Breakdowns Well, the market fell last week, apparently on news that President Bush chose Tommy "Moe" Johnson, a Domino's pizza delivery boy, as his nominee to replace Alan Greenspan as Fed Chairman. "I was just in the right place at the right time" said Tommy, who had inadvertently wandered into the Oval Office with a large pepperoni as Bush was making his choice. Runners up included Martin "Eenie" Feldstein of the National Bureau of Economic Research, John "Meenie" Taylor of Stanford University, and Ben "Mynie" Bernanke of the Council of Economic Advisors. Seriously, although CNBC inexplicably blamed last week's decline on the hawkish comments of a fairly obscure Fed governor, my impression is that investors were expressing a distinct loss of confidence on a variety of fronts. Wednesday was particularly decisive - to an extent that I closed the bulk of our remaining exposure to market fluctuations in the Strategic Growth Fund about mid-afternoon. There has to be a lot wrong with market action to provoke me to increase hedges when the market is down rather than up. There was a lot wrong on Wednesday - it was singularly the worst technical showing I can recall in years. Other veteran market-watchers had similar comments. The Dow was down 123 points, which wasn't in itself so unusual, but the internal action was terrible. Richard Russell commented after the close that the action was "a really mean mark today, with my PTI close to a bear signal, and Lowry's also close to a major sell signal. I still get the feeling that complacency rules. Today was what I call a semi-crash day." On the subject of complacency, Investors Intelligence reports that the majority of investment advisors have been bullish now for 154 weeks, which is the longest bullish stretch in the 42 years the figures have been tracked. Joe Granville described Wednesday as having "the most bearish reversal patterns that I have ever seen in one day," which is an interesting statement even for a perennial bear. Quality of Internals I've frequently noted that there are many points in history when stocks have been overvalued and continued to advance, and others where stocks were overvalued and dropped like a rock. When I looked back carefully over market history, I concluded that what distinguishes these outcomes, on the whole, is the broad quality of prevailing market action. Robust markets have a sort of "uniformity" to them. You might see periodic declines, even sharp ones from time to time, but the health of the market is expressed in the form of resilient internals - volume tends to expand on rallies and contract on declines except on occasional "washout" days, breadth remains fairly good as measured by advancing versus declining issues, large divergences don't emerge in the behavior of various industry groups (spreads which otherwise would contain information about whatever factors those industries don't share in common), new lows don't spike higher, and even if they do exceed new highs on a given day, they remain relatively small in number, major indices tend to hold prior intermediate lows, or if they fail, the failures are unconfirmed by other measures, and on and on. You can think of good internals like pillars under a beautiful mansion. If you want to gauge the structural health of the mansion, you don't look at the furniture, the window trim, or the expensive, overpriced paintings on the wall. You look underneath at the integrity of the pillars. A crack in one or two, unconfirmed by the others, might be a cause of some concern, though it can probably be repaired. But you should run like a screaming monkey when you see a large collection of pillars getting whacked out at once. Usually, my impressions about market action are influenced by fairly subtle measures I've collected or constructed over the years. Wednesday required none of it - with important deteriorations appearing in a variety of widely tracked indices. The chart below of the Dow Jones Industrials is sufficient to convey the idea. Even when the market declined sharply in April, we still observed reasonably good internals, with breadth (advances versus declines) being among the most resilient, and a variety of other measures also holding up well. Note that since April, declines in the Dow Industrials have held consistently above prior lows. Even September's decline didn't quite break under the August low, and meanwhile, many other measures of market internals continued to hold.
Looking at the last 5 bars, the market started off well last week, with the Dow approaching 10,600 in the early hours of trading on Monday. Then we saw the first failure, as the market lost all of those gains and closed down on the day. Tuesday enjoyed another brief rally attempt that held into the early afternoon, then withered abruptly toward the close. You'll note that Wednesday started from Tuesday's closing low and just continued down. What's important there is that by mid-afternoon, the Dow broke both August and September lows, in tandem with other indices including the S&P 500, the Russell 2000 and the Nasdaq Composite. Meanwhile, as I noted last week, new lows have been periodically exceeding the number of new highs, but in contrast to what occurs in a healthy market, both figures have been quite high - indicating a very significant amount of internal "turbulence" or divergence. Market breadth, as measured by various advance-decline lines, also deteriorated pointedly, while trading volume showed a strong tendency to expand on downticks. In short, there was a lot of information in market action indicating that investors have fairly abruptly adopted a skittish view of risk taking. If you look at how the Russell 2000 has behaved, the speed of the shift is also of concern. Market declines that start with sharp, seemingly relentless vertical declines often turn investors into bag-holders all the way down. Those initial declines often tempt investors to say "the market is already down so much, I can't sell now. How much lower can it go? No, really, how much lower can it go? Sweet Mother of Joseph! How much lower can it go?!??" At this point, a poor continuation would involve a spike in the CBOE volatility index (VIX) and breakdown in the Dow Transportation index below its August-September lows, which would occur slightly below 3600 on that index. That said, what I've just described is a combination of what I view as unfavorable and informative market action. It still does not ensure that the market will decline, however. It only suggests that given the current evidence, we don't have sufficient reason to accept broad market risk. Both valuations and market action are unfavorable here. It is important to remember that identification of an unfavorable Market Climate is different from having a specific point forecast about the future. Indeed, nothing rules out the possibility that the market could be at some sort of intermediate low and could recover rather than deteriorate further. If that turns out to be the case, we will miss participating in the initial move higher, and that's a risk that is fully acceptable given the tone of the evidence now prevailing. Good indications of a more constructive attitude toward risk among investors would include a tendency for trading volume to expand on advances, a substantial reduction in the number of individual stocks achieving new lows, and a recovery at least beyond the most recent near-term market peaks, for example, 10,600 on the Dow. That's only about 3% away, so the amount of improvement would not have to be very large in order to "clear" the apparent negatives here. But that improvement would have to be fairly uniform across a variety of measures. Given the preponderance of the breakdowns last week, the reversals would have to be nearly as numerous. As unlikely as that seems to me personally, we'll take the evidence as it arrives. We've got a tiny position in contingent call options to allow for a possible near-term reversal, but otherwise, our hatches are well battened down. Keep in mind that even when our exposure to broad market risk is fully hedged, it should not be confused with a "bearish" market forecast. Nor should our investment position be interpreted as risk-free. We always accept the risk that our individual stock holdings will move somewhat differently than the major indices we use to hedge. When the Fund is hedged, those differences in performance are our primary source of expected return, as well as potential risk. Market Climate As noted above, as of last week, the Market Climate for stocks was characterized by unusually unfavorable valuations and unfavorable market action. This has historically not been a rewarding environment in which to accept market risk, on average, though it doesn't preclude an advance in any particular instance. In bonds, the Market Climate remains characterized by modestly unfavorable valuations and modestly unfavorable market action, holding the Strategic Total Return Fund to a relatively short duration of about 2 years, mostly in Treasury Inflation Protected Securities and money market securities. My impression is that despite economic risks, there is a good chance that the yield curve will converge to a flat profile at just over 5%, particularly given that inflation pressures seem incompletely recognized. The Strategic Total Return Fund continues to hold about 20% of assets in precious metals shares. I've noted recently that this is not exposure that I intend to hedge. The reason is that I continue to view conditions in the precious metals market to be associated with a very acceptable return-to-risk profile on average. No hedging is appropriate in that circumstance, but it does mean that we'll see a certain amount of day-to-day fluctuation as precious metals shares move around. Also, I added a small 4% position in yen denominated U.S. agency notes on last week's weakness in that currency. As a general note, hedging is appropriate when you hold an asset where you want to shut down the effect of market fluctuations, but you want to continue holding the asset, either because you believe that it will perform well relative to the market, or because you have liquidity or tax issues that make it undesirable to sell outright. Of course, if you just don't want to take risk at all, you don't hedge, you just sell the thing. Generally speaking, we haven't hedged our bond positions in the Strategic Total Return Fund to this point because there's really not much premium in the bond market right now for taking things like credit risk or maturity risk. So if we want to reduce our bond market risk, we just move to shorter durations. In any event, the point is not to avoid all risks, but to only avoid those that invite unacceptable returns or unacceptable losses. Both the Strategic Growth Fund and the Strategic Total Return Fund can and do accept risks and market fluctuations that are expected to be compensated. The attempt to manage risk is inherent in the investment approach of both Funds, but the attempt to constantly avoid and restrict risk regardless of opportunities is not. --- The foregoing comments represent the general investment analysis and economic views of the Advisor, and are provided solely for the purpose of information, instruction and discourse. Prospectuses for the Hussman Strategic Growth Fund, the Hussman Strategic Total Return Fund, the Hussman Strategic International Fund, and the Hussman Strategic Dividend Value Fund, as well as Fund reports and other information, are available by clicking "The Funds" menu button from any page of this website. |
|||||||||||||||||||||||||
|
For more information about investing in the Hussman Funds, please call us at
1-800-HUSSMAN (1-800-487-7626) 513-326-3551 outside the United States Site and site contents © copyright Hussman Funds. Brief quotations including attribution and a direct link to this site (www.hussmanfunds.com) are authorized. All other rights reserved and actively enforced. Extensive or unattributed reproduction of text or research findings are violations of copyright law. Site design by 1WebsiteDesigners. |