|
|
||||||
|
|

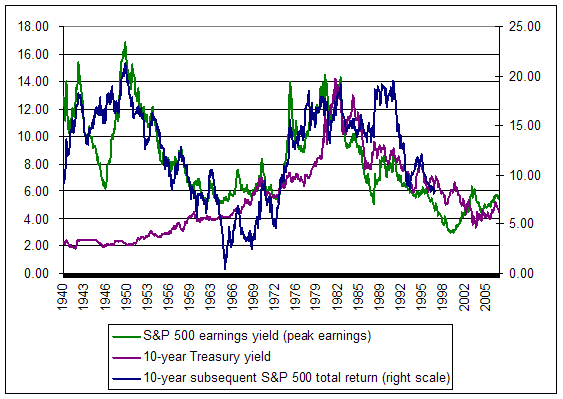
July 9, 2007 Interest Rate Intuition It continues to fascinate me that investors are entirely willing to base their financial security on concepts that can be wholly disproved with even a cursory look at historical data. The Fed Model is the predominant example of this at present. The following chart should be sufficient to reiterate that the effect of interest rates on stock valuations is vastly overrated, and that raw earnings yields (particularly based on peak earnings to date) explain subsequent market returns far better than indicators that "adjust" for interest rates in the one-for-one way the Fed Model does.
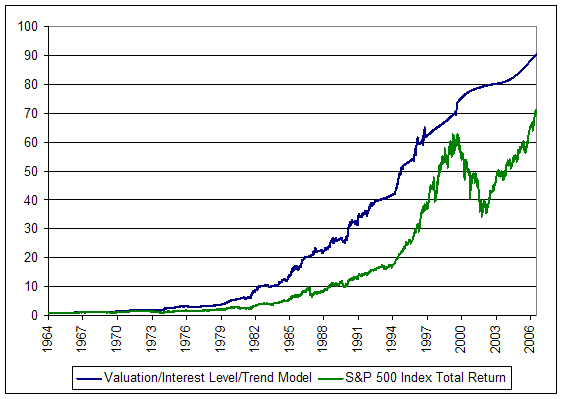
The truth is that the relationship between stocks and interest rates is far more nuanced than the Fed Model assumes. Since 1950, the average yield on the 10-year Treasury bond has been just below 6%, while the average price/peak earnings multiple on the S&P 500 has been slightly over 14. For simplicity, we'll use those levels to define bond yields as "low" or "high" and to define stock valuations as "cheap" or "expensive" relative to long historical averages. Also for simplicity, we'll classify interest rates as "falling" when the 10-year Treasury yield is below its level of 6 months earlier, and "rising" otherwise. Our intuition should immediately suggest that stocks probably perform best when valuations are cheap and interest rates are both low and falling. We should also expect that such favorable conditions would not have been observed too often. As it happens, that intuition is correct. That combination of conditions has historically occurred only about 7% of the time, but during those periods, the S&P 500 has achieved average annualized returns of 31.72%. In contrast, our intuition should suggest that stocks probably perform worst when valuations are expensive and interest rates are both high and rising. Again, that intuition is correct. Such a combination of conditions has historically occurred about 10% of the time, and during those periods, the S&P 500 has achieved average annualized returns of 3.05%, clearly below Treasury bill yields, and generally with a great deal of volatility as well. When interest rates have been high and rising, the total return on the S&P 500 has been muted at about 4.00% annualized even when stocks have been relatively cheap. Low interest rates are no panacea Beyond those conditions, however, the intuition of the typical investor is likely to be badly off the mark. The reason is that investors have come to believe that low interest rates are a good thing for stocks in general, when in fact they are only a good thing if stock valuations are cheap. Importantly, low interest rates are of no help to stocks when stock valuations are rich. Contrary to the bad intuition that the Fed Model instills in the minds of investors, relatively low interest rates (at least on the basis of 10-year bond yields) are not nearly sufficient to justify or offset the negative effect of rich stock valuations. Specifically, when stock valuations have been above average (again, defined here as just roughly 14 times the highest level of trailing net earnings achieved to-date) and interest rates have been low (below 6% on the 10-year Treasury yield), overall market performance has been tepid regardless of the trend of yields. In the 16% of history when we've observed high valuations with low and falling interest rates, the S&P 500 has achieved an average annualized total return of 6.22%. Combining high valuations with low and rising interest rates (which has occurred just as often), the average annualized total return has been 5.41%. Average returns have been even lower when valuations have been above 18 times record earnings, as they are today. "Fed Model" intuition also fails investors in the case where interest rates are high and stock valuations are cheap. While the Fed Model would view this situation as fairly neutral, better intuition suggests that this sort of condition can be very desirable. Specifically, when stocks are relatively cheap and yields are high, there is a great deal of room for yields to decline and stock valuations to expand. We should therefore expect stock returns to be quite strong, given a combination of cheap valuations and high interest rates, as soon as we have evidence that interest rates are trending lower (even based on a comparison with levels of 6 months earlier). This better intuition is correct. The S&P 500 has achieved annualized total returns averaging 26.46% from such conditions, which have historically occurred about 14% of the time. Though the combination of above-average valuations coupled with high and falling interest rates is the least common of conditions, occurring just 6% of the time, it turns out that this set of conditions has also been generally favorable, producing S&P 500 returns averaging 19.83% annualized. My impression is that this is the most fragile of the foregoing results, and it may not be a reliable outcome - both because of the small sample size and the fact that good returns from rich valuations are not strongly intuitive. We tend to observe these conditions in the late portion of speculative market advances, so my sense is that they represent periods when investors are still eager to drive risk premiums lower. Once the level of Treasury yields has declined much below 6%, most of the favorable effect has been spent, and market returns have then become much less satisfactory, on average. In short, investors should not simply assume that low interest rates are "good" and high interest rates are "bad." The facts are much more subtle. Historically, stocks have performed well, on average, when valuations have been relatively cheap, and interest rates have been low, falling, or both. For what appear to be speculative reasons, stocks have performed well, on average, despite rich valuations, only when interest rates have been relatively high and falling. In general, high stock valuations coupled with low interest rates (as we have now) have historically been symptomatic of a fully priced, overly optimistic market, with little margin for error. A simple experiment As is often the case for other simple models I occasionally present in these comments, the following model is intended to provide insight. I would not advise it for trading purposes, largely because it would require an implausible amount of patience and leaves far too much "on the table." Still, my hope is that it will provide useful perspective, and will also remind shareholders that one can safely avoid market risk for substantial lengths of time and still outperform the market over the long-term with significantly less risk. The following chart is based on the observations above. It assumes that investors are fully invested when stock valuations are relatively cheap and interest rates are low, falling, or both. Though I'll reiterate a cautionary note about rich valuations and my advice that this model is far too crude to use in practice, for illustrative purposes the model also allows investment exposure when stock valuations are above-average, provided that interest rates are both high and falling. Given that a buy-and-hold approach would take investment exposure in such environments anyway, it's clear that this assumption does not add risk beyond what a passive approach would accept.
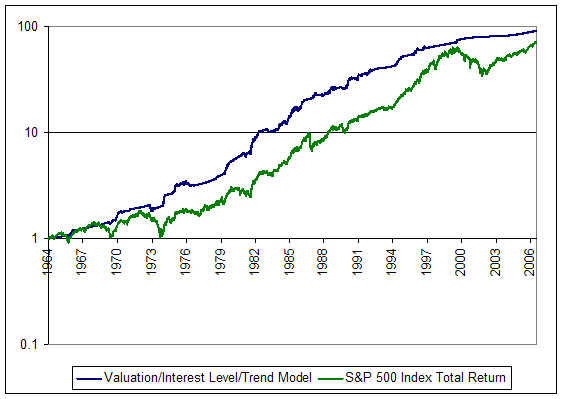
The resulting investment profile has clearly outperformed the S&P 500 over time, with far less risk. That said, it would not have accepted any market risk since July 2000 (even in 2003, which was a reasonable period to do so). Of course, the S&P 500 has lagged Treasury bills since 2000, but it's clear that this model would require an implausible amount of patience from investors and leaves far too much on the table. Here is the same chart in log scale, which illustrates that this simple experiment largely avoids the 1970, 1973-74, 1982, 1987, 1990, and 2000-2002 bear market declines.
Final notes • The Fed Model produces nothing close to this performance, since it would never have taken a negative position prior to 1987 (and would have been quite bullish in 1972 and 1929). As I've noted previously, adjusting earnings yields one-for-one with interest rates has no basis in theory, and destroys, rather than improves, the information content that earnings yields have for explaining subsequent returns. • This example is for illustration only - it is impractical, incomplete, requires unrealistic patience, and has a much lower return/risk profile than I view suitable for managing investments. • With stock valuations rich, interest rates still relatively low but clearly rising, just 18% of investment advisors bearish, and short-term trends overbought, my hope is that investors do not allow the excitement (or frustration) of a market near new highs to obscure the very real danger here for long-term investors. The best performing investment models I've developed over the past 25 years are defensive. Those with a record of strong full-cycle returns at limited risk consistently reject market exposure in the current environment. Generally speaking, if a model accepts large risks here, it accepts large losses historically. • We do not need to be correct about these risks immediately in order to substantially benefit from avoiding them. Market Climate As of last week, the Market Climate for stocks was characterized by unfavorable valuations, tenuously favorable trends on the basis of price/volume behavior, market internals and other factors, and a combination of overbought, overbullish, rising yield conditions that has historically produced market returns below Treasury bill yields, on average. As usual, "on average" is the operative phrase. To say that stocks have substantial risk but have performed worse than Treasury bills, on average, means by definition that there is a spread of possible returns, some positive, some quite negative, but on average below Treasury bills. This of course allows for the possibility that returns in the next particular instance may be on the positive side of the average, as well as the possibility that the next particular instance may be on the negative side. In either case, my hope is that the historical analysis I've provided in recent weeks helps to underscore that the market is presently in a set of conditions where avoiding risk would have ultimately been beneficial to long-term returns. When the average expected return on stocks is below the Treasury bill yield, there is simply no reason to accept risk. Our objective remains to substantially outperform the S&P 500 over the full market cycle, with smaller periodic drawdowns than a buy-and-hold approach. Our strategy remains to accept those risks that are associated, on average, with favorable return/risk profiles, and to avoid, hedge or diversify away those that are not. This is a full cycle, law of averages, repeated game, central limit theorem type of process. For now, the Strategic Growth Fund remains fully hedged. In bonds, the Market Climate remained characterized last week by unfavorable yield levels and rising yield trends. Treasury yields moved higher once again late in the week - the combined effect of relatively good short-term economic figures, and continued inflation concerns. While I don't view the Fed as a prime mover in any event, their recent statement reiterated that the inflation case is still unclear: " Readings on core inflation have improved modestly in recent months. However, a sustained moderation in inflation pressures has yet to be convincingly demonstrated." Indeed, given the fact that the "headline" inflation figure has been persistently above core inflation over the past 3 years (so that the exclusion of food and energy is doing far more than just averaging out temporary volatility), the Fed is likely to increase its focus on the overall inflation rate as a policy variable. That's something to listen for in statements by Fed governors in the weeks ahead. For now, the Strategic Total Return Fund continues to carry a fairly short 2-year duration, mostly in Treasury inflation protected securities, and an exposure of about 20% of assets in precious metals shares, which enjoyed good strength last week. Given a somewhat range-bound market in both bonds and precious metals, most of the day-to-day opportunities in the coming weeks are likely to be along the lines of modest purchases of bonds on short-term weakness, and modest lightening of precious metals shares on short-term strength, within a relatively defensive posture overall. --- The foregoing comments represent the general investment analysis and economic views of the Advisor, and are provided solely for the purpose of information, instruction and discourse. Prospectuses for the Hussman Strategic Growth Fund, the Hussman Strategic Total Return Fund, the Hussman Strategic International Fund, and the Hussman Strategic Dividend Value Fund, as well as Fund reports and other information, are available by clicking "The Funds" menu button from any page of this website. |
|||||||||||||||||||||||||
|
For more information about investing in the Hussman Funds, please call us at
1-800-HUSSMAN (1-800-487-7626) 513-326-3551 outside the United States Site and site contents © copyright Hussman Funds. Brief quotations including attribution and a direct link to this site (www.hussmanfunds.com) are authorized. All other rights reserved and actively enforced. Extensive or unattributed reproduction of text or research findings are violations of copyright law. Site design by 1WebsiteDesigners. |