|
|
||||||
|
|

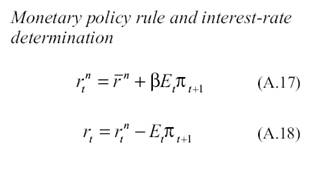
September 24, 2007 Show Me The Money! Investors were cheered last week when the Federal Reserve lowered its target for the Federal Funds Rate by 50 basis points, and lowered the Discount Rate (the interest rate it charges on loans to the banking system) by 50 basis points as well. It's important to emphasize that the impact of these changes is mainly psychological, and outside of a pool of a few billion dollars, won't have any effective bearing on the "liquidity" of the banking system, nor on the solvency of $3.4 trillion in real estate loans, and $6.3 trillion in total bank lending. The Fed certainly does play an important role in accommodating temporary spikes in the demand for currency (as it did around the "year 2000" turn), and in providing economic information, data and analysis. Unfortunately, Fed governors generally believe in their own power not because they actually understand that "power" as insiders, but because as outsiders, they worked on theoretical models of "economies" where the links between Fed actions and market interest rates, bank lending, and overall GDP could simply be assumed by writing down one or more algebraic equations. In one of his most referenced papers, for example, Ben Bernanke assumes a "standard dynamic new Keynesian framework. The most important sectors are a household sector and a business sector. Households are infinitely lived. They work, consume and save. Business firms are owned by entrepreneurs who have a finite expected life. There is also a government that manages fiscal and monetary policy." It is taken for granted that the government determines interest rates, and that household and business sectors respond accordingly. In other models that consider money directly, there is typically an equation linking the money supply to the level of interest rates, and everything proceeds nicely from there. Here's how monetary policy operates in a world like this (taken straight from Bernanke and Gertler, Monetary Policy and Asset Price Volatility, 1999). If you hate equations, ignore the graphic below. The first equation is the Fed Funds rate, which the Fed sets using an inflation targeting rule. The second equation is the actual real interest rate in the economy, tied directly to the Fed Funds rate, which is convenient. The third equation is the household consumption function, tied directly to the real interest rate that is tied directly to the Fed Funds rate. So by assumption, the Fed Funds rate, and thereby the relevant interest rate to consumers, and thereby consumption, and thereby economic activity, are all simply controlled by the central bank. Don't ask how.
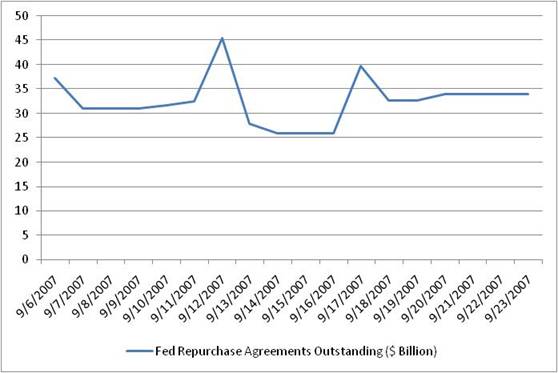
Much ado about nothing To see how monetary policy actually works, look at the data, which you can get from: If you examine the data you'll find that the total level of "liquidity" that the FOMC deals with is minuscule in relation to a $13.8 trillion economy, and the variation is even smaller. The total reserves of the U.S. banking system are about $40-$45 billion, and are very stable. The Fed simply does not "inject" meaningful amounts of "liquidity" to the banking system. Indeed, the latest cuts in Fed controlled interest rates were effected without any injection of "liquidity" into the banking system at all. Total borrowings by depository institutions from the Federal Reserve (i.e. borrowings at the Discount Rate) actually fell last week to $2.421 billion, from $3.158 billion the preceding week. That couple of billion dollars is the sum total of all outstanding borrowings at the Discount Rate. Though these figures are still higher than the typical level of discount window borrowing (a few hundred million), they are minuscule. Yet these are the figures that investors are revved up about as if this "liquidity" will save the mortgage market. Meanwhile, there has been no material change in the "liquidity" provided by the Federal Reserve in the federal funds market either. It's kind of funny (and just a little pathetic) how the press and investors get all excited every time the FOMC does an open market operation, as if they represent fresh "injections" of liquidity into the banking system. They are generally nothing but rollovers of existing repurchase agreements. Open market operations come in two flavors: permanent and temporary. As I've frequently noted, about 99% of the monetary base created by the Federal Reserve represents gradual and predictable increases in the amount of currency in circulation. Year-to-date, the Federal Reserve engaged in what it classifies as "permanent" open market purchases amounting to $1.9 billion in February, $6.1 billion in April, and $2.7 billion in May, for a year-to-date "permanent" increase of $10.7 billion in the monetary base. Not surprisingly, most of this has been drawn off as currency in circulation, which has increased by $9.1 billion since January. Simply put, "permanent" open market operations are simply the way the Fed increases currency in circulation. It is simply incorrect to believe that these open market operations add meaningfully to the "liquidity" from which banks are able to make loans. Temporary open market operations generally take the form of "repurchase agreements" whereby the Fed takes collateral in the form of Treasury securities or U.S. government backed agency securities, and provides funds to banks for periods typically ranging from 1 day to 2 weeks. At the end of that period, the banks are obligated to repurchase the securities from the Fed at the sale price, plus interest. Since reserves are only required on checking deposits, the total amount of reserves in the U.S. banking system is only about $40 to $45 billion. Banks don't hold stack a pile of idle cash in a corner of the vault to maintain these reserves. Instead, they hold securities like Treasury bills and U.S. government-backed agency notes, and if they find themselves in need of reserves, they just pledge these securities to the Federal Reserve as collateral. Look at the last month of data. We know that total bank reserves during this period have ranged between about $40 to $45 billion. Using data on the last 25 FOMC operations reported by the New York Fed, we can tie out the amount of outstanding repurchase agreements on any given day. Recall that total reserves include those obtained through discount rate borrowing and Fed repos (though "nonborrowed reserves" exclude discount borrowings). Evidently, the majority of the reserves in the U.S. banking system are represented by a continuous rollover of outstanding "temporary" repurchase agreements. If one set of repurchase agreements for $10 billion matures 3 days from now, you can pretty well predict that the Fed will enter new repurchase agreements of nearly this amount when the existing agreements expire. As a result, the total amount of repos outstanding is fairly stable. On balance, the Fed injected nothing - repeat nothing - this week.
Importantly, investors are misled when they interpret each new repurchase agreement as if it is a "new injection of liquidity" into the banking system. The bulk of these repos do nothing more than to replace the ones that are due. Show me the money! This week provides an instructive opportunity to observe this in real time. On Thursday, September 27th, an unusually large $24 billion amount of repurchase agreements will come due, leaving only about $7 billion of repos outstanding. It should come as no surprise, then, that the Federal Reserve will most likely enter into a seemingly enormous $24 billion or so in new repurchase agreements by Thursday afternoon. This will undoubtedly be reported with great fanfare, and will be interpreted as a "massive injection of reserves into the banking system" by the Federal Reserve, as if these funds are new liquidity. This interpretation will be utterly incorrect. It will be nothing but a rollover of existing repurchase agreements that the Fed routinely enters into in order to maintain a stable amount of reserves in the banking system. That said, if investors are naïve enough (and last week's exuberance gives every indication that they are), they may very well rally the market on this meaningless and entirely predictable "injection of liquidity" by the Fed. Though we wouldn't speculate on that outcome, it will be interesting to see how Wall Street interprets this rollover. [Postscript - On Thursday, September 27th, the Federal Reserve entered into $6 billion in 14 day repos and $20 in 7 day repos. It also rolled over two small, shorter-term repos from earlier this week that will roll over again within 4 days. As of Thursday's actions, the total amount of Fed repurchases outstanding is $45 billion. This is about the total quantity of reserves in the U.S. banking system (which includes these repo proceeds). In short, these repos are not injections of new liquidity, but a continuous rollover that finances a stable level of reserves, at a level that is negligible in relation to $6.3 trillion in total bank loans.] Simon Says The simple fact is that while the Federal Reserve lowered the Fed Funds Rate and the Discount Rate last week, it did not do so by "injecting" any new funds at all into the banking system. Rather, the Fed lowered these rates strictly by announcing they were now lower. It's easy to understand this in the context of the Discount Rate, because the Fed is the only entity that charges that rate. With Fed Funds, you can understand how the announcement alone can change the rate by understanding a) that the entire variation in bank reserves that determines the Fed Funds rate amounts to only a few billion dollars, and b) banks are generally willing to follow the rate "called out" by the Fed so long as it doesn't affect the spread they earn. Think for a second about how borrowers and depositors differ when they choose a bank. If you're a borrower, you frankly couldn't care less about whether an institution is credit worthy. In fact, you'd just as soon have the entire bank vanish into thin air the second after you take your loan. For that reason, "offered" lending rates like the Prime Rate, Fed Funds, and LIBOR tend to move in lock step between banks - they tend to coordinate these rates because there is no point in competing on that front. Borrowers can simply look at the rates, compare apples-to-apples, and choose the lowest cost lender. Indeed, the whole reason that mortgage loans are complicated by points, closing costs, and other fees is because the only way lenders can charge different rates is to make it hard for borrowers to make a clear apples-to-apples comparison. It's strictly on the bid side (savings deposit rates, CD rates, interest checking rates, etc) that you see a wide variation in the interest rates paid to depositors. As a result, you'll generally observe that when the Fed lowers the Fed Funds Rate, banks often lower other "offered" rates like the Prime Rate and LIBOR, but they also simultaneously lower deposit rates. As long as they can maintain the spread between deposit rates and lending rates, they're often willing to change the levels (though you'll notice that there's currently still a wide spread between LIBOR and Fed Funds here). No new liquidity needs to be introduced, and there is typically no material change in either the volume of deposits or the volume of loans. The data simply don't demonstrate any significant elasticity in either the demand for funds or the supply of deposits in response to marginal changes in Fed-controlled rates. Outside of the banking system, you'll notice that while Fed-controlled interest rates dropped last week, market-controlled interest rates rose. Treasury yields increased at nearly all maturities, as did mortgage rates, including those on 30-year conventional mortgages. Indeed, the only "relief" to borrowers was on rates tied to LIBOR, which fell. But even this is not "new purchasing power" for the economy, because the drop was matched by a reduction in deposit rates, so any relief to borrowers with rates tied to LIBOR came entirely at the expense of savers. Again, the argument is not that interest rates are irrelevant, or that there is no relationship between total government liabilities and inflation (though the tightest relationship is between government spending growth, regardless of how it is financed, and inflation - particularly over horizons of 4-5 years). The argument is that there is no credible mechanism by which Fed actions control the economy. The bottom line - the much celebrated move by the Fed last week created no new liquidity, no new reserves, and no new purchasing power. Given all that, it's unlikely that all of this will result in any material improvement in the solvency of the mortgage market. Market Climate As of last week, the Market Climate for stocks remained characterized by unfavorable valuations and still unfavorable market action. Market internals have significantly lagged the strength in the major averages here, while investment advisory bullishness surged above 53%. While we can't rule out further strength, last week saw a return to the overvalued, overbought, overbullish combination of conditions that has historically been followed by returns averaging less than Treasury bills. On that basis, we widened the "staggered strike" configuration of our hedges on last week's strength, in order to provide a better defense against potential market losses that often abruptly follow such conditions. Investors will likely be reminded of how the market has historically performed following two consecutive cuts in the Discount Rate. We've observed 11 instances of this since 1950, with average total returns in the S&P 500 of 6.18% over the following 3 months, 12.48% over the following 6 months, and 21.05% over the following year. The difficulty with these averages is that the cuts almost invariably occurred well into bear markets, where valuations were already depressed. Specifically, the average P/E on the S&P 500 (based on trailing net earnings) was only 14 (with a median closer to 12), while the average dividend yield was 3.75% and the average price/revenue multiple was just 0.90. Presently, the trailing net P/E on the S&P 500 is 17.9, with a dividend yield of just 1.84 and a price/revenue multiple of 1.55. Indeed, only two of those "second Discount Rate cuts" occurred with the S&P 500 P/E above 15 and advisory bullishness running over 50%. Those instances were December 1971 and January 2001. The average subsequent performance of the S&P 500 following those cuts was -1.22 over 3 months, 0.92% over 6 months, and 3.17% over the following year. In short, the strong historical performance of the market following consecutive Discount Rate cuts can be traced to the fact that these cuts typically occurred when stocks had already declined considerably, market valuations were below average (and usually very cheap), investment sentiment was widely negative, and the economy was already entrenched in well-recognized recessions. It was not the Discount Rate cuts themselves that produced the advances. Rather, consecutive Discount Rate cuts were a "sufficient statistic" that the market was depressed, heavily bearish, cheaply valued, and had largely discounted an ongong recession. It is superstitious and wishful thinking to assume that the market will perform strongly simply because of two Discount Rate cuts, despite elevated valuations, high levels of bullishness, absence of a recession, and an S&P 500 index that is only about 2% from its all-time high. In bonds, prices weakened and long-term yields rose significantly following the Fed move, while the dollar plunged and precious metals prices soared. Evidently, the Fed's move fueled some amount of inflationary concern. My own impression is that the lack of fiscal discipline of recent years will ultimately feed a substantial amount of inflation, but it is not likely to appear so long as credit problems are accelerating. The reason is that credit problems increase the willingness of investors to hold "safe havens" such as Treasury securities and currency, so at least over the intermediate term, the demand for government liabilities is likely to absorb the supply and hold inflation at bay. That said, over the very short-term, the headline CPI number may startle investors in the months ahead owing to upward pressures on oil prices and the rental component of that index. A year-over-year CPI figure of about 4% or more, as I've mentioned before, is statistically baked-in-the-cake by November. The Market Climate in bonds remains characterized by unfavorable valuations but favorable market action, while the Market Climate in precious metals remains favorable on both fronts. I expect that we'll be inclined to increase our exposure in long-term bonds on any substantial price weakness and upward yield pressure, but that inclination will be gradual and proportionate - I don't think it's useful to think of any particular level on say the 10-year or the 30-year Treasury as a "buy." In precious metals, the Strategic Total Return Fund continues to have about 10% of assets in these shares. While this market appears overbought in the near term, we've already clipped our exposure enough to allow for some retrenchment, and given the continued favorable Market Climate overall, there is no reason to lighten our position so much that we would have to hope for weakness in order to reestablish a base position. As our position stands, we'll be inclined to increase our exposure on any substantial weakness, but we also don't have any need to "chase" the market in order to obtain exposure, should precious metals move higher from here. --- The foregoing comments represent the general investment analysis and economic views of the Advisor, and are provided solely for the purpose of information, instruction and discourse. Prospectuses for the Hussman Strategic Growth Fund, the Hussman Strategic Total Return Fund, the Hussman Strategic International Fund, and the Hussman Strategic Dividend Value Fund, as well as Fund reports and other information, are available by clicking "The Funds" menu button from any page of this website. |
|||||||||||||||||||||||||
|
For more information about investing in the Hussman Funds, please call us at
1-800-HUSSMAN (1-800-487-7626) 513-326-3551 outside the United States Site and site contents © copyright Hussman Funds. Brief quotations including attribution and a direct link to this site (www.hussmanfunds.com) are authorized. All other rights reserved and actively enforced. Extensive or unattributed reproduction of text or research findings are violations of copyright law. Site design by 1WebsiteDesigners. |