|
|
||||||
|
|

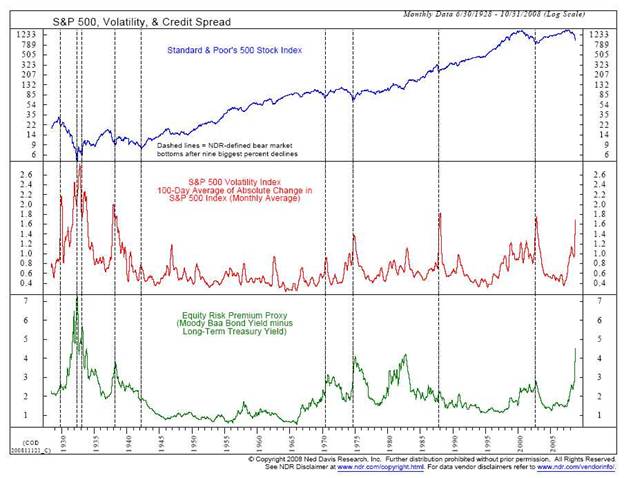
November 17, 2008 The Stock Market is Not in "Uncharted Territory" A note on 2008 capital gains distributions: On Friday, November 14, the Hussman Strategic Growth Fund paid capital gains distributions of $0.1843 classified as short-term, and $1.6851 classified as long-term (taxable at a top federal rate of 15%). The Strategic Total Return Fund paid distributions of $0.2930 classified as short-term, and $0.1953 classified as long-term. Note that the NAV of each Fund is reduced by the amount of the distribution, which is paid to shareholders in cash or reinvested in Fund shares at the post-distribution NAV. For the Strategic Growth Fund, Friday's NAV of 11.99 is comparable to a pre-distribution NAV of 13.86. Shareholders reinvesting the distribution now have 1.155913 shares for every pre-distribution share. Adjusted for distributions, the Fund's record high was on 9/17/08 at 14.31. Since the market peak on 10/09/07, the S&P 500 has declined by -42.82% including dividends, while the Strategic Growth Fund has declined by -10.54% including reinvested distributions. For the Strategic Total Return Fund, Friday's NAV of 10.71 is comparable to a pre-distribution NAV of 11.20. Shareholders reinvesting the distribution now have about 1.045593 shares for every pre-distribution share. Adjusted for distributions, the Fund's record high was on 9/22/08 at 11.70. Further details on these Fund distributions are included in the 11/3/08 weekly comment . --- One of the fallacies about the recent financial turbulence is that the markets are in "uncharted territory" and that there are no historical precedents for the volatility, panic, or economic uncertainty that we've observed. To make statements like this is to admit that one has not examined historical evidence prior to the 1990's. The fact is that we've observed similar panics throughout market history. This decline has been deeper and more rapid than most, but that is largely a reflection of the rich valuation and overbought condition that characterized the market in 2007 (see the July 16, 2007 comment - A Who's Who of Awful Times to Invest). If we seriously deem it necessary to talk about the Great Depression, fine. Even the Great Depression can be adequately used as a precedent for current conditions provided that one recognizes that the market's valuation during the Depression didn't fall to the levels we currently observe until 1931 when the rate of unemployment was already 15%. Sure, if U.S. unemployment is headed to 25%, as it did in the Great Depression, then stock prices might fall in half even from here, as they did by 1932. But this is important - even if stock prices were to fall further, it would not be because of earnings losses that would permanently impair the fundamental value of U.S. companies. Rather, if further losses emerge, it will be because of increases in risk premiums that will be associated with extremely high subsequent returns. Indeed, even though unemployment shot to 25% in 1932, the S&P 500 more than doubled in the year following the 1932 Depression low, and tripled off of that low within less than three years. The handful of historical instances when stocks fell to 7 times prior record earnings were also points that were accompanied by 15-25% unemployment, 12% yields on commercial paper (as at the 1974 lows), or 15% Treasury yields (as at the 1982 lows). Similar data is unlikely in this instance - and even if conditions deteriorate to that point, it will involve months and months of ebb and flow in the economic reports. We can be virtually certain that stocks would experience enormous rallies, not simply continuous decline, while the evidence accumulates. Meanwhile, it is notable that data that measure investor panic, such as risk-premiums and intra-day market volatility, already match historical extremes (1932, 1974, 1982, and 2002) - points where stock prices were not far from their lows even though negative economic news persisted for a longer period. The chart below (reprinted by permission and not to be distributed further) is from Ned Davis Research. Note the points at which similar spikes in volatility and credit spreads occurred. None of this provides assurance about very near-term risks (very short term fluctuations can be obscured by monthly charts like this), but it underscores that similar panics have typically been associated with washed-out market lows, and in any event, should further reinforce that this decline is not particularly "uncharted."
That's not to say that I believe stocks have "hit their lows." We always have to allow for the market to move significantly and unexpectedly, and there is plausible downside risk from here. Our activity as investors is not to try to identify tops and bottoms - it is to constantly align our exposure to risk in proportion to the return that we can expect from that risk, given prevailing evidence. If I were confident that the market's downside risk was tightly limited, I would remove our hedges. Instead, the Strategic Growth Fund continues to hold a put option defense against 70-80% of the holdings at about the 850 level on the S&P 500. Above that level, we are accepting a good deal of day-to-day market fluctuations. Below that level (which is something of a line in the sand for us since it represents the October lows), our option defenses can be expected to increasingly mute the impact of any further market losses. I don't anticipate lowering those strikes in the event that market losses continue, at least until we observe fresh evidence of improved market internals. That said, in the event of a substantial further decline, I do expect to very gradually reduce the percentage of the Fund's holdings that are hedged. In short, with stocks both undervalued and oversold, it is appropriate to accept a modest amount of market risk and a good sensitivity to "local" fluctuations, but we remain hedged to defend against any major and unexpected deterioration. Investors can get a good understanding of market history by examining a great deal of data, or by living through a lot of market cycles and learning something along the way. Only investors who have done neither believe that current conditions are "uncharted territory." Veterans like Warren Buffett and Jeremy Grantham have a good handle on both historical data, and on the concept that stocks are a claim to a very long-term stream of future cash flows. They recognize that even wiping out a year or two of earnings does no major damage to the intrinsic value of companies with good balance sheets and strong competitive positions. Most importantly, these guys never changed their standards of value even when other investors were bubbling and gurgling about a new era of productivity where knowledge-based companies would make the business cycle obsolete, and where profit margins would never mean-revert. They knew to ignore the reckless optimism then, because they understood that stocks were claims on a very long-term stream of cash flows. They know to ignore the paralyzing fear now, because they still understand that stocks are a claim on a very long-term stream of cash flows. No thoughtful investor "calls a bottom" in the markets. Stocks are undervalued here, but they could decline further. Economic conditions are poor, but may be over or under-reflected in stock prices. Investors will find out over time, and the ebb-and-flow of information is slow enough to allow very large market fluctuations in the meantime. Current market conditions are extremely compressed, to the extent that the market could soar by 30% even in the context of an ongoing bear market. At the same time, investors remain skittish, and we should allow for fresh weakness into next year or perhaps a wide and prolonged trading range. We continue to have something of a line-in-the-sand at the October lows, which is largely where our index put option strikes are positioned. We'll alter that as the evidence changes. Price Fluctuations, Support Levels, and Valuation in Bear Markets If we seriously need to talk about the Great Depression (I personally believe that it is an outrageously dire comparison), we should recognize that even during that prolonged decline, it rarely made sense to sell into a major break of a previous low, because investors invariably had a chance to sell on a later recovery to the prior level of support. Below is a chart of the Dow Jones Industrial Average during the Depression. Even if one hung on after the enormous rally of nearly 50% that followed the initial 1929 low, the market's initial break of that low (the first horizontal bar) was followed several months later by a rebound to that prior level of support. The break of the second intermediate low of early 1931 (the second horizontal bar) was followed by a rebound later in the year to that same level. Third break, same story.
It is a typical market dynamic to have massive rallies toward prior levels of support, even within ongoing market declines. Once valuations are favorable, that tendency is even stronger, even in a weakening economy. Only the final panic decline of a bear market offers investors virtually no chance to get out on rebounds, but it is precisely that final decline that is recovered almost immediately in the subsequent bull market. It's possible we've already seen the final panic of the current "bear market," though we certainly wouldn't remove our hedges on that expectation. Given the slim prospects for an economic recovery in the near future, my impression is that regardless of what happens over the very near term, we'll observe an additional spate of weakness (possibly from higher levels) early next year as investors give up their remaining patience and decide -as they often do near the end of a bear market - that there's no way that the market or economy can recover, and that there is no "catalyst" that is capable of driving stocks higher. Even if the U.S. economy experiences a much deeper recession, I believe that the 1000-1100 level on the S&P represents a reasonable estimate of "fair value" for the S&P 500. That estimate is somewhat conservative since I am adjusting for the fact that earnings in recent years have been based on very wide profit margins, but could be too conservative given that long-term interest rates are very low. Long-duration instruments like stocks should not be priced off of short-duration instruments like 10-year Treasury bonds, or even 30-year Treasuries, so low interest rates shouldn't make investors recklessly optimistic about their valuation estimates. In any event, I do believe that current levels represent value from the standpoint of long-term investment prospects. As for extreme and less likely benchmarks, the 780 level on the S&P 500 would represent a 50% loss from the market's peak, and would put the market in the lowest 20% of all historical valuations. I would expect heavy demand from value-conscious investors about that level if the market were to decline further, and a decline below that level could be expected to reverse back toward 780 fairly quickly. Further down, but very unlikely at this point from my perspective, the 700 level on the S&P 500 would represent the lowest 10% of historical valuations, 625 would put the market in the lowest 5% of valuations, and anywhere at 600 or below would put the market in the lowest 1% of historical valuations. I don't expect to see such a level, but there it is. Note that these estimates are unaffected by how low earnings might go next quarter or next year. Stocks are not a claim on next quarter's or next year's earnings - they are a claim on an indefinite stream of future cash flows. Recent market conditions seem like they have no precedent only because so many investment professionals know only the data they've lived through. If one actually examines market data from the Great Depression, 1907, and other less extreme panics, one realizes how much the recent decline has already discounted potential economic negatives. At this point, further declines in stock prices simply increase the long-term returns that investors can expect over time. We can't rule out the possibility that investors could get more frightened, or that they might abandon their stocks at prices that would offer extremely high long-term returns to the buyers. It is important to establish exposure slowly, but long-term investors who ignore attractive valuations are not investors at all. As I repeatedly noted when valuations were rich, gains in an overvalued market are generally not retained over the full market cycle. Likewise, weakness in an undervalued market tends to be temporary and impermanent. This distinction is essential. The main damage that investors can do to their financial security at this point would come from selling into steep but impermanent declines. Even in ongoing bear markets, once valuations become favorable, declines through prior levels of support are typically followed by advances back to that support. Remember that if and when things look frightening. It is also important for investors to separate near-term earnings risks from long-term valuations. Earnings are more volatile than stock prices, and year-over-year fluctuations in earnings are not correlated at all with year-over-year fluctuations in stock prices. It is only over the long-term, when we examine stock prices versus the smooth trend of normalized earnings across multiple business cycles, that earnings really matter. Again, if the market cleanly breaks the October lows, our investment position will become less sensitive to market fluctuations because that is where our put option strikes are largely set, but valuations have already improved beyond the point that would justify a full hedge against 100% of our holdings. Market Climate As of last week, the Market Climate for stocks was characterized by moderately favorable valuations and unfavorable but extremely compressed market action. The initial improvements we observed in market action a couple of weeks ago are now more tentative, and the market is only slightly above the level where we would lose that early favorable evidence (which is, not surprisingly, why we have set our option strikes at that same level). If the October lows hold well, we may very well observe a scorching advance in the range of 20-30% as investors re-evaluate the extent to which the market's decline has discounted the probable negatives. A significant break of the October lows could prompt "weak" holders to abandon stocks, which would create a need for a sufficient discount for "strong" holders (mainly value-conscious investors) to purchase those shares. Again, my impression is that in the event of a clear break of October's lows, 780 on the S&P 500 would most probably be where value-conscious investors would exhibit very strong demand. As a side note, do your best to filter out comments like "investors are moving out of stocks and into ..." or "investors are selling into this decline" or "investors are buying into this rally." On balance, investors do not sell shares, and they don't buy shares. Every share purchased is a share sold. The only question is what price movement is required to prompt a buyer and a seller to trade with each other. No money will come off the sidelines into stocks. No money will come out of stocks and onto the sidelines. All such talk is non-equilibrium idiocy. Keep in mind that the "market" consists of different traders with a variety of time-horizons, risk-tolerances, and analytical methods (e.g. technical, report-driven, value-conscious). It is helpful to think in terms of which group of individuals is likely to do what, and when. It is equally important to know which group of investors you belong to. As the old saying goes, if you're at a poker table and you don't know who the patsy is, you're the patsy. In bonds, the Market Climate last week was characterized by relatively neutral yield levels and relatively neutral yield pressures. In the Strategic Total Return Fund, most of our fixed income holdings remain in Treasury Inflation Protected Securities, with about 30% of assets diversified across precious metals shares, utility shares, and foreign currencies. --- The foregoing comments represent the general investment analysis and economic views of the Advisor, and are provided solely for the purpose of information, instruction and discourse. Prospectuses for the Hussman Strategic Growth Fund, the Hussman Strategic Total Return Fund, the Hussman Strategic International Fund, and the Hussman Strategic Dividend Value Fund, as well as Fund reports and other information, are available by clicking "The Funds" menu button from any page of this website. |
|||||||||||||||||||||||||
|
For more information about investing in the Hussman Funds, please call us at
1-800-HUSSMAN (1-800-487-7626) 513-326-3551 outside the United States Site and site contents © copyright Hussman Funds. Brief quotations including attribution and a direct link to this site (www.hussmanfunds.com) are authorized. All other rights reserved and actively enforced. Extensive or unattributed reproduction of text or research findings are violations of copyright law. Site design by 1WebsiteDesigners. |