|
|
||||||
|
|

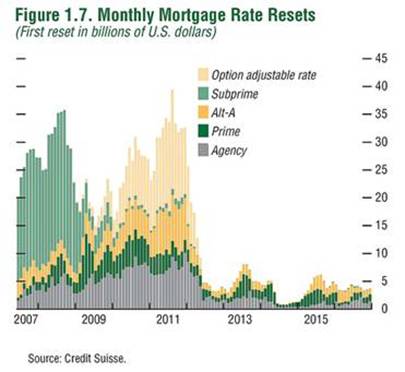
November 9, 2009 The Second Wave Begins A note regarding annual distributions: the Hussman Funds generally pay required annual capital gains distributions during the month of November. As in prior years, our policy is not to announce the exact date of these distributions. For 2009, no capital gain distribution is required for the Strategic Growth Fund. The distribution for the Strategic Total Return Fund is expected to be approximately 0.165 per share (1.35% of the prevailing net asset value), primarily characterized as short-term capital gains. --- Let's begin with a news item from last week. "RealtyTrac today released its Q3 2009 Metropolitan Foreclosure Market Report, which shows that cities in California, Florida, and Nevada accounted for the 10 highest foreclosure rates in the third quarter among metro areas with a population of 200,000 or more. But five of those Top 10 metro areas reported decreasing foreclosure activity from the third quarter of 2008, while many other metro areas with Top 50 foreclosure rates reported sharp increases in foreclosure activity." "Rising unemployment and a new variety of mortgage resets continued to gradually shift the nation's foreclosure epicenters in the third quarter away from the hot spots of the last two years and toward some metro areas that had avoided the brunt of the first foreclosure wave," said James J. Saccacio, chief executive officer of RealtyTrac. "While toxic subprime mortgages drove much of that first wave of foreclosures, high unemployment and exotic Alt-A and Option ARMs are spreading the foreclosure flood to more metro areas in 2009." While the news itself is no surprise in the sense that we have expected and written about this situation repeatedly in recent months, the phrase "sharp increases in foreclosure activity" is notable in the context of widespread views that credit difficulties are abating. Below is a reminder of where we stand in relation to the reset curve. This news of a shift in the character of foreclosure activity comes precisely in tandem with the beginning of the predictable second wave. The pleasant lull in the reset schedule is decidedly behind us.
I should also note some features of the resets we are now beginning to observe. It is tempting to think that with Treasury yields fairly low, mortgage resets might be fairly benign in terms of their impact. The problem is that these Option ARM and Alt-A structures were specifically designed as "teasers" - allowing loans to be made without documentation of creditworthiness, in return for post-reset interest terms that were generally higher than a documented lender would have paid. The mortgages certainly do not reset at Treasury bill yields or even at standard spreads over LIBOR. Instead, they reset to a "premium" spread above those rates. That "yield spread premium" is precisely what the homeowners agreed to in return for the undocumented loan, and is particularly obnoxious at the point of reset if the mortgage itself is underwater (loan amount in excess of home value). Given that these mortgages were written during the last stages of the housing boom, at the highest prices, it is reasonable to assume they now sport very high loan-to-value ratios. Similarly, Option ARM mortgages typically have very permissive payment schedules prior to the reset date, which have allowed homeowners to essentially live in these houses (at least temporarily) with fairly discretionary payments. The data suggest that most of these borrowers have allowed their mortgages to "negatively amortize," allowing the loan balances to grow larger even as property values have depreciated. Once again, the resets on these are problematic for borrowers with questionable creditworthiness, who bought the homes largely in anticipation of price appreciation. For these borrowers, the transition from discretionary payments to more demanding terms is unlikely to be smooth. Meanwhile, clearly the best news in Friday's unemployment report, from our standpoint, was the modest 34,000 increase in temporary jobs. While that was well below the pace that we would normally see several months into a putative economic recovery, the figure was at least positive. Aside from that, the unemployment rate jumped to 10.2%, reflecting a loss of 8.4 million civilian jobs since November 2007. As I noted in High Loan-to-Value Plus Trigger Event (Unemployment) = Default, the combination of deeply underwater mortgages, poor employment conditions, and a heavy reset schedule is not friendly. While we observed some moderate improvement in the rate of net job losses in the establishment survey (190,000 jobs lost in October, compared with 219,000 in September and 154,000 in August), the figures from the somewhat more volatile household survey have been absolutely brutal (589,000 jobs lost in October, compared with 795,000 in September and 392,000 in August). Note that weekly new unemployment claims have been running over 500,000 per week, so we're seeing a very rapid turnover in job loss and creation here. This is apparently driving much larger than normal disparities in the monthly numbers from the establishment and household surveys. As economist David Rosenberg notes, what's odd about the disparity is that coming out of past recessions, the household survey has generally turned higher first. Rosenberg also notes that U6, the broadest measure of unemployment (which includes discouraged workers) is now at 17.5%. Rather than mince arguments about which survey is more reliable at turning points, the chart below simply averages the two, and smoothes the data somewhat by looking at quarterly job growth as a percentage of the labor force. Although I've shaded the chart as others have invariably done, showing the recession as having ended in June, the pace of quarter-over-quarter job losses here is still worse than all but the most severe 4 months of the 1974-75 recession, and the single worst month of the 1980 recession, so it's clear that the employment news is "good" only in relation to the frenetic losses we observed early this year. Moreover, the rate of job losses across these surveys has actually worsened in recent months.
None of this is to say that conditions can't improve - again, the small gain in temporary employment last month was a hopeful sign - but employment conditions remain dismal from an objective standpoint. This is a clear risk factor, given that we are just beginning the second wave of mortgage resets. Market Climate As of last week, the Market Climate in stocks was characterized by unfavorable valuations and mixed market action. We're seeing an increasing number of internal divergences, though not to the extent that would justify a major warning. Overall, our approach in the Strategic Growth Fund is largely to modestly expand market exposure on weakness and clip it on strength. Currently, the Fund has a very slightly positive exposure to market fluctuations, but our primary concern continues to be downside risk, which would shift to a major concern if we observe further internal deteriorations. For now, my impression is that stocks are not priced to deliver satisfactory long-term returns, and that intermediate-term conditions remain overbought. There is some latitude for very small exposures based on near-term market fluctuations of several percent in either direction, but again, our main concern here continues to be defense. In bonds, the Market Climate improved somewhat last week with the uptick in Treasury yields. The same factors that have buoyed precious metals and hurt the dollar (downward pressure on real interest rates) has brought TIPS yields to a relatively low level, so on yield spikes, our tendency is likely to be to add to straight Treasuries and to de-emphasize TIPS. I continue to expect longer-term inflation pressures several years out, but the risk of fresh credit concerns is likely to keep near-term inflation pressures relatively restrained (as those concerns create demand for default-free government liabilities, despite the huge amount of issuance in these liabilities). That puts TIPS in something of a "negative carry" position, and requires investors concerned about long-term inflation to accept low coupon yields and low inflation compensation over the near-term, and limits the likely upside from here - at least until we observe more well-defined inflation concerns. Likewise, in precious metals, market conditions aren't particularly conducive to sustained strength absent inflation pressures and further dollar weakness, so the Strategic Total Return Fund has very little exposure - about 1% of assets - to this sector at present. Aside from Treasuries and precious metals, the Fund continues to hold about 4% of assets in foreign currencies and about 4% of assets in utility shares, all of which reflects a fairly conservative overall stance at present. NEW from Bill Hester: Forward Looking Measures Still Don't Provide Evidence for a V-Shaped Recovery --- The foregoing comments represent the general investment analysis and economic views of the Advisor, and are provided solely for the purpose of information, instruction and discourse. Prospectuses for the Hussman Strategic Growth Fund, the Hussman Strategic Total Return Fund, the Hussman Strategic International Fund, and the Hussman Strategic Dividend Value Fund, as well as Fund reports and other information, are available by clicking "The Funds" menu button from any page of this website. |
|||||||||||||||||||||||||
|
For more information about investing in the Hussman Funds, please call us at
1-800-HUSSMAN (1-800-487-7626) 513-326-3551 outside the United States Site and site contents © copyright Hussman Funds. Brief quotations including attribution and a direct link to this site (www.hussmanfunds.com) are authorized. All other rights reserved and actively enforced. Extensive or unattributed reproduction of text or research findings are violations of copyright law. Site design by 1WebsiteDesigners. |