|
|
||||||
|
|

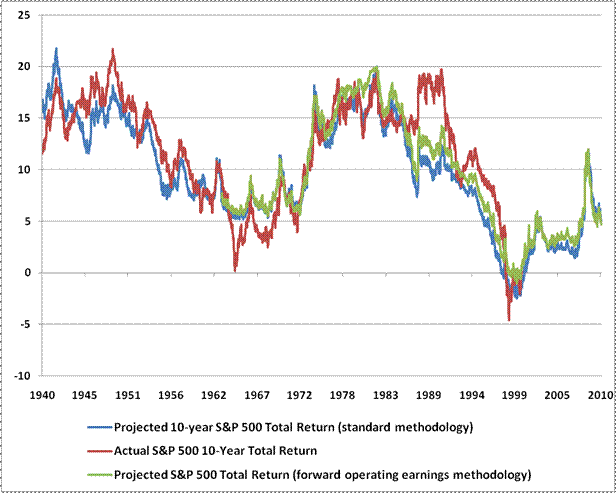
November 1, 2010 Lessons From a Lost Decade Over the past decade, stock market investors have experienced enormous volatility, including two separate market declines in excess of 50%. Despite periodic advances, at the end of it all, as a reward for their patience, investors have achieved an average annual total return of approximately zero. If the past decade has been a lesson for investors, that lesson should have two components. The first is that valuations matter. Though valuations often have little impact on short-term returns over periods of less than a few years, they are undoubtedly the single best predictor of long-term market returns. Moreover, high valuations are ultimately followed by far deeper periodic losses than emerge from low valuations. Put simply, greater risk does not imply greater reward if the risks that investors take are overvalued and inefficient ones. The second lesson is that the effects of wasteful misallocation of capital cannot be fixed by policies that encourage the wasteful misallocation of capital. Fortunately or unfortunately, policies can often help to prop up unsustainable patterns of activity in order to "kick the can down the road." This can postpone major economic adjustments, but often makes the ultimate adjustment even worse. Put simply, policies and investment practices that are effective and friendly to the short-term can often be destructive and violent to the long-term, particularly when those policies and practices encourage the misallocation of capital. Presently, investors are resting their financial security on hopes about quantitative easing - a policy that is essentially intended to skew the allocation of capital and provoke risk-taking in an environment where risk premiums are already thin. Valuations When starting valuations are elevated, investors require similarly elevated terminal valuations - 3 years, 5 years, 7 years, 10 years and further into the future - in order for stocks to achieve acceptable long-term returns. Investors and analysts entirely miss the point when they propose that stocks are "fairly valued" based on a short-term condition, whether it is the prevailing level of 10-year bond yields (which can change significantly over periods of much less than 10 years), the current inflation rate, or the expected level of next quarter's profits. Once valuations become elevated, particularly on profit margins that are also already elevated, investors require terminal valuations to be stretched to the limit, years and years into the future, in order for their speculation to be bailed out. At present, stock valuations are elevated on a variety of smooth metrics. In contrast, stocks appear reasonably valued only on metrics which place excessive weight on short-term factors, and which can therefore be shown to perform poorly in historical data. Based on our standard methodology (see The Likely Range of Market Returns in the Coming Decade for the basic approach) we estimate that the S&P 500 is priced to achieve a 10-year total return of just 5.05% annually. Using our forward operating earnings methodology (see Valuing the S&P 500 Using Forward Operating Earnings), the projected 10-year total return is just 4.69% annually. With the S&P 500 dividend yield at 1.96%, the 10-year projection from dividend-based models is even lower, at about 2.30% annually (though prospects are good that faster growth of index-level dividends will bring that estimate closer to earnings-based projections, see No Margin of Safety, No Room for Error). Overall, the projected returns for the S&P 500 are now lower than at any time in U.S. history prior to the bubble period since the late-1990's (which has resulted in predictably dismal returns for investors). At present, investors rely on a continuation of this bubble to achieve further returns. With respect to the bubble period, the current projected returns match those we observed at the April 2010 high, and are at about the same level as we observed before prices collapsed in 2008. Valuations were even more extreme, of course, at the bubble peak of 2000, which was predictably followed by a decade of zero returns. Keep in mind that near-term returns much higher than 5% annually would essentially be shifted from future years, meaning that higher returns today simply imply even lower long-term return prospects tomorrow. For very long-term investors, say 15 years or more, such variations hardly matter. By our estimates, investors are looking at prospective 15-year total returns in the range 5.8-6.5% annually, with enormous volatility in the interim, no matter how you cut it.
I should note that while I clearly underestimated the extent to which investors would concentrate their 10-year return prospects into an 8-month span from March to November of 2009, this was no fault of the valuation methods. Rather, I refused to discard lessons from prior historical credit crises in the U.S. and internationally. Except for the relatively contained S&L crisis, no major credit crises were observed in post-1940 U.S. data (which is what we use most heavily in our investment analysis). It is unfortunate that we would have actually performed better if I had assumed that the recent downturn was nothing but a typical post-1940 recession and recovery, but I am still convinced that this would not have been appropriate. When you develop a model using some set of data that includes valuations, market action, economic conditions, and other variables, you can't reasonably apply it to data that is clearly "out of sample" and unrepresentative of what you observed in the data underlying the model. Rather, it's essential to examine additional data that is as representative as possible of conditions you actually observe. In the case of 2009, we could not rule out other post-credit crisis evidence (such as pre-1940 data), and (unfortunately, as it turned out) that data implied the need for much more stringent valuation criteria than post-war data did. I remain unconvinced even now that we should view the current economic climate as a standard post-war economic cycle. Still, the experience of the past few years has clearly added to our post-war dataset in that it now contains a full-blown credit-crisis. Every new data point adds information, either in creating new distinctions, or increasing confidence in the distinctions one has already learned. The past three years have confirmed much of what we already knew about valuation, while the enormous volatility of prices, despite an overall market loss, has contributed significantly to our analysis of market action. In any event, whether or not one believes the current economic cycle should be viewed as a "typical post-war recovery," it is clear that our valuation methods have been accurate measures of likely market returns over time - even during the recent crisis. At present, the long-term outlook for equities is unfavorable on the basis of valuation, so regardless of shorter-tem influences, I expect that long-term investors are likely to be ill-served by investing in stocks at current levels. Fed Policy and QE Over the short run, two policies have been primarily responsible for successfully kicking the can down the road following the recent financial crisis. The first was the suppression of fair and accurate financial disclosure - specifically FASB suspension of mark-to-market rules - which has allowed financial companies to present balance sheets that are detached from any need to reflect the actual liquidating value of their assets. The second was the de facto grant of the government's full faith and credit to Fannie Mae and Freddie Mac securities. Now, since standing behind insolvent debt in order to make it whole is strictly an act of fiscal policy, one would think that under the Constitution, it would have been subject to Congressional debate and democratic process. But the Bernanke Fed evidently views democracy as a clumsy extravagance, and so, the Fed accumulated $1.5 trillion in the debt obligations of these insolvent agencies, which effectively forces the public to make those obligations whole, without any actual need for public input on the matter. Notably, what kicked the can was not quantitative easing per se, but rather the effective guarantee of Fannie and Freddie's debts. In and of itself, QE did nothing but to provoke a decline in monetary velocity proportional to the expansion in the monetary base, with little effect on either real GDP or inflation. When QE was pursued in Japan, it did nothing but to provoke a decline in monetary velocity proportional to the expansion in the monetary base, with little effect on either real GDP or inflation. In our view, an additional round of quantitative easing will do nothing but to provoke a decline in monetary velocity proportional to the expansion in the monetary base, with little effect on either real GDP or inflation. We do anticipate inflation over a longer horizon, but most likely not until the second half of this decade. Meanwhile, financial assets such as stocks, bonds and the U.S. dollar largely reflect expectations of a large and sustained volume of QE, as well as success of that policy in provoking real GDP growth. But just as in Rudiger Dornbusch's model of exchange rate overshooting, it is unanticipated policy that produces price shifts in the asset markets - not the follow through of anticipated policy. It is difficult to see what unanticipated, positive surprises the market continues to await. Market Climate As of last week, the Market Climate for stocks was characterized by strenuous overvaluation, overbought price action, overbullish sentiment, and a shift to neutral though not yet rising yield pressures. The Investors Intelligence data shows a significant shift from the "correction" camp to the bullish camp among investment advisors, with 45.6% bulls and 24.4% bears. The more volatile American Association of Individual Investors poll shows an even wider skew, with 51.6% bulls and just 21.6% bears. On the economic front, we have not cleared the economic concerns of recent months. The data has been somewhat better than expected, but certainly not decisively so. Weekly unemployment claims came in better than expected last week, but if you compare the original releases to the revised data, it's interesting to note that over the past few months, every single week's data has been revised upward by thousands of additional new claims that somehow never made it into the headline figure. The third quarter GDP report, showing 2% annual growth, was also interesting. As David Rosenberg observed, 70% of last quarter's growth represented inventory growth, while real final sales posted an annual gain of just 0.6%. While analysts evidently celebrated a pickup in consumption, it's problematic that this spending was evidently financed by government transfer payments. Note that personal income excluding transfer payments has flatlined. This is hardly a model of sustainability.
This isn't to say that the economy will necessarily turn down. We have indeed observed a limited amount of improvement in various leading indicators. For example, the ECRI Weekly Leading Index has improved from its July low of -11% to a current reading of -6.5%. Then again, the WLI improved from a reading of -10.9% in March 2008 to -5.9% by May of that year, so we shouldn't be too quick to imbue modest fluctuations with great meaning when the overall readings are still negative. Probably the best way to characterize the U.S. economy here is that short-term activity has been reasonably quiet and modestly positive, but that this progress is taking place over a far more fragile structure than observers may appreciate. The picture is much like a figure skater gliding over thin ice. Both the Strategic Growth Fund and the Strategic International Equity Fund are well hedged here - Strategic Growth with a fully hedged and "staggered strike" position, International Equity with most but not all of its equity exposure hedged, as well as hedging about one-quarter of its foreign currency exposure. In bonds, the Market Climate last week was characterized by unfavorable yield levels and relatively neutral yield pressures. We don't observe yield pressures that are outright hostile, but longer-term bond yields have been climbing modestly after the initial QE exuberance. For our part, the Strategic Total Return Fund continues to have a short duration of only about 1.5 years, with only about 3% of assets in precious metals shares, 1% in foreign currencies, and 2% in utility shares. This is clearly a defensive and risk-averse position for us, and is consistent with what we view as an overextension in nearly all classes of risk assets. With yields recently falling toward historic lows, bond investors have increasingly recognized that the long bull market in bonds since the 1980's may be behind us. As far as Strategic Total Return is concerned, it is important to recognize that we tend to shift our investment stance in response to shifts in market conditions a few times a year, on average. The strategy of Strategic Total Return has never relied much on the existence of a bull market in bonds (indeed, our average bond duration has rarely exceeded 4 years since the inception of the Fund, and has often been limited to just 1-2 years). Since bond yields rarely advance in a straight line, I expect that we will continue to observe opportunities to shift our investment positions a few times annually. Indeed, from an investment standpoint, higher average yields present much better periodic investment opportunities than low average yields do, as long as yields aren't rising in a straight line. My own impression is that bond yields are likely to register their lows in one last hurrah in response to further credit strains, most likely at some point next year, but in the absence of those strains, QE alone is not likely to induce much additional decline in yields. In my view, QE is already largely priced in, and even if the Fed announces a trillion dollars of Treasury purchases, the fact is that the Federal government would still issue more new debt this year alone than the Fed would absorb. --- The foregoing comments represent the general investment analysis and economic views of the Advisor, and are provided solely for the purpose of information, instruction and discourse. Prospectuses for the Hussman Strategic Growth Fund, the Hussman Strategic Total Return Fund, the Hussman Strategic International Fund, and the Hussman Strategic Dividend Value Fund, as well as Fund reports and other information, are available by clicking "The Funds" menu button from any page of this website. |
|||||||||||||||||||||||||
|
For more information about investing in the Hussman Funds, please call us at
1-800-HUSSMAN (1-800-487-7626) 513-326-3551 outside the United States Site and site contents © copyright Hussman Funds. Brief quotations including attribution and a direct link to this site (www.hussmanfunds.com) are authorized. All other rights reserved and actively enforced. Extensive or unattributed reproduction of text or research findings are violations of copyright law. Site design by 1WebsiteDesigners. |