|
|
||||||
|
|

March 14, 2011 Anatomy of a Bubble Over the past decade, investors have seen near-parabolic advances in a variety of assets, followed by crashes. These have included dot-com stocks (which peaked and crashed well before the general market peak in 2000), technology stocks, housing, commodities, and stocks in a variety of emerging markets. These experiences have made investors somewhat more attuned to the destructive potential for speculative bubbles in various assets, but has also created something of a "casino economy" where a great deal of resources are directed in hopes of participating in these bubbles. What exactly is a "bubble?" Informally, we can think of a bubble as an advance in an asset's price to levels that are "detached from fundamentals" - essentially, the primary motive for investing ceases to be the expectation of future cash flows or consumption, and instead centers on the expectation of further increases in price. From this perspective, a bubble emerges at the point where a continual increase in the ratio of prices to fundamentals is required in order for investors to achieve satisfactory returns. Formally, a bubble can be defined as a "non-fundamental" component of price which grows exponentially. Think about stocks. Let "k" be the long-term return that investors expect stocks to achieve. If these expectations are correct, then next year's price Pt+1 will just be (1+k) times today's price Pt, minus whatever dividend Dt will be paid. The next year's price is determined the same way. If you write this out and solve the difference equation, you'll get a solution that looks like this: Pt = Vt + Bt, where Vt is just the discounted value of expected future dividends, and Bt is an arbitrary constant. It can be anything, so long as it obeys Bt+1 = (1+k)Bt. Mathematically, Bt is a "bubble component" of prices. If that component Bt is not zero, the price will gradually "explode" away from any relationship with fundamentals. Moreover, the present discounted value of the future price will not tend toward zero no matter how far into the future you look. Ultimately, this sort of price path is ruled out by the fact that the value of stocks cannot grow infinitely larger than the economy, so bubbles ultimately crash. But over the short-run, there is little to prevent investors from putting a little bit of "B" into prices from time to time. This becomes pathological when the sustained price gains expected by investors diverge significantly from the growth rate of the overall economy. In short, a bubble is an advance in prices that "substitutes" for fundamentals, in the sense that the realized return on the investment continues to be positive even after the asset is no longer priced to achieve satisfactory returns on the basis of expected future cash flows (or in the case of housing and commodities, future consumption value or other services). The effect of valuation levels and valuation changes on S&P 500 total returns When valuations are reasonable, investors can expect satisfactory long-term returns simply on the basis of the stream of cash flows they receive over time. But once valuations are elevated, investors become increasingly reliant on pure increases in prices and valuations in order to achieve satisfactory returns. This is easily seen in historical data for the S&P 500. The chart below is based on post-war U.S. data, and illustrates the interaction between valuation levels and valuation changes in producing long-term total returns for the S&P 500, and expands on some of Mike Shedlock's recent observations on valuations and prospective returns. As I've frequently noted, Depression-era data is far more hostile than post-war data, as is data surrounding other historical and international credit crises, so investors would have needed more stringent valuation criteria in order to accept market risk during these periods. Still, post-war data is sufficient to convey some important ideas. The first two columns below reflect the Shiller P/E (also known as the "cyclically adjusted" price/earnings ratio), and the frequency of various P/E ranges in historical data. The next two columns show the average annual total return of the S&P 500 Index, based on whether the Shiller P/E rose to a higher level during the 10- or 5-year horizon, or whether it fell to a lower level by the end of that horizon. The next column is the percentage of observations where the P/E was higher at the end of the horizon, and the last column is the weighted average return for each level of Shiller P/Es.
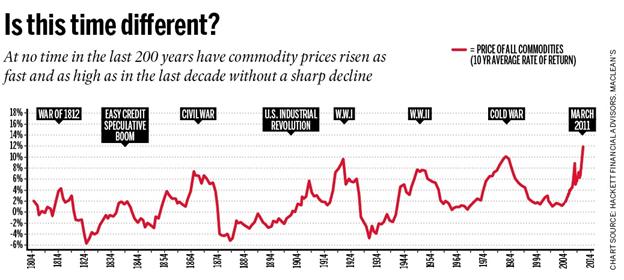
Notice that regardless of whether P/E ratios rose or fell during these investment periods, subsequent returns were substantially higher from low valuations than from high ones. Of course, subsequent returns were higher for horizons where the P/E increased than for those where the P/E fell. It is also important, though not surprising, that low initial valuations were associated with a far higher probability of rising valuations in the future. With low valuations, investors have enjoyed the prospect for high expected returns even if valuations contracted further, and also faced a high probability that a future increase in P/E multiples would add further to their returns. In contrast, high valuations have been associated with poor average returns, and a low probability of further increases in valuation multiples. Since data is available for 5-year returns through 2006, but only through 2001 for 10-year returns, the two tables cover slightly different horizons since 1940. Notably, the frequency of Shiller P/Es greater than 24 is 15.3% in 5-year data but only 9.3% in 10-year data. This is because extreme valuations have been the norm in recent years (where the P/E has exceeded 24 over half the time, interrupted only briefly by the recent plunge and rebound). Presently, the Shiller P/E stands at 24. Be careful how you interpret the data in the table for Shiller P/E's above 24, since these levels were almost never observed in data prior to the late-1990's market bubble. You can see the odd effect of the bubble on the P/E categories above 20. The recent tendency for high valuations to move even higher over the short-term, coupled with the rapid recovery of much of the 2008-2009 loss, creates a "hump" in the 5-year profile - average returns first decline as valuations increase, and then actually improve for the 20-24 bracket. This is an artifact of recent years, and appears neither in pre-1995 data nor in 10-year return data. Indeed, outside of the bubble period since the late 1990's, the only historical instance of Shiller P/Es materially above 24 was between August and early-October of 1929. The closest we got to 24 in post-war data was in mid-1965. While prices went on to achieve moderately higher levels (lagging earnings growth, so that the Shiller multiple fell), the mid-1965 valuation peak is widely viewed as the starting point for a 17-year "secular" bear market during which the S&P 500 achieved total returns of less than 5% annually through 1982, despite severe inflation. That's a good reminder that stocks are not a very good inflation hedge during periods when inflation is rising, particularly when stock valuations are already elevated and are priced to achieve poor returns. Stocks only "benefit" from inflation during hyperinflations and during sustained and anticipated inflations. In other cases, the eventual adjustments in economic activity and valuations overwhelm the "beneficial" effect of inflation on earnings. The implication of this data for long-term returns is clear. With the Shiller P/E presently at 24, we observe about the same implications for 10-year S&P 500 total returns as we obtain from our broader valuation methods (expected total returns averaging about 3.5% annually). Still, the actual course of total returns will depend on whether valuations become even more extended over the next 5-10 years, or if they contract instead. Even if one includes data from the late-1990's bubble, the probability of rising P/E multiples from these levels is less than 1-in-5. Still, if one wishes to bet on a bubble, there is no reason set in stone that the market cannot achieve further gains. The question investors should ask, however, is whether confident prospects for a radiant economic future are likely to capture the imaginations of investors to anywhere near the extent that we observed during the late 1990's. The answer matters, because if we exclude the bubble period, the historical probability of rising P/E multiples from present levels effectively drops to zero - similar valuations were always followed by a contraction in multiples. Long-term versus near-term I want to emphasize that the arguments above relate to 5-year and 10-year horizons, and not how the market may perform over the next several months or quarters. Over shorter periods of time, the strength and uniformity of market internals conveys important information about the willingness of investors to accept risk. Even if we observe rich valuations, there can be some justification for accepting market risk during periods when market internals are uniformly strong, provided that the environment is not also characterized by a syndrome of overbought, overbullish and rising-interest rate conditions. Accordingly, if we can clear at least one component of that syndrome (most likely the overbought or overbullish aspect) without also provoking a broader deterioration in market internals, we'll have a reasonable window in which to accept a moderate exposure to market fluctuations. A correction to the lower-1100's on the S&P 500, without a material breakdown in broader market internals, would likely open that window. Here and now, market conditions imply a negative average return/risk profile for stocks, but clearing some component of that syndrome (again, barring a broader breakdown in market internals) should shift the expected return profile to a modestly favorable average, allowing us to reduce the extent of our hedges. Of course, we're likely to retain a "line" of defense with index put options, to protect against any abrupt further declines or broad deterioration in market internals. But it's important to emphasize that despite our dour view of long-term return prospects, those views don't necessarily translate into an avoidance of moderate exposure to market fluctuations over the short- and intermediate-term. We're very mindful of risk here, but shareholders can also expect us to accept moderate, periodic exposure to market fluctuations more frequently, on the basis of the expanded set of Market Climates we introduced last year. For now, we're defensive and tightly hedged (though we've reduced the number of our short call options in recent weeks in response to market weakness). That tight defensiveness may only persist for another week, possibly several weeks, but probably not months unless we observe a material breakdown in market internals. We'll take our evidence as it comes. In any event, our longer-term view of market prospects is quite restrained, and we remain concerned about latent economic risks, so even if we have constructive opportunities over the intermediate term, we expect to maintain a line of defense against more serious downside risks. Classic bubbles - parabolic advances and log-periodic fluctuations From our perspective, there is at least a small "bubble" component at play when markets advance over the short run, despite being priced to achieve poor returns in the long-run. In effect, investors in these markets are taking on speculative risk, in the expectation that other investors will be willing to pay even higher prices. Whatever one wishes to say about the rationality of investors during these periods, the historical evidence is that certain features of market action (particularly broad uniformity of market internals) is a useful metric of investors' willingness to speculate. As I've frequently noted, neither market action, nor trend-following measures, nor an easy Fed has been sufficient once the overvaluation is coupled with overbought, overbullish, rising-interest rate conditions. But even during post-credit crisis periods, some combinations of market conditions have warranted at least a moderate speculative exposure to market fluctuations despite rich valuations. In the stock market, I believe that there is indeed a "bubble" component in current prices, but it is not nearly as large as we observed in the approach to the 2000 peak, nor as extreme as we observed on the approach to the 2007 peak. My hope is that investors have learned something. That's not entirely clear, but we'll be as flexible as we can while also being mindful of the risks. While my view is that bubble components can come and go in the markets, they sometimes become so large and well-defined that they take on a very distinct profile. Such bubbles included the advance to the 2000 stock market peak, the housing bubble, the advance in oil prices to their peak in 2008, the advance in the Nikkei in the late 1980's, and other clearly parabolic advances. On that note, it's clear to me that we're seeing classic bubbles in a variety of commodities. It is very unlikely that this is simply due to global demand growth. Even with an exhaustible resource, it is a well-known economic result (Hotelling's rule) that the optimal extraction rule is one where the price rises at a rate not much different from the interest rate. What we've seen lately is commodity hoarding, predictably resulting from negative real interest rates provoked by the Fed's policy of quantitative easing.
Fortunately for the world's poor, the speculative dynamic that has created a massive surge in commodity prices appears very close to running its course, as we see very similar "microdynamics" in agricultural commodities as we saw with oil in 2008. That's not to say that we have a good idea of precisely how high prices will move over the short term. The blowoff phase of a bubble tends to be steep, but so short-lived that it affords little opportunity to exit. As prices advance in an uncorrected parabola, the one-sided nature of the speculation typically gives way to a frantic effort of speculators to exit simultaneously. Crashes are always a reflection of illiquidity in two-sided trading - the inability of sellers to find eager buyers at nearby prices.
As physicist Didier Sornette has observed, major parabolic bubbles also tend to include shorter-term fluctuations that are increasingly "chaotic" - specifically, there is a tendency for price dynamics to include a "log-periodic" component (which essentially looks like a cosine wave fluctuating at increasing frequency), so that corrections become shallower and more frequent within the parabolic trend. Eventually, these periods culminate in what Sornette calls a "finite-time singularity," which is about the point where the market crashes. In my view, it's somewhat ambitious to use these self-similar fluctuations as the basis to time the end of a bubble, but it's clear that weakly corrected parabolic advances do tend to be unsustainable, and often produce deep and abrupt losses. As I wrote in July 2008 just as oil was spiking to $150 a barrel and headed toward $40 (see The Outlook for Inflation and the Likelihood of $60 Oil ), "When you have to fit a sixth-order polynomial to capture price history because exponential growth is too conservative, you're probably close to a peak." On the subject of commodities, it's a natural question whether gold falls into the same category as agricultural commodities. After all, gold and other hard assets have an important role as an alternative to money to store value, and it appears clear that the world is monetizing in a way that is unlikely to be fully reversed even if policy makers wish to do so down the road. In my view, it's not clear that gold is in a bubble here, but it will be important to watch for the earmarks of a classic bubble. Below, I've plotted the price of gold against a "canonical" log-periodic bubble. Already, we're seeing some behavior that is characteristic of a bubble-type advance. A Sornette-type analysis generates a finite-time singularity as early as April, but there are other fits that are consistent with a more sustained advance. If we observe a virtually uncorrected advance toward about 1500 in the next several weeks, the steep and uncorrected advance would imply an increasing hazard probability.
Again, for my part, I think it's a bit ambitious to use log-periodic functions and other purely mathematical tools to identify bubbles and gauge crash hazards. We prefer more fundamental approaches. While I don't view gold stocks as overvalued relative to the metal (which gives us some margin of safety in the gold shares we own in Strategic Total Return), we have to view the rate and character of the advance in gold with some suspicion. If gold continues a parabolic advance toward 1500, the risk of a very sharp decline in precious metals would increase substantially, in my view. Classic bubbles tend to have a "signature" - parabolic advances with shallow and increasingly frequent corrections. Eventually, you begin to see price spikes at one-day, one-hour and even ten-minute intervals. That's a danger sign to monitor. Remember, if emerging markets stocks have taught investors one thing, it's that it's very possible for a long-term thesis to remain intact and yet have prices suffer significant declines over the intermediate-term. Market Climate As of last week, the Market Climate for stocks remained characterized by an overvalued, overbought, overbullish, rising-interest rate syndrome that has historically been associated with negative returns per unit of risk, on average. Both the Strategic Growth Fund and the Strategic International Equity Fund remain well hedged, though this will change in response to any clearing of this syndrome that does not also produce a significant breakdown in market internals. In the Strategic Total Return Fund, yield pressures improved on a number of measures last week, and we responded by modestly increasing the duration of the Fund to about 3.5 years (meaning that a 100 basis point change in interest rates would affect the Fund by about 3.5% on the basis of bond price fluctuations). The Fund continues to hold about 8% of assets in precious metals shares, and we continue to view those shares as reasonably priced in relation to the metal itself. That said, the near-parabolic rise in gold prices is of some concern, as noted above, so we are comfortable with a modest but not aggressive exposure to this asset class. NEW from Bill Hester: An Uneven Global Recovery - Lingering Effects of the Credit Crisis --- The foregoing comments represent the general investment analysis and economic views of the Advisor, and are provided solely for the purpose of information, instruction and discourse. Prospectuses for the Hussman Strategic Growth Fund, the Hussman Strategic Total Return Fund, the Hussman Strategic International Fund, and the Hussman Strategic Dividend Value Fund, as well as Fund reports and other information, are available by clicking "The Funds" menu button from any page of this website. |
|||||||||||||||||||||||||
|
For more information about investing in the Hussman Funds, please call us at
1-800-HUSSMAN (1-800-487-7626) 513-326-3551 outside the United States Site and site contents © copyright Hussman Funds. Brief quotations including attribution and a direct link to this site (www.hussmanfunds.com) are authorized. All other rights reserved and actively enforced. Extensive or unattributed reproduction of text or research findings are violations of copyright law. Site design by 1WebsiteDesigners. |