|
|
||||||
|
|

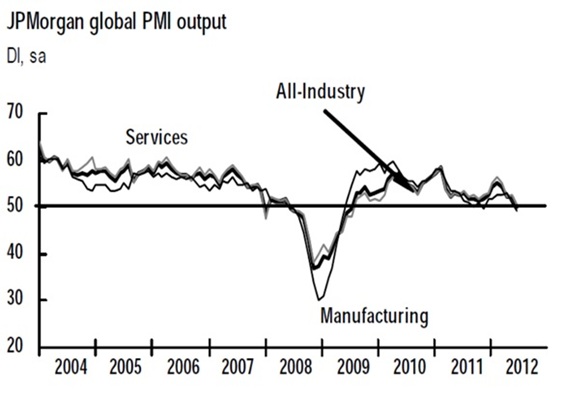
July 9, 2012 What if the Fed Throws a QE3 and Nobody Comes? The financial markets were largely unresponsive to news of further easing by the European Central Bank, the Bank of England, and the People’s Bank of China last week. Notably, Spanish bonds plunged, while German short-term government bonds now yield -0.17%, indicating growing concern about sovereign default risk in the Euro area. Every few days will undoubtedly bring word of new “agreements” and “mechanisms” – arcane enough to mask their futility – that promise to solve the European crisis. The headwinds remain very strong. The key distinction here remains liquidity versus solvency. There is little doubt that liquidity will be provided at every opportunity, though the continual degrading of collateral standards by the ECB suggests that all the good collateral has been pledged already. More importantly, with a global recession visibly unfolding, solvency risk will only increase. The odds remain against European countries agreeing to the surrender their national sovereignty to the extent needed to create a “fiscal union” and enable massive and endless transfers of public resources from stronger to weaker European countries. Barring a catastrophe severe enough to either prompt European countries to hand fiscal control to a central administrator, or to prompt Germany to agree to unconditional bailouts, the least disruptive move would be for Germany and a handful of stronger countries to leave the Euro first, and allow the remaining members to inflate as they wish. With regard to the economy, I noted two weeks ago that the leading evidence pointed to a further weakening in employment, with an abrupt dropoff in industrial production and new orders. Mike Shedlock reviews the litany of awful figures we’ve seen since then, focusing on the new orders component of global purchasing managers indices: U.S. manufacturing new orders and export orders plunging from expansion to contraction, Eurozone new export orders plunging (only orders from Greece fell at a faster rate than those of Germany), and an accelerating decline in new orders in both China and Japan. Recall that the National Bureau of Economic Research (NBER) often looks for “a well-defined peak or trough in real sales or industrial production” to help determine the specific peak or trough date of an expansion or recession. From that standpoint, the sharp and abrupt decline we’re seeing in new orders is a short-leading precursor of output. As the chart below of global output suggests, I continue to believe that we have reached the point that delineates an expansion from a new recession.
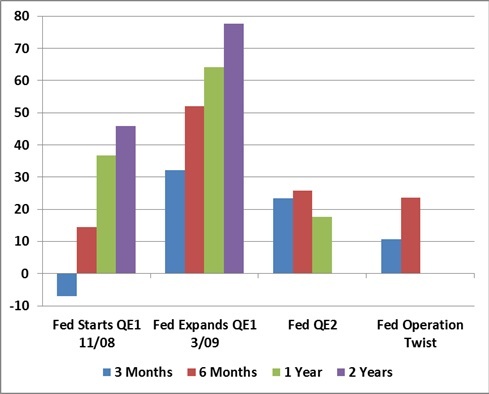
On the employment front, Friday’s disappointing report of 80,000 jobs created in June may be looked on longingly within a few months, as we continue to expect the employment figures to turn negative shortly. That said, it remains important to focus on the joint action of numerous data points, rather than choosing a single figure as an acid test. I noted last week in Enter, the Blindside Recession, GDP and employment figures are subject to substantial revision. Lakshman Achuthan at ECRI has observed the first real-time negative GDP print is often seen two quarters after a recession starts. Earlier data is often subsequently revised negative. As for the June employment figures, the internals provided by the household survey were more dismal than the headline number. The net source of job growth was the 16-19 year-old cohort (even after seasonal adjustment that corrects for normal summer hiring). Employment among workers over 20 years of age actually fell, with a 136,000 plunge in the 25-54 year-old cohort offset by gains in the number of workers over the age of 55. Among those counted as employed, 277,000 workers shifted to the classification “Part-time for economic reasons: slack work or business conditions.” What if the Fed throws a QE3 and nobody comes? To date, the stock market has largely shrugged off the evidence of oncoming recession, in the confidence that the Federal Reserve will easily prevent that outcome and defend the market from any material losses. On that point, it is helpful to remember that the real economic effects of Fed actions in recent years have been limited to short-lived bursts of pent-up demand over a quarter or two. Not surprisingly, as interest rates are already low, and risk-premiums on more aggressive assets are already remarkably thin, the impact of quantitative easing around the globe continues to show evidence of diminishing returns. With the help of some preliminary work from Nautilus Capital, the following charts present the market gains, in percent, that followed versions of quantitative easing by the Federal Reserve, the European Central Bank, and the Bank of England on their respective stock markets, measured by the S&P 500, the Dow Jones EuroStoxx Index, and the FTSE 100, respectively. The Standard & Poor’s 500 index is an index of 500 large-capitalization U.S. stocks, the Dow Jones EuroStoxx Index is an index of 50 large-capitalization European stocks, and the FTSE 100 is an index of 100 large-capitalization companies listed on the London Stock Exchange. Note that it is not possible to invest in an index. In order to give QE the greatest benefit of the doubt and account for any “announcement effects,” the advances in each chart are based on the 3-month, 6-month, 1-year and 2-year gains in each index following the initiation of the intervention, plus any amount of gain enjoyed by the market from its lowest point in the 2 months preceding the actual intervention. The effects of most interventions would look weaker without that boost. The following chart shows Fed interventions against the S&P 500 Index:
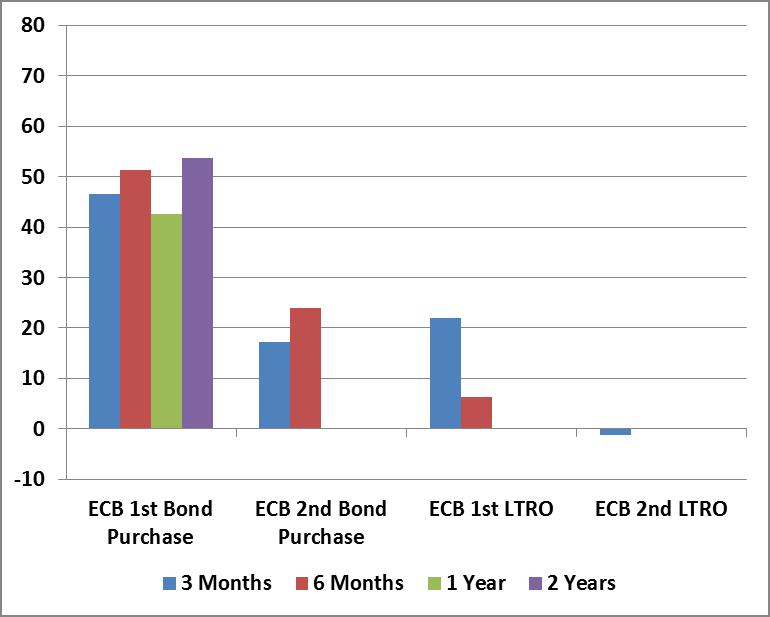
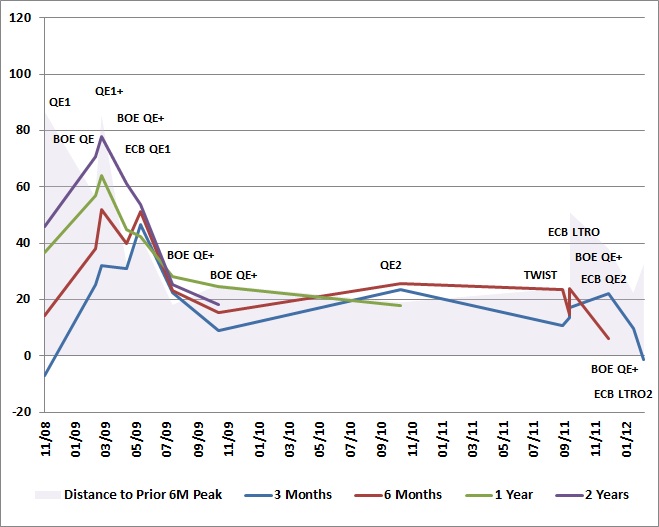
Next, ECB interventions against the Dow Jones EuroStoxx Index. LTRO stands for "Long Term Repurchase Operation," which is the term the European Central Bank (ECB) introduced to describe its quantitative easing program - purchasing bonds such as European government bonds, and creating new Euros as payment.
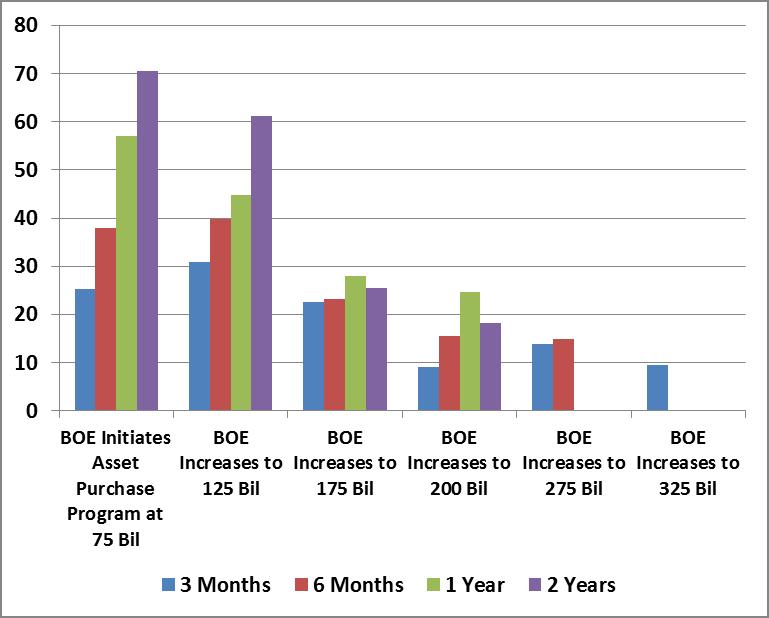
Finally, Bank of England (BOE) interventions against the FTSE 100 Index
Remember that quantitative easing “works” through central bank hoarding of long-duration government bonds, paid for by flooding the financial markets with currency and reserves that essentially bear no interest. As a result, investors in aggregate have more zero-interest cash, and feel forced to reach for yield and speculative gains in more aggressive assets. Of course, in equilibrium, somebody has to hold the cash until it is actually retired (in aggregate, “sideline” cash can’t and doesn’t “go” anywhere). Increasing the quantity simply forces yield discomfort on more and more individuals. The process of bidding up speculative assets ends when holders of zero-interest cash are indifferent between continuing to hold that cash versus holding some other security. In short, the objective of QE is to force risky assets to be priced so richly that they closely compete with zero-interest cash. Understanding this dynamic, it follows that QE will have its greatest impact on financial markets when interest rates and risk-premiums have spiked higher. If interest rates are low already, and risky assets are already priced to achieve weak long-term returns (we estimate that the S&P 500 is likely to achieve total returns of less than 4.8% over the coming decade), there is not nearly as much room for QE to produce a speculative run. Leave aside the question of why this is considered an appropriate policy objective in the first place, given the extraordinarily weak sensitivity of GDP growth to market fluctuations. The key point is this – QE is effective in supporting stock prices and driving risk-premiums down, but only once they are already elevated. As a result, when we look around the globe, we find that the impact of QE is rarely much greater than the market decline that preceded it. To illustrate, each of the Fed, ECB and BOE quantitative easing interventions since 2008 are presented below as a timeline. The shaded area shows the amount of market gain that would be required to recover the peak-to-trough drawdown experienced by the corresponding stock index (S&P for Fed interventions, EuroStoxx for ECB interventions, FTSE for BOE interventions) in the 6-month period preceding the quantitative easing operation. The lines plot the 3-month, 6-month, 1-year and 2-year market gain following each intervention, adding any gain from the low of the preceding 2 months, to account for any "announcement effects." Technically, the lines should not be connected, since they represent the gains following distinct actions of different central banks, but connecting the points shows the clear trend toward less and less effective interventions, with the most recent interventions being flops. Notice also that central banks have typically initiated QE interventions only when the market had somewhere in the area of 18% or more of ground to make up.
Of all the experiments with QE, the round of QE2 from late-2010 to mid-2011 was most effective, in that stocks recovered their prior 6-month peak, and even some additional ground. Yet even with QE2, the Twist and its recent extension, as well as liquidity operations such as dollar swaps and so forth, the S&P 500 is again below its April 2011 peak, and was within 5% of its April 2010 peak just a month ago (April 2010 is a particularly important reference for us, since that is that last point that the ensemble methods we presently use would have had a significantly constructive market exposure). The largely sideways churn since April 2010 reflects repeated interventions to pull a fundamentally fragile economy from the brink of recession, and recessionary pressures are stronger today than they were in either 2010 or 2011. Investors seem to be putting an enormous amount of faith in a policy that does little but help stocks recover the losses of the prior 6 month period, with scant evidence of any durable effects on the real economy. In short, the effect of quantitative easing has diminished substantially since 2009, when risk-premiums were elevated and amenable to being pressed significantly lower. At present, risk-premiums are thin, and the S&P 500 has retreated very little from its April 2012 peak. My impression is that QE3 would (will) be unable to pluck the U.S. out of an unfolding global recession, and that even the ability to provoke a speculative advance in risky assets will be dependent on those assets first declining substantially in value. Our economic problems run far deeper than what can be healed by more reckless bubble-blowing by the Federal Reserve. At the center of global economic turmoil is a mountain of bad debt that was extended on easy terms by weakly regulated lenders with a government safety net. Global leaders have done all they can to protect the lenders at the expense of the public – to make good on the bond contracts of mismanaged financial institutions by breaking the social contracts with their own citizens. The limit of this unprincipled madness is being reached. The way out is to restructure bad debt instead of rescuing it. Particularly in Europe, this will require numerous financial institutions to go into receivership, where stock will be wiped out, unsecured bonds will experience losses, senior bondholders will get a haircut on the value of their obligations, and loan balances will be written down. Bank depositors, meanwhile, will not lose a dime, except in countries where the sovereign is also at risk of default. Even there, depositors will probably not lose any more than they would if they held sovereign debt directly. In the U.S., the pressing need continues to be mortgage restructuring, and an emerging recession is likely to bring that issue back to the forefront, as roughly one-third of U.S. mortgages exceed the value of the home itself. Liquidity does not produce solvency. Bailouts from one insolvent entity to another insolvent entity do not produce solvency. Efforts to stimulate growth will not produce solvency if a large fraction of the economy is overburdened with debt obligations that cannot be repaid. What will produce solvency is debt restructuring. The best hope is that global leaders will recognize the necessity and move ahead with debt restructuring in an orderly way, particularly in the European banking system. The worst nightmare is that global leaders will deny the necessity and belatedly discover that they have squandered the last opportunity to avoid a disorderly finale. Market Climate A quick note on performance – as we’ve noted since the inception of Strategic Growth Fund in 2000, our investment horizon is specifically focused on the complete bull-bear market cycle, measured from bull-market peak to bull-market peak, or bear-market trough to bear-market trough. My view that stocks have entered a new bear market makes it reasonable to examine the most recent cycle, measured from the bull market peak of October 9, 2007 (on the basis of total-return) to the recent peak on April 2, 2012. During the 2000-2007 peak-to-peak cycle, Strategic Growth outperformed the S&P 500 by a cumulative margin of 119.79% vs. 20.70% (11.46% vs. 2.62% on an annual basis). During the 2002-2009 trough-to-trough cycle, Strategic Growth outperformed the S&P 500 by a cumulative margin of 37.95% to -1.25% (5.10% vs. -0.19% on an annual basis). As I observed in numerous annual reports, that full-cycle performance margin was “as intended” – neither extraordinary nor disappointing from the standpoint of our long-term expectations. In contrast, the most recent peak-to-peak cycle from 2007 to 2012 was challenging. For most investors, everything went wrong in the downturn and then everything went right in the recovery. For us, everything went reasonably as expected during the downturn, but my insistence on making our methods robust even to Depression-era data led to a significant “miss” of the market’s recovery in 2009 and early 2010 that will not be repeated in future cycles even under identical conditions and evidence. Largely as a result of that miss, Strategic Growth lagged the S&P 500 during the most recent cycle, by a cumulative margin of -12.91% vs. 0.08% (-3.01% vs. 0.02% on an annual basis). The Funds page includes full historical performance data on all of the Funds, as well as annual reports and other information. In every cycle, Strategic Growth has experienced just a fraction of the downside experienced by the S&P 500 (-6.98 vs. -47.41% for the S&P 500 in the 2000-2007 cycle; -21.45% vs. -55.25% for the S&P 500 in the 2002-2009 trough-to-trough cycle and the 2007-2012 peak-to-peak cycle, both which include the market's 2008 plunge). Our objective of reducing periodic losses isn't assured, and I recognize that nobody can feed a family with reduced downside. But a strategy that generally avoids deep drawdowns is also a strategy that recovers from difficult periods much more easily. The most recent market cycle was an outlier on nearly every basis that investors can imagine. It was – and I am confident it will remain - an outlier from the standpoint of our own full-cycle performance as well. As a side note, from the presumptive bull market peak on April 2, 2012 through Friday of last week, the S&P 500 is down -3.95%, while Strategic Growth is down -0.78%. Needless to say, if the recent bull market establishes a new high, some of the above calculations will change. The essential point remains that our “two data sets” challenge in 2009 through early 2010 more than accounts for the cumulative performance shortfall of less than 13% between Strategic Growth and the S&P 500 in this cycle, and the methods we brought to bear on that problem leave us well prepared for a very wide range of market outcomes in the cycles ahead. We’ll go forward from here. As of last week, our estimates of prospective market return/risk in stocks remained in the most negative 0.5% of historical observations. We’ve examined a range of possible outcomes that could produce a shift in our investment stance. While a further advance would moderately take the “edge” off of our present defensive stance, we also estimate that a fairly small advance would also re-establish an overvalued, overbought, overbullish condition that would weigh on any material risk-taking. So the greatest amount of latitude to accept market risk would be from substantially lower levels. Of course, that’s the most likely point at which another round of QE would be initiated as well. As usual, our willingness to expand our exposure to market risk will remain focused on observable measures, not on some untestable faith-factor. For now, we remain tightly defensive. Strategic Growth remains fully hedged, with a staggered strike hedge (just over 1.5% of assets being committed to raising our put option strikes), Strategic International remains fully hedged, Strategic Dividend Value is hedged close to 50% of its stock holdings (its most defensive stance), and Strategic Total Return has a duration of about one year, just over 10% of assets in precious metals shares, and a few percent of assets in utilities and foreign currencies. --- The foregoing comments represent the general investment analysis and economic views of the Advisor, and are provided solely for the purpose of information, instruction and discourse. Prospectuses for the Hussman Strategic Growth Fund, the Hussman Strategic Total Return Fund, the Hussman Strategic International Fund, and the Hussman Strategic Dividend Value Fund, as well as Fund reports and other information, are available by clicking "The Funds" menu button from any page of this website. |
|||||||||||||||||||||||||
|
For more information about investing in the Hussman Funds, please call us at
1-800-HUSSMAN (1-800-487-7626) 513-326-3551 outside the United States Site and site contents © copyright Hussman Funds. Brief quotations including attribution and a direct link to this site (www.hussmanfunds.com) are authorized. All other rights reserved and actively enforced. Extensive or unattributed reproduction of text or research findings are violations of copyright law. Site design by 1WebsiteDesigners. |