|
|
||||||
|
|

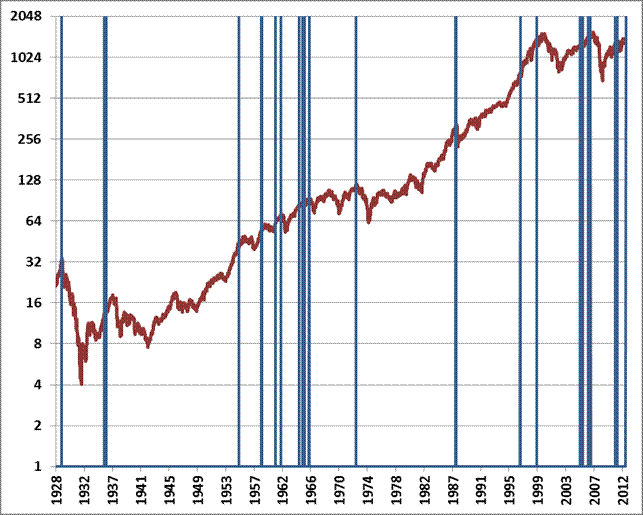
September 17, 2012 Low-Water Mark As of Friday, our estimates of prospective return/risk for the S&P 500 have dropped to the single lowest point we’ve observed in a century of data. There is no way to view this as something other than a warning, but it’s also a warning that I don’t want to overstate. This is an extreme data point, but there has been no abrupt change; no sudden event; no major catalyst. We are no more defensive today than we were a week ago, because conditions have been in the most negative 0.5% of the data for months. This is just the most negative return/risk estimate we've seen. It is what it is. Since we estimate prospective return/risk on a blended horizon of 2-weeks to 18 months, we are not making a statement about the very long-term, but only about intermediate-term horizons (prospective long-term returns have certainly been worse at some points, such as 2000). As always, our estimates represent the average historical outcome that is associated with a given set of conditions, and they don’t ensure that any particular instance will match that average. So while present conditions have been followed by extraordinarily poor market outcomes on average, there’s no assurance that this instance can’t diverge from typical outcomes. Investors should ignore my concerns here if they believe that the proper way to invest is to bet that this time is different. In March of this year, our estimates dropped into the worst 2% of historical observations, and fell to the lowest 0.5% of all observations by April. Note that the only way to achieve an extremely overbought market is for prices to move up through less extreme overbought conditions, without consequence. Likewise, the only way for market conditions to become as extreme as they are at present was for the market to advance despite progressively worsening conditions, without consequence. So we have been wrong, and uncomfortably so, during this advance. The bet of investors, of course, is that global central banks can provide a panacea against the consequences of the rich valuations and excessive debt burdens that those same central banks are responsible for encouraging. Again, investors should ignore my concerns here if they believe that present market levels do not adequately reflect and discount those hopes, or are convinced that these hopes are sufficient to negate other historical evidence. In saying that our prospective return/risk estimates are more negative than at any point in history, it is important to note what we are not saying. We are not saying that stocks are more overvalued than they have ever been. That distinction belongs to the 2000 market peak. While sensitive measures of new orders and economic activity are falling worldwide, and we believe that corporate profit margins have been held at unsustainable levels only as a result of unsustainable government deficits and low savings rates (which are all related through an accounting identity) this is still far from the worst economy in history. That distinction belongs to the Great Depression. We are also not saying that this is the most cyclically overbought market in history. Those distinctions belong to 1929 and the late-1990’s. Emphatically, we are not saying that investors can look at the worst intermediate-term losses in market history, and expect the next one to be worse - individual market fluctuations have a modest predictable component and a large random component, and can only hope to estimate the predictable component. Rather, what we observe here is a preponderance of negative indications that we’ve never observed in such uniform agreement. Essentially, our return/risk projections are based on an ensemble of dozens of individual models, each capturing the factors that best distinguish favorable and unfavorable return/risk outcomes across widely different random samples of data. We’ve found that this approach performs well in generalizing to new, out-of-sample data, while more traditional stand-alone approaches are often less reliable in new or unseen data (which is why our “two-data sets problem” in 2009 was so challenging). No other point in history has generated such a preponderance of negative prospective returns from so many of these individual “learners” – which is an indication that present conditions have been uniformly hostile to market returns in random sample after random sample across a century of widely different market environments, regardless of how one divides up the record. [Geek's Note: Ensemble methods are similar to other useful noise-reduction and signal-extraction methods that use the convergence of signals from multiple “sensors” to reduce the effect of random noise. In our economic analysis, the sensors are individual economic series having varying leading/coincident/lagging relationships; in our work in autism genomics, the sensors are independent samples of genomic data; in ensemble methods, the sensors are individually trained classifiers known as base learners, each which captures a different segment of evidence. A good ensemble is made up of base learners that are all generally good, but err in different parts of the data set, so that the collection of learners suppresses the individual errors, enriches the true unobserved signal, and generalizes well to new data.] Despite the uniformity of negative signals we presently observe, I can’t say with certainty that this particular instance will produce negative market outcomes, or that we won’t find ourselves at odds with a speculative, richly valued, overbought, overbullish but still-advancing market. But even setting aside our particular methods, we have a very mature market advance, at a high Shiller P/E, atop nearly every upper Bollinger band (two standard deviations above the 20-period average at daily, weekly, and monthly resolutions), in an environment of lopsided bullishness. All of this should make bells go off for anyone familiar with market history. Of all the investment adages that are being embraced as reasons to accept market risk, somehow the phrase “buy low, sell high” is conspicuously absent. I expect that this will prove to be a crucial error for investors. In all of the present ebullience about quantitative easing with no ex-ante amount (which I’ll again point out is far different than “unlimited” QE), the market conditions we observe at present have been consistently associated with negative outcomes throughout history. The chart below shows the S&P 500 since 1928, with blue bars identifying points where 1) the Shiller P/E exceeded 18; 2) the S&P 500 was above its upper Bollinger bands on daily, weekly and monthly resolutions; 3) the percentage of advisory bulls exceeded 45%, with bears less than 27% (sentiment data prior to 1960 is imputed based on the strong post-war relationship between sentiment and measures of price momentum), and; 4) the 10-year Treasury yield exceeded its average over the prior 6-month period. This set of criteria is one of many observationally equivalent ways to define an “overvalued, overbought, overbullish, rising-yields” environment. As I have emphasized in numerous recent market comments, different definitions will capture slightly different instances, but with the notable exception of an instance in 1997 during the internet bubble (which was followed by further gains – though the S&P 500 was actually lower by 2009), those instances have invariably been biased toward awful subsequent market outcomes, with stocks usually substantially lower even years later. Note that the graph is on log-scale, so large percentage losses - such as the 1987 crash when the market lost a third of its value - may look deceptively small. That said, the market losses did not always begin immediately, which is important for investors to keep in mind. This is certainly not the only syndrome of evidence that concerns us, but it demonstrates why we are reluctant to accept market risk here.
Meanwhile, it is probably worth marking down September 13, 12:30 PM Eastern, S&P 500 1438 as the point when the Fed finally went all-in, much to our relief – allowing the market to presume unlimited QE, and removing the constant anticipation that the Fed would draw the last arrow from its quiver to kill off every prudent element of our economic system. As Bernanke noted at his press conference, the Fed has been down to two main tools given that interest rates are effectively zero: “balance sheet action, and of course, we can restructure those – change those in various ways. The other type of tool is communication tools. And we could – we continue to work on how to best communicate with the public.” So the Fed has now left itself with nothing but talk. We continue to view QE as being of no real economic benefit, and though it has clearly affected financial markets, QE has typically boosted the stock market by little more than the amount it has lost over the prior 6 month period. That’s another way of saying that I doubt the Fed’s actions will be of much durable effect here at all. As I noted in July, the probable upside benefit to QE3 was likely to be limited to the upper Bollinger band of the S&P 500 on weekly and monthly resolutions. And here we are. The S&P 500 now sits atop its upper Bollinger bands (two standard deviations above its 20-period moving average) at daily, weekly and monthly resolutions. Further progress requires the market to sustain these strenuously overbought conditions. Investment advisors are now bullish by a margin of greater than two-to-one, and the pace of selling by corporate insiders has tripled since July to a rate of six shares sold for every share purchased. We now estimate a prospective 10-year total return for the S&P 500 at less than 4% annually in nominal terms, while the Shiller P/E based on normalized earnings is in the richest 3% of historical readings prior to the late-1990’s market bubble (it is worth remembering that even with the recent advance, the S&P 500 has still achieved total returns less than Treasury bill yields for over 13 years because of that bubble). Last week, we observed a syndrome of evidence that matches only a handful of market extremes in history, including August-December 1972, August 1987, April-July 1998, July 1999, and March 2000, and April-July 2007. Investors with a good sense of market history will recognize all of those instances as points from which subsequent outcomes were steeply negative, even if stocks held up or advanced moderately over the short-run. With regard to the potential for steeply negative outcomes, we find that when we look across history, conditions similar to the present have been “enriched” with steep declines – another way of saying that the negative tail of the distribution is very fat here. For example, if we break our estimates of prospective market return/risk into five quintiles or “buckets”, present estimates are clearly in the most negative bucket. Historically, 31% of instances in that worst bucket have been followed by a market decline of at least 10% over the following 6 month period, while 41% of all 10% market declines (occurring within a 6-month period) have started from instances in that bucket. In other words, while the lowest quintile captures 20% of the historical data, that bucket captures 10% market corrections more than twice as often as one would expect if those 10% declines were randomly distributed across market conditions. Similarly, the periods in the lowest quintile of prospective return/risk capture 45% of all 15% market declines that have occurred within a 6-month window, 54% of all 20% market declines, 69% of all 30% declines, and 87% of all declines of 35% or more (what would commonly be considered “crashes”). In short, saying that our estimates of prospective return/risk are negative does not indicate that the market will or must plunge. Rather, it says that the average outcome has been quite negative, and the likelihood of extreme “tail events” is vastly enriched compared with more typical conditions throughout history. In this environment, market exposure has typically been far more costly than it has been beneficial, and investment opportunities have generally emerged after a period of market losses. Despite the market’s recent derision for stable “core growth” stocks, in favor of materials, cyclicals, financials and speculative growth, I continue to expect a value-conscious stock-selection approach to outperform the major indices over time. That has certainly been our experience from the standpoint of individual stocks. Meanwhile, given an overbought S&P 500 that has breached nearly every short- and long-term upper Bollinger band, coupled with rich valuations on the basis of normalized fundamentals and an extremely negative market return/risk profile by our estimates, I see neither short-term speculative merit nor long-term investment merit in general market exposure here. The foregoing comments represent the general investment analysis and economic views of the Advisor, and are provided solely for the purpose of information, instruction and discourse. Only comments in the Fund Notes section relate specifically to the Hussman Funds and the investment positions of the Funds. Fund Notes As of last week, or estimates of prospective return/risk have moved to the lowest level we have observed in nearly a century of market history. These estimates reflect a blended horizon from 2-weeks to about 18 months, and indicates that market conditions similar to the present have been associated with unfavorable market outcomes in dozens of subsets of historical data. Strategic Growth Fund remains fully hedged, with our put option strikes raised within about 5% of present market levels, at additional put option premium amounting to about 1% of assets looking out to year-end. Strategic International remains fully hedged. Strategic Dividend Value remains hedged at about 50% of the value of its stock holdings. Strategic Total Return continues to carry a duration of about 1.4 years, about 6% of assets in precious metals shares, and a few percent in utility shares and foreign currencies. It has certainly been frustrating to remain defensive in a market that has scaled higher as our measures of market conditions have deteriorated from the most negative 2% of historical instances in early-March, to the most negative 0.5% of instances in recent weeks, to the most negative single instance we can identify. And while our stock selection approach has significantly outperformed the major indices since the inception of Strategic Growth Fund, the enthusiasm over the notion of “unlimited” quantitative easing has favored materials, cyclicals, resource stocks, and speculative growth, which we tend to avoid in large doses. Previous episodes favoring these “risk-on” sectors have been temporary, and I don’t expect that this will be an exception. Last week, we received a very good question – “How much does the market have to decline before you become constructive?” The answer is that good investment opportunities following a period of rich valuations usually emerge in two steps. In the first step, prices decline enough for valuations to move out of an extreme range, and hostile indicator syndromes (e. g. “overvalued, overbought, overbullish”) dissipate. In the second step, our measures of market action improve – which is driven largely by uniformity of market internals (breadth, sector performance, etc.) and can occur very early in an advance, as we saw in 2003. Even in an overvalued market, the presence of favorable market internals and trend-following measures and the absence of hostile indicator syndromes is usually enough to produce a positive expected return/risk profile. The problem since April 2010 (the last time our present ensemble methods would have been materially constructive) is that we’ve seen a constant round of “hot potato” from overvalued, overbought, overbullish conditions to steep declines and unfavorable market action, and then an immediate resumption of overvalued, overbought, overbullish conditions the moment that trend-following measures have sufficiently improved. The declines have left no leeway for valuations to increase without also restoring historically dangerous conditions. While the Shiller P/E (S&P 500 divided by the 10-year average of inflation-adjusted earnings) is over 22.5 here and anything above about 18 is generally problematic from the standpoint of long-term returns, we can tolerate rich valuations provided that favorable market internals and trend-following measures are present, and hostile indicator syndromes are absent. The bulk of historical bull market advances have featured that combination. At present, a market decline of about 20% would raise our estimate of 10-year prospective returns for the S&P 500 to somewhere around 6.5% annually, basedon our standard valuation methodology (see below), which is still below-average but not intolerable. Even a smaller decline would still allow a constructive investment stance. In both cases, we would require our measures of market action to be positive: favorable trend-following measures and market internals, without hostile indicator syndromes. The problem with a shallow decline is that a constructive position would probably not be sustained for long because overbought conditions or other negative factors could emerge fairly quickly – which is what we’ve repeatedly observed since 2010. Undoubtedly, the most favorable outcome would entail a market loss deeply in excess of 20% followed by an improvement in market internals – which is the typical way that a market cycle is completed. That would allow a good deal of latitude for the market to advance without shifting back to an overvalued, overbought, overbullish condition or some other hostile syndrome. We certainly don’t need stocks to become undervalued in order to establish a constructive position, nor do we require valuations to normalize in one fell swoop. A large improvement in valuations would be desirable, but a smaller improvement would be adequate provided that we can clear the abysmal set of conditions that we presently observe.--- The foregoing comments represent the general investment analysis and economic views of the Advisor, and are provided solely for the purpose of information, instruction and discourse. Prospectuses for the Hussman Strategic Growth Fund, the Hussman Strategic Total Return Fund, the Hussman Strategic International Fund, and the Hussman Strategic Dividend Value Fund, as well as Fund reports and other information, are available by clicking "The Funds" menu button from any page of this website. |
|||||||||||||||||||||||||
|
For more information about investing in the Hussman Funds, please call us at
1-800-HUSSMAN (1-800-487-7626) 513-326-3551 outside the United States Site and site contents © copyright Hussman Funds. Brief quotations including attribution and a direct link to this site (www.hussmanfunds.com) are authorized. All other rights reserved and actively enforced. Extensive or unattributed reproduction of text or research findings are violations of copyright law. Site design by 1WebsiteDesigners. |