|
|
||||||
|
|

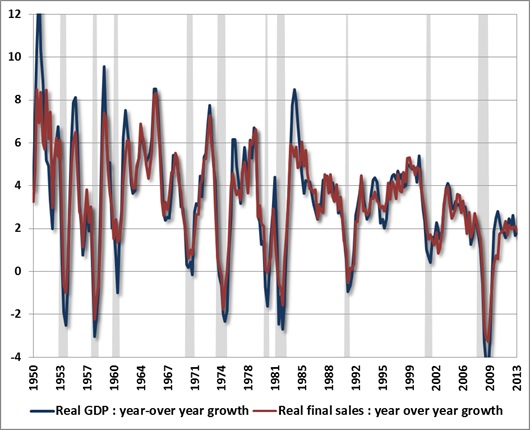
April 29, 2013 When Rich Valuations Meet Poor Economic Data The advance estimate for first quarter GDP came in decidedly below expectations at a 2.5% annual rate, but even that rate belies the fact that real final sales slowed to just 1.5% growth, from 1.8% last quarter. The remaining 1% of the first-quarter growth figure – 40% of the total – represented the accumulation of unsold inventory. My view remains that the U.S. is unlikely to avoid joining the rest of the developed world in a global recession that is already underway, and may well be already underway in the U.S. once data revisions are reflected. The year-over-year growth rates of real GDP and real final sales have declined to just 1.80% and 1.87% respectively, which is the first time in this economic cycle that both have simultaneously declined from above 2.0% to below 1.9% - an occurrence that has been a hallmark of every post-war recession, with remarkably few false signals for such a simple measure. The Fed’s ability to kick-the-can in increments of a few months at a time may allow this time to be different, but investors should recognize that they are relying on that proposition. It is certainly not the case that economic recessions precisely overlap with bear markets. Rather, bear markets are frequently underway before recessions are evident, and typically end several months before the recessions do. For that reason, market returns aren’t reliably abysmal when measured from the very start of a recession to its very end. Even so, note the shaded recessions in the chart below. Bear markets in equities occurred in 1956, 1961, 1970, 1973-74, 1981-82, 1990, 2000-02, and 2007-09. Of course, there are many less severe but still damaging market declines that occurred in the absence of recession.
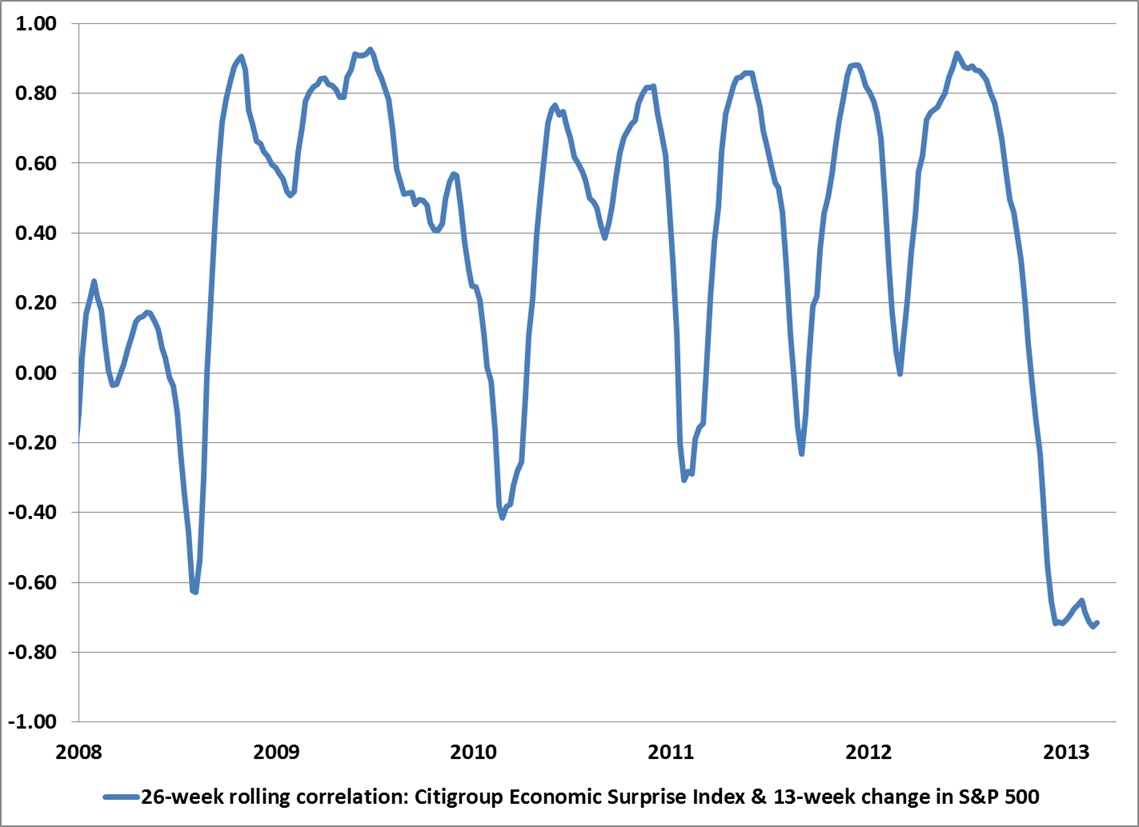
Meanwhile, early evidence shows a very uniform deterioration in regional surveys of economic activity, with the Philadelphia Fed, Richmond Fed, and Empire Manufacturing surveys experiencing unanimous declines in overall activity, new orders and order backlogs in the April reports. The coming week will bring data from the Dallas Fed, Chicago and national surveys from the Institute of Supply Management, a Fed statement on Wednesday, and an employment report on Friday. Even deep-seated fundamentals have not always resolved into immediate outcomes in recent years, so I have no particular confidence about the direction of these reports. It’s just that nothing in the data is suggestive of a durable shift toward stronger economic activity. A great deal of investor confidence resides with the Federal Reserve and other central banks here, and while it's clear that monetary interventions can do a great deal to suppress spikes in risk premiums after they've occurred, the evidence for a durable transmission to the real economy remains wanting. As a side note, while the Federal Reserve Act doesn’t allow it, there are certainly some smaller central banks that have the ability to buy equities (essentially an indirect method of nationalization). This idea got a lot of attention last week. It's certainly possible that an acceleration in that activity might support various international markets in the short-term, but would also create unbacked currency in an amount proportional to any losses in those equities. The hopeful arguments encouraging this sort of activity rely on the poorly constructed measures of risk-premiums that I reviewed in Investment, Speculation, Valuation, and Tinker Bell. These arguments are unlikely to survive a recession, much less a bear market. It seems a bit late in a mature bull market to rely on these hopes to sustain continued speculation, but we'll take our evidence as it comes. Given the full set of market conditions that we observe, including the persistent overvalued, overbought, overbullish syndrome that has developed in recent months, our concerns about stocks are not dependent on the direction of the economy over the coming quarters. An economic downturn would simply add immediacy to those concerns. Still, it’s important to recognize that our market posture is not driven by our concerns about recession risk, and that near-term economic bounces don’t retract our concerns. That said, we can’t completely partition economic outcomes from market outcomes. On that subject, Bill Hester sent some interesting observations over the weekend that should not be overlooked here: Bill notes “Investors are virtually ignoring how economic data are coming in relative to expectations. Although we maintain an economic data surprise line internally – comparing how economic data is coming in relative to economist forecasts – here I’ve use the Citigroup US Economic Surprise Index. The chart below shows the 26-week rolling correlation of the Economic Surprise Index and changes in the S&P 500. A declining line represents periods where economic data and the S&P are becoming less correlated, or even moving inversely to each other. The most recent correlation below -0.7 indicates that stocks and negative economic data are moving in almost perfectly opposite directions.”
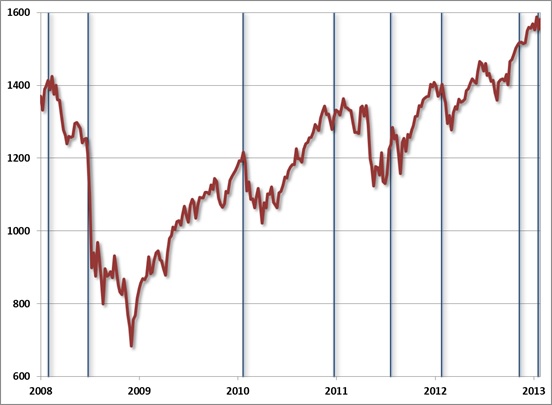
Undoubtedly, the strong inverse relationship between stocks and economic data lately reflects the belief that “bad news is good news” – that worse economic data bring the next fix of monetary easing closer. This hope has certainly been nurtured by the Federal Reserve. The problem with this idea is that, as we’ve demonstrated previously, the primary effect of quantitative easing on the financial markets is to reduce risk premiums after they have spiked. Put another way, the main effect of QE, both in the U.S. and internationally, has been to help stocks recover the loss that they experienced over the prior 6-month period, with little durable effect on economic growth aside from releasing a few months of can-kicking pent-up demand (see the analysis in Capitulation Everywhere). Bill goes further to observe that “the troughs in correlation, in hindsight, turn out to be important.” We can formalize this by identifying each point where the correlation registered a new low below zero, and was also followed by an upturn within two weeks. Those correlation troughs are indicated by the blue lines in the S&P 500 chart below. In most of these cases (as in the present instance), the Economic Surprise Index was at least a few percent below its 13-week high, and the S&P was at least a few percent above its 13-week low (the exception is the September 2008 instance when the market was already at a 13-week low even before it collapsed). A more complete indicator would impose additional requirements to rule out periods of undervaluation, or points where the correlation might be negative because stocks were down and surprises were up. In any event, this is not a chart that inspires optimism, as the correlation troughs correspond to the beginning of nearly every significant market correction we’ve observed in the recent market cycle.
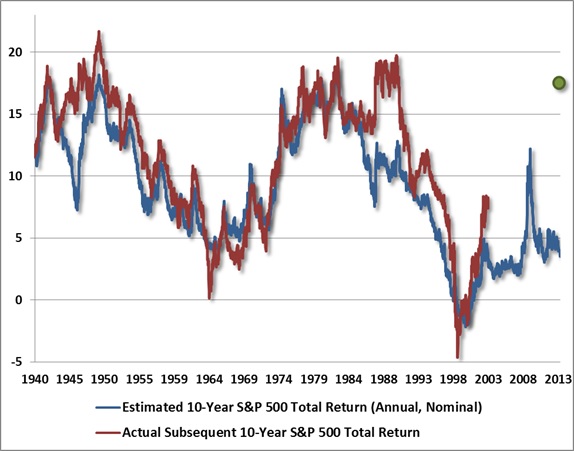
The dates and S&P 500 values corresponding to the blue lines are: May 02, 2008 (S&P 1414), Sep 26, 2008 (S&P 1213), Apr 23, 2010 (S&P 1217), Mar 25, 2011 (S&P 1314), Oct 21, 2011 (S&P 1238), Apr 27, 2012 (S&P 1403), Feb 08, 2013 (S&P 1518), and Apr 19, 2013 (S&P 1555). What we know for certain is that during the most recent market cycle, the repeated hope that stocks could detach from the economic data proved to be unfounded in nearly every instance, with the exception (thus far) of the extreme and extended negative correlation observed in recent months. As is already true of other financial and economic conditions today, investors are left to rely on the hope that this time is different. On the Very Long View Albert Edwards at SocGen is not optimistic. Last week, he reiterated his concern that the S&P 500 would ultimately establish a low at 450. There is not a missing “1” in front of that figure. At first glance, 450 on the S&P seems absolutely preposterous, as Wall Street will be quick to point out that operating earnings are estimated to be over $110 this year, and a level of 450 would imply a P/E ratio of less than 4.5. But interestingly, if one corrects for the fact that profit margins are more than 70% above their historical norms, and that any recession in the coming years would be likely to draw "forward earnings" estimates to the $70-80 range, Albert’s estimate works out to a forward P/E of about 6 – which again seems low, until you impute forward earnings historically, and realize that the pre-bubble norm for the forward P/E has typically been less than 11, while secular lows have occurred at what would have indeed been forward P/E ratios right about 6 (see the August 2007 comment - Long Term Evidence on the Fed Model and Forward Operating P/E Ratios). When we take Albert’s target to our own valuation approach, a move to 450 on the S&P 500 would drive our own estimates of 10-year prospective S&P 500 returns to about 18% annually, which is certainly higher than we observed in 2009, but is disturbingly right in line with the valuations that have typically been established with durable secular lows.
For our part, nothing in our own approach requires more than a moderate retreat in valuations to warrant a constructive investment position (provided that our measures of market action are favorable and overvalued, overbought, overbullish syndromes are absent). Over the complete market cycle, I believe that the best investment approach is to accept market risk in proportion to the estimated return/risk profile that is associated with any prevailing set of market conditions – and those conditions include not only valuations, but market action, trend-following measures, sentiment, yes – monetary conditions, and other factors. For us, the key is the average return/risk profile that emerges from the full weight of these conditions, based on a broad ensemble of models that consider them across numerous subsets of historical data (and that have been validated in out-of-sample data). The challenge is that this strategy requires a full-cycle investment horizon, and it can be very frustrating in late-stage, overvalued bull markets when prices are still advancing despite negative average return/risk outcomes historically. Much of our research in recent years has focused on narrowing the set of conditions in which we take defensive positions, so that the corresponding periods capture the worst average outcomes and leave us free to take a constructive stance in the others. I expect the result of all that to be very clear as we move through the coming cycle, though it doesn’t alter our defensiveness in the present moment. In short, I expect numerous opportunities to emerge in the form of both intermediate-term advances and possibly one or more complete cyclical bull markets before valuations normalize to any extent approaching the secular lows of 1950 or 1982. We certainly don’t require an implosion of the stock market or a collapse in valuations in order to shift to a much more constructive stance. Keep in mind that valuations were still no picnic in 2003 when our views shifted to being quite constructive. The need to stress-test against Depression-era data prevented a similar turn in 2009 even though our methods indicated good valuations at the time. In the Depression-era, similarly “good” valuations were followed by a further market loss of two-thirds, which is easy to forget with the benefit of hindsight. With that stress-testing challenge addressed, I continue to believe that the main risk here is not the risk of missing further upside, but the risk of forgetting that financial markets experience inexorable cycles over time – today being about the point that an unfinished half-cycle is in place. I have no doubt that there will be numerous opportunities where the data fully support a constructive investment stance. Such opportunities are not at all dependent on terrible market losses or deep undervaluation. Previous secular lows have been associated with great economic dislocations, such as world war, rapid inflation and so forth. There are certainly potential economic dislocations inherent in a highly leveraged global banking system that does not value its assets at realizable market value, nor holds capital that is appropriately risk-weighted. That’s particularly true of the European banking system. I do view European bank weakness and U.S. recession as being the two most destabilizing potential risks in the present cycle, but it’s not obvious that either would be sufficient to provoke a secular low in this particular go-around. All of this argues for a focus on aligning our investment stance with prevailing realities – being mindful of potential long-term outcomes, but not letting them overly impact our positions. Here and now, market conditions are clearly sufficient to encourage a defensive stance, but that is likely to change far sooner than any of our deep-seated long-term concerns come to roost (such as accelerating inflation in the back-half of this decade). I would expect at least one more cyclical bull market between now and then. As I’ve noted before, the most appropriate point to establish a positive investment stance is when a retreat in valuations is joined with an early improvement in market action. That said, an unsettling reality remains – the next secular bull market period appears unlikely to emerge until Albert is reasonably correct. The foregoing comments represent the general investment analysis and economic views of the Advisor, and are provided solely for the purpose of information, instruction and discourse. Only comments in the Fund Notes section relate specifically to the Hussman Funds and the investment positions of the Funds. Fund Notes As of last week, we continue to estimate a negative prospective return/risk profile on stocks on a blended horizon of 2-weeks to about 18-months. This is most likely to change at the point where at least a moderate retreat in valuations is joined by an early improvement in our measures of market action. We do not require a retreat in valuations even to historical norms, much less undervalued levels, as a precondition for accepting market risk. Here and now, I strongly view stocks as being at or near the peak of an unfinished half-cycle, the full cycle being the combination of a bull market and the bear market that resolves it. The average historical bear market has wiped out more than half of the preceding bull market advance. The proportion of surrendered gains is larger for cyclical bear markets that occur in so-called “secular” bear market periods (periods that gradually take valuations from very rich initial levels to extremely depressed levels over the sequence of several cyclical bull-bear periods, each that achieves successively lower trough valuations). At the end of secular bear markets (for example, 1950 and 1982), or estimates of 10-year prospective nominal total returns for the S&P 500 typically exceeded 18% annually. At present, our estimates are below 3.5% annually. I strongly believe that higher prospective returns will emerge over the completion of the present market cycle. We’ve done a great deal of work to restrict the frequency of our most defensive positions to about 5% of history that is associated with profoundly negative average returns. We’ve also tested and implemented further criteria to concentrate hedging to periods reflecting not only negative expected return/risk estimates, but also the absence of favorable trend-following measures, or the presence of either overvalued, overbought, overbullish conditions or deteriorating momentum across a variety of measures. We’re certainly not insensitive to trend-following or monetary considerations – it’s simply that these considerations carry far less weight under certain conditions than investors seem to believe. That said, none of these subtleties would have been sufficient to shift our generally defensive stance to a generally constructive one, particularly since about March 2012. Over the complete bull-bear market cycle, the core of our approach is to align our investment stance with the return/risk profile that we estimate at each point in time based on prevailing market conditions. Subtleties involving the additional criteria that I’ve mentioned aren’t central to that long-term full-cycle strategy, but they do seem to be central to avoiding the shorter-term discomfort and second-guessing that we’ve repeatedly encountered during overvalued, late-stage bull markets – when the idea that “this time is different” obtains new life. My hope is that we’ll experience less of that in future cycles, and in the remainder of this one should it turn out that there are more bunnies in the hat (which I doubt). Strategic Growth Fund remains fully hedged, with a “staggered strike” position (our most defensive stance) that raises the index put option side of our hedges somewhat closer to market levels, at a cost representing about 1% of Fund value. Strategic International remains fully hedged. Strategic Dividend Value is hedged at about 50% of the value of its stock holdings. Strategic Total Return continues to carry a duration of about 3 years (meaning that a 100 basis point move in interest rates would be expected to impact the Fund by about 3% on the basis of bond price fluctuations), with about 20% of assets in precious metals shares.--- The foregoing comments represent the general investment analysis and economic views of the Advisor, and are provided solely for the purpose of information, instruction and discourse. Prospectuses for the Hussman Strategic Growth Fund, the Hussman Strategic Total Return Fund, the Hussman Strategic International Fund, and the Hussman Strategic Dividend Value Fund, as well as Fund reports and other information, are available by clicking "The Funds" menu button from any page of this website. |
|||||||||||||||||||||||||
|
For more information about investing in the Hussman Funds, please call us at
1-800-HUSSMAN (1-800-487-7626) 513-326-3551 outside the United States Site and site contents © copyright Hussman Funds. Brief quotations including attribution and a direct link to this site (www.hussmanfunds.com) are authorized. All other rights reserved and actively enforced. Extensive or unattributed reproduction of text or research findings are violations of copyright law. Site design by 1WebsiteDesigners. |