|
|
||||||
|
|

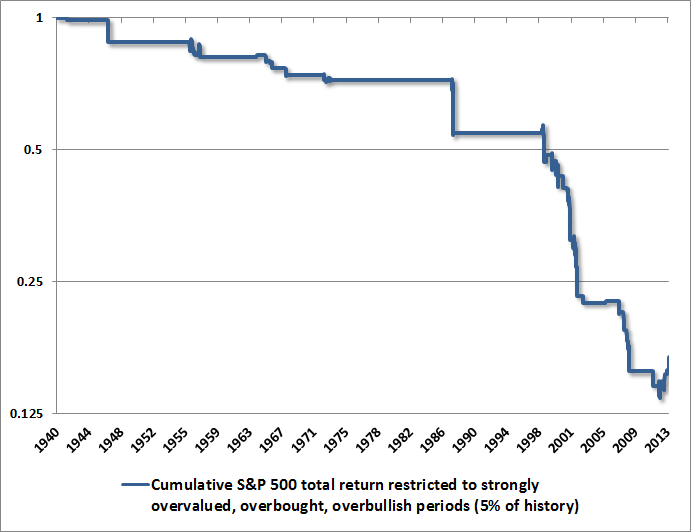
July 22, 2013 The Road to Easy Street In the fall of 1977, I started calculus class, taught by Father Arnold Perham. As a junior in high school, being 14 years old was socially awkward enough, but in hindsight, it might have helped to take up a sport instead of joining the math team. [Geek’s Note – being on the math team does not make you a chick magnet. I know... Who knew? Right?] I always looked forward to Arnie’s class (as we warmly referred to him). Enthusiastic and encouraging, he quickly became my favorite teacher. I was fortunate to student-teach with him years later when I got my MS in Education and Social Policy, so he also taught me how to teach. Arnie had this stuffed buzzard, and if you got a question wrong, he would plop it on your desk – “YOU get the buzzard. He will not be removed until you redeem yourself.” Of all of the remarks that he would toss out while teaching, the one I remember most often is what he would say when my eyes went blank with the difficulty of some new topic. He would shrug his shoulders and say in a matter-of-fact voice, “Look, kid, I never said this was easy. The road to easy street runs through the sewer.” In nearly every effort worth pursuing, I think the secret to eventual success is the same. Find a set of well-informed daily actions that you’re convinced will produce good results if you follow them consistently. Then follow them consistently. In a world where randomness, frustrations, and events outside of one’s control play an enormous role in day-to-day outcomes, the best measure of day-to-day success is whether or not those daily actions were followed. Over time, the results take care of themselves. But Arnie was right. There’s not a single road to easy street that doesn’t run through the sewer at one point or another. There are actually numerous investment disciplines that I believe are effective over the long-term, including a buy-and-hold approach. The problem, in my view, is that investors constantly switch their discipline when it isn’t performing well at the time. Since 2000, a buy-and-hold approach would have required an investor to suffer through one 50% market loss and a second, distinct 55% market loss. Frankly, I think another one of a similar order will complete the present market cycle. Over the very long-term, buy-and-hold investors have done fine, particularly combined with good value-conscious stock selection. But the drawdowns can be intolerably deep from our perspective, and the full-cycle returns following points of rich valuation tend to be particularly disappointing compensation. I expect that this will be true over the coming decade as well. Buy-and-hold has been wonderful if one’s attention is carefully restricted to the advancing half of the present, extraordinary, and unfinished cycle (or what is almost the same, the cycle-and-unfinished-half-cycle over the decade since 2003). Just as day follows night, buy-and-hold strategies reach the peak of their popularity at market tops, because those are the points where every effort in recent memory to sell or reduce risk has apparently failed. Conversely, buy-and-hold strategies are most reviled at bear market troughs, when the full weight of losses is felt. I have no argument at all with investors whose strategy adheres to a disciplined buy-and-hold, diversified across asset classes, over the full course of the market cycle. In contrast, I have great concern about investors who discover buy-and-hold at the top, and adhere to it only long enough to abandon it at the bottom. The most important part of a buy-and-hold discipline is the commitment to remain passive even as it experiences massive interim losses. Look, kid, I never said this was easy. The road to easy street runs through the sewer. Our own discipline pursues stronger returns and smaller drawdowns than a buy-and-hold approach, but with an emphatic focus on the complete market cycle. “Bear markets” associated with a risk-managed approach don’t necessarily overlap bear markets in the major indices, and the combination of stress-testing in 2009-2010 and QE distortions have certainly made this particular cycle a challenge for us. So I’ve got the buzzard on my desk. Still, the most important part of our own discipline is the same as for every other studied investment discipline – the diligence to follow it even at points where it is frustrating to do so. The road to easy street still runs through the sewer, unfortunately. I just think our sewers are shallower, and that the road leads to a nicer place over the full trip. Unlike a buy-and-hold strategy, our discipline does not require us to remain passive in the face of new information. Regardless of whether we’re experiencing success and frustration, we’re constantly looking for ways to improve performance and limit risk, provided that the new research can also be validated across numerous cycles throughout market history. We don’t alter our discipline just because it’s frustrating to follow at the moment, and we don’t introduce changes that might make us more comfortable at present if that same change would have ravaged returns or increased losses unacceptably in prior cycles. The easiest way to lose discipline is to measure each day by whether it was up or down. At the end of the day, the only controllable measure of success is the extent to which you’ve taken a studied, well-defined set of actions that you are convinced will produce good results if you follow them consistently. For us, that habit remains as strong as it was in the face of similarly frustrating, mature, overvalued, overbought, overbullish conditions in 2000 and 2007. The Quandary Presently, we observe a syndrome of strenuously overvalued, overbought, overbullish conditions that have marked the most notable market peaks (and deepest subsequent market losses) in history, including 1929, 1972, 1987, 2000, and 2007. With the exception of a particularly extreme version of this syndrome that will be recapitulated next week as long as advisory bullishness remains at its present level, every important variant of this syndrome already collects the present instance into a small subset of history that we call a “Who’s Who” of awful times to invest (see the July 16, 2007 weekly comment A Who’s Who of Awful Times to Invest for a review of similar concerns approaching the 2007 peak, and Puppet Show and A Reluctant Bear’s Guide to the Universe for other discussion). All of this presents us with a quandary. We can take a defensive outlook based on long-term historical evidence consistently linking overvalued, overbought, overbullish conditions to dismal subsequent market outcomes over the completion of each previous market cycle. Or we can throw history to the wind because these same overvalued, overbought, overbullish conditions have been followed by oddly positive market returns during the advancing portion of the present cycle, particularly since September 2011. Actually, there’s not a moment of hesitation about which choice we’ll make, but it adds a little suspense to call it a quandary. Let’s put some data on this. Even with the additional exclusions that we’ve introduced in recent years, since 1940, overvalued, overbought, overbullish conditions sufficient to warrant our strongest defensive outlook have emerged about 5% of the time. I’ve often noted that these hostile conditions have historically been associated with average market losses on the order of 40-50% on an annualized basis. If we examine the performance of the S&P 500 restricted to the periods when these strong overvalued, overbought, overbullish conditions were in place, these periods capture a cumulative 85% loss in the index, including dividends. I’ve plotted this on log-scale to show the consistency of these negative outcomes. You’ll also notice the little “quandary” on the very right side of the chart.
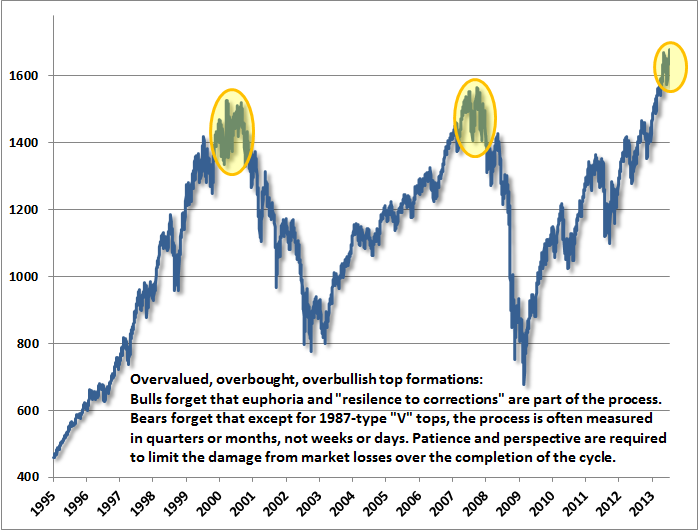
To put the impact of the cumulative loss during these periods into perspective, consider the effect of avoiding this loss. Since 1940, holding Treasury bills during this 5% of history and remaining invested in the S&P 500 the other 95% of the time would have resulted in a cumulative total return close to 7 times greater than a passive buy-and-hold strategy. Notably, while avoiding these periods would have been of dramatic long-term benefit, they aren’t nearly frequent enough to exclude the bulk of most bear market losses, so one still would have suffered a 30% drawdown in the 1970 bear market, and 40% drawdowns in the 1973-74 and 2008-2009 bear markets. Attention to a combination of valuations and market internals would have effectively navigated much of those bear markets, but the chart above may help to understand why strenuously overvalued, overbought, overbullish syndromes have historically outweighed all other considerations, including trend-following and monetary factors. Notice the little recovery on the right side of the chart. It may seem insignificant from a long-term perspective, but it still represents a 24% advance from the low. In other words, in recent years, the S&P 500 has advanced by 24% even in periods when the most historically violent market conditions we identify have been in place. Since late-2011, the market has also largely ignored more general conditions that have a consistent full-cycle record of identifying awful return/risk tradeoffs historically. One aspect of our investment discipline is constant research, and there are certainly some findings that we’ve validated historically and implemented (partly in response to quantitative easing), which could have made an easier go of the most recent cycle. Even so, my perspective is that the euphoric and overextended advance in stocks during the present, unfinished half-cycle – despite some of the most reliably hostile conditions we identify – simply increases the depth of the likely market losses over the completion of this cycle. Our investment strategy is to align our stance in proportion to the expected return/risk profile that we estimate on the basis of prevailing conditions. Over the full course of the market cycle, we expect that individual instances that are better or worse than those estimates will tend to offset, on average. This is what we’ve observed historically, and I don’t expect the present cycle to be much different in that regard. As usual, I have no intention of encouraging investors to deviate from other disciplines, provided that those disciplines are well-informed, that investors are committed to following those disciplines over the full course of the market cycle, and that they are well-aware of the typical return and drawdown characteristics of their chosen approach. Jack Bogle of Vanguard is a good example of the right mindset on this – he encourages a buy-and-hold approach, but he also understands the actual return/risk profile - he openly recognizes and is prepared for the likelihood that the coming decade will include a number of interim market losses in the range of 30-50%. We may differ on expected return estimates for the coming decade (see Investment, Speculation, Valuation, and Tinker Bell for a discussion of various historically reliable approaches, and some popular but unreliable ones), but then, a buy-and-hold approach isn't particularly sensitive to valuation anyway. Measured from the bottom in 2009, buy-and-hold has outperformed virtually every other approach, including trend-following and risk-managed approaches. The relative performance of a buy-and-hold strategy is likely to be wildly different during the bear market portion of the present cycle, but again, my chief concern for would-be buy-and-hold investors is that they don’t suddenly discover the strategy today and then abandon it only after severe market losses. When comparing the maximum losses of various investment disciplines, keep the effect of compounding in mind. For example, the market cycle since 2007 has included a 55% interim market loss for the S&P 500. The difference between, say, a 25% loss and a 55% loss is that one has to lose an additional 40% of one’s portfolio. I doubt that 2000-2002 and 2007-2009 were the last bear markets of that ilk that investors will encounter. Similarly, when evaluating the returns of various investment disciplines, keep in mind that while the average bull market gain has been something on the order of 162%, the completion of the market cycle has typically erased more than half of those gains, resulting in an average full-cycle gain of about 79% (see The Price of Distortion). A much larger portion of bull market gains is typically erased by cyclical bear markets that occur in the context of a secular bear market period. Recent paper gains may seem thrilling, but I doubt that they will be meaningfully retained by investors over the full course of this cycle. The signals that would have moved risk-conscious investors out have been in place for some time. Aside from reminding buy-and-hold investors to allow for the potential for very deep interim losses, the other concern that I would add is that our present estimate of 10-year prospective S&P 500 total returns is now less than 2.9% annually (nominal), and those estimates have been quite accurate historically. Notably, those estimates exceeded 10% annually at the 2009 low, when stress-testing concerns relating to Depression-era outcomes prevented us from responding in the same constructive manner as we did at the beginning of the bull market in early 2003. The prospects for reasonable 10-year returns are now long gone. I don’t think the benefit of a buy-and-hold strategy will be commensurate with the risk from present, overbought levels. Fortunately, though, prospective returns will also change as valuations do. It’s clear that investors have achieved their current paper gains by ignoring these concerns. But I emphasize the word “paper” here, because it is doubtful that investors in aggregate (or even a material fraction of them) will realize or retain these gains. As the Wall Street Journal asked rhetorically in August 2000, after dot-com stocks were already decimated and a 50% general market decline still lay ahead, I expect that investors will ultimately look back at the present QE-induced euphoria and ask the same question: “What were we THINKING?” Equilibrium, Air Pockets, and Top Formations A reminder – in equilibrium, money doesn’t move “into” or “out of” stocks. Rather, every buyer is matched with a seller, which is why the trading floor is called a stock “exchange.” Every investor wishing to exit stocks has to find some other investor willing to commit funds at these levels, and every investor wishing to accumulate stocks has to find some other investor willing to sell their holdings. Trading volume on recent advances has been very tepid, suggesting that recent gains have been driven by short-covering demand being satisfied by a handful of reluctant sellers. As William Peter Hamilton noted a century ago, a market that becomes “dull on rallies and active on declines” is not to be easily trusted. Given overbought conditions across the major indices, lopsided overbought conditions on a stock-by-stock basis, overbullish sentiment, and tepid trading volume, if a material number of existing holders attempt to liquidate, it’s not at all clear that they will find willing demand anywhere close to current levels. This absence of robust demand at a point where individual stocks are uniformly overbought is what creates “air pockets” where broad indices can decline vertically. Even signals that might eventually move trend-following investors to exit are likely to emerge at much lower levels, when I suspect those trend-followers will be reluctant to act on their own discipline because prices will have declined so much already. Meanwhile, it’s important to distinguish between the severity of conditions and the immediacy of outcomes. A notable feature of many bull market peaks (outside of “V-type” peaks like 1987) is an extended period of churning over several months or even quarters. For example, the 2000 and 2007 peaks were followed by two of the worst market declines on record, yet the apparent resilience of the market following interim corrections around those tops produced a sense of security and complacency despite what would prove to be profound downside risks. In short, the fact that we observe severe conditions at present doesn’t necessarily imply an immediacy of negative outcomes. The interim sense of security may be illusory, but it certainly contributes to frustration and impatience if investors don’t recognize this pattern.
As for our own discipline, we’ll continue to act in proportion to the return/risk profiles we estimate on the basis of prevailing conditions. Those conditions will change over time. It’s certainly frustrating that syndromes of conditions that typically move us to alarm about market risk (as they also did in 2000 and 2007) have been followed by yet further market advances more recently. One can roll the dice if one believes that quantitative easing has ushered in a new world in which none of the most severe historical warnings are worth their weight in red cloth, or that the impact of QE is not exhaustively reflected in market prices, or that the present market cycle will provide further gains that can be captured with some other signal that will provide an exit in advance of millions of other investors seeking a similar exit. For our part, we’ll continue to adhere to our investment discipline over the full course of the market cycle. I strongly encourage other investors to do the same, provided that those disciplines are well informed, tested over numerous market cycles across history, and have an acceptable tradeoff between prospective return and risk. The foregoing comments represent the general investment analysis and economic views of the Advisor, and are provided solely for the purpose of information, instruction and discourse. Only comments in the Fund Notes section relate specifically to the Hussman Funds and the investment positions of the Funds. Fund Notes As of last week, market conditions remained characterized by the most hostile syndromes of overvalued, overbought, overbullish conditions that we identify. While similar conditions have emerged in about 5% of historical data, including the market peaks of 1929, 1972, 1987, 2000 and 2007, the periodic emergence of these conditions since late-2011 has resulted in no material correction or negative follow-through for the market. The two available conclusions, in my view, are either that these conditions are no longer relevant despite their consistently hostile outcomes in prior market cycles throughout history, or that the present advance represents a still-uncorrected extreme from which awful returns are likely to follow over the completion of the present market cycle. It seems needless to say that the second interpretation is most consistent with the long-term historical record. It is also the one that I expect will prove to be true. Strategic Growth remains fully hedged, with a staggered strike hedge that raises the strike price of the index put option side of the hedge modestly below present market levels. Strategic International remains fully hedged. Strategic Dividend Value is hedged at about 50% of the value of its stock holdings. Strategic Total Return continues to carry a duration of about 5.8 years (meaning that a 100 basis point change in interest rates would be expected to impact the Fund by about 5.8% on the basis of bond price fluctuations), with about 8% of assets in precious metals shares and about 4% of assets in utility shares --- The foregoing comments represent the general investment analysis and economic views of the Advisor, and are provided solely for the purpose of information, instruction and discourse. Prospectuses for the Hussman Strategic Growth Fund, the Hussman Strategic Total Return Fund, the Hussman Strategic International Fund, and the Hussman Strategic Dividend Value Fund, as well as Fund reports and other information, are available by clicking "The Funds" menu button from any page of this website. |
|||||||||||||||||||||||||
|
For more information about investing in the Hussman Funds, please call us at
1-800-HUSSMAN (1-800-487-7626) 513-326-3551 outside the United States Site and site contents © copyright Hussman Funds. Brief quotations including attribution and a direct link to this site (www.hussmanfunds.com) are authorized. All other rights reserved and actively enforced. Extensive or unattributed reproduction of text or research findings are violations of copyright law. Site design by 1WebsiteDesigners. |