|
|
||||||
|
|

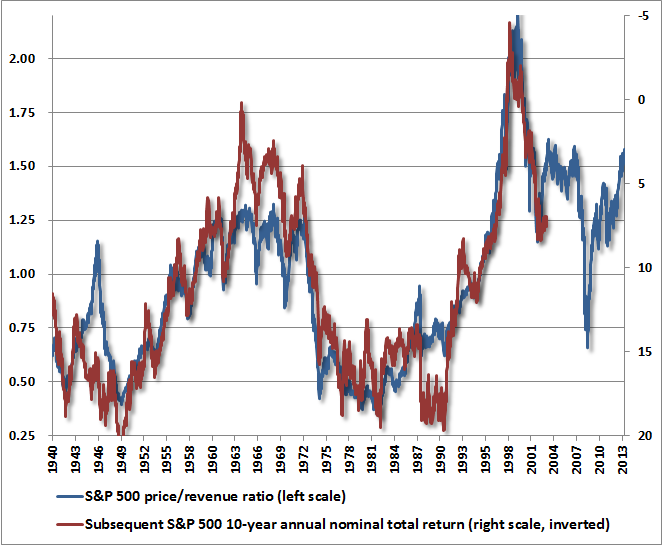
October 21, 2013 Did Monetary Policy Cause the Recovery? As investors, we should be aware that the current Shiller P/E of 24.8 (S&P 500 divided by the 10-year average of inflation adjusted earnings) is now above every historical instance prior to the bubble period since the late-1990's, save for the final weeks approaching the 1929 peak. We should also be aware that overvaluation alone in the late-1990’s did not stop the market from reaching even higher levels as new-era speculation culminated in the 2000 bubble peak. It’s fine, and quite accurate to say that valuations are not as frenzied as they were at the 2000 extreme (a comparison that fell from the lips of Robert Shiller himself last week), provided that one also recognizes that the hypervaluation in 2000 has been followed by a period that included two separate market losses in excess of 50%, and a nominal total return from 2000 until today averaging just 3.2% annually. Even that weak 13-year return has been achieved only thanks to distortions that have again driven present valuations to temporary and historically untenable extremes. Put simply, the past 13 years have chronicled the journey of valuations - from hypervaluation to levels that still exceed every pre-bubble precedent other than a few weeks in 1929. If by 2023, stock valuations complete this journey not by moving to undervaluation, but simply by touching pre-bubble norms, we estimate that the S&P 500 will have achieved a nominal total return of only about 2.6% annually between now and then. What usually distinguishes an overvalued market that continues to advance from an overvalued market that drops like a rock is the quality of market internals and related measures that capture the preference of investors to seek risk. On that front, our views on near-term return/risk prospects are very mixed at present. On one hand, our primary measures of market internals remain unfavorable but approaching borderline, while price action appears overbought on nearly every measure. On the other hand, bullish sentiment has eased back modestly, and investors continue to celebrate the likelihood that the Fed will defer any tapering decision this month. More on short-term considerations below. Examining various historically useful fundamentals, the S&P 500 price/revenue ratio of 1.6 is now twice its pre-bubble historical norm of about 0.8. For perspective, it’s worth noting that the 1987 peak occurred at a price/revenue ratio of less than 1.0 and neither the 1965 secular valuation peak, nor the 1972 peak (before stocks dropped in half) breached even 1.3. Also, take care to note that the price/revenue multiple is twice the historical median – not twice the level where bear markets have typically ended. No, the price/revenue ratio is closer to three times that level. Broadening our view to a larger set of historically reliable measures that are actually well-correlated with subsequent market returns, we arrive at identical conclusions. For example, the market value of non-financial stocks to GDP (based on Z.1 flow-of-funds data from the Federal Reserve) presently works out to about 1.24. This is twice the pre-bubble norm, well above the 2007 peak, and already at late-1999 levels. On a diverse set of reliable fundamentals, we now estimate a 10-year nominal total return for the S&P 500 of just 2.6% annually. Put another way, stocks are likely to achieve zero risk premium over 10-year Treasuries in the coming decade, despite having about five times the duration, volatility and drawdown risks. The entirety of that total return can be expected to arrive in the form of dividends, leaving the S&P 500 below its current level a decade from now. This would be a less depressing conclusion if I didn’t correctly say the same thing in 2000, and if even simple versions these valuation methods didn’t have a nearly 90% correlation with subsequent 10-year returns (see Investment, Speculation, Valuation, and Tinker Bell). The failure of investors to learn from experience isn’t just an inconvenience – the constant misallocation of capital resulting from these speculative episodes is gradually destroying our nation’s economic potential for long-term growth and job creation. We measure our standard of living by the amount of output that an individual is able to command for a given amount of work. We measure our productivity by the amount that an individual is able to produce for a given amount of work. Over time, these two must go hand in hand. Policies that misallocate savings away from productive investment and toward unproductive speculation are the same policies that do long-term violence to our nation’s standard of living. Although the members of the Federal Reserve undoubtedly mean well, their actions are at the center of the assault. Did Monetary Policy Cause the Recovery? We can quite reliably estimate the long-term returns that stocks are likely to deliver over a 7-10 year horizon. Still, valuations often have less direct effect over shorter portions of the market cycle. The present situation is complicated by the fact that while valuations are extreme from a historical standpoint, investors are tied to a narrative that assumes a cause-and-effect link between monetary policy and market direction. The “follow the Fed” narrative certainly did not prevent the market from losing half of its value during the 2000-2002 and 2007-2009 plunges, despite aggressive monetary easing in both instances, but what matters in the short-run is not the truth of that narrative, but the perception that it is true. Since about 2010, normal economic relationships have taken a back seat to ever larger monetary policy interventions. The correlation between reliable leading measures of economic activity and subsequent job growth and GDP has dropped not just to zero but to negative levels (see When Economic Data is Worse Than Useless). Similarly, extreme overvalued, overbought, overbullish syndromes, which throughout history have been closely followed by severe losses, have instead been followed by further speculative gains. The question is whether this reflects a permanent change in economic dynamics, or a temporary overconfidence about the effectiveness of monetary policy. To address this question, a proper understanding of the credit crisis is essential. Much of the present faith in monetary policy derives from the belief that it was the central factor in ending the banking crisis during what is often called the Great Recession. On careful analysis, however, the clearest and most immediate event that ended the banking crisis was not monetary policy, but the abandonment of mark-to-market accounting by the Financial Accounting Standards Board on March 16, 2009, in response to Congressional pressure by the House Committee on Financial Services on March 12, 2009. The change to the accounting rule FAS 157 removed the risk of widespread bank insolvency by eliminating the need for banks to make their losses transparent. No mark-to-market losses, no need for added capital, no need for regulatory intervention, recievership, or even bailouts. Misattributing the recovery to monetary policy has contributed to a faith in its effectiveness that cannot even withstand scrutiny of the 2000-2002 and 2007-2009 recessions, and the accompanying market plunges. This faith is already wavering, but the loss of this faith will be one of the most painful aspects of the completion of the present market cycle. The simple fact is that the belief in direct, reliable links between monetary policy and the economy - and even with the stock market - is contrary to the lessons from a century of history. Among the many things that are demonstrably not true - and can be demonstrated to be untrue even with simple scatterplots - are the notions that inflation and unemployment are negatively related over time (the actual correlation is close to zero and slightly positive), that higher inflation results in lower subsequent unemployment (the actual correlation is positive), that higher monetary growth results in subsequent employment gains (the correlation is almost exactly zero), and a wide range of similarly popular variants. Even "expectations augmented" variants turn out to be useless. Examining historical evidence would be a useful exercise for Econ 101 students, who gain an unrealistic sense of cause and effect as the result of studying diagrams instead of data. In regard to what is demonstrably true, it can easily be shown that unemployment has a significant inverse relationship with real, after-inflation wage growth. This is the true Phillips Curve, but reflects a simple scarcity relationship between available labor and its real price, but this relationship can't be manipulated to create jobs (see Will the Real Phillips Curve Please Stand Up). It's also true that changes in stock prices are mildly correlated with subsequent reductions in the unemployment rate and higher GDP growth. But the effect sizes are strikingly weak. A 1% increase in stock prices correlates with a transitory increase of only 0.03-0.05% in subsequent GDP, and a decline of only about 0.02% in the unemployment rate. So to use the stock market as a policy instrument, the Fed would have to move the stock market about 70% above fair value just to get 2.8% in transitory GDP growth, and a 1.4% decline in the unemployment rate. Guess what? The Fed has done exactly that. The scale of present financial disortion is enormous, and further distortions rely on the permanent belief that there is actually a mechanistic link between monetary policy and stock prices. We know very well the mechanisms and actual historical relationships between monetary policy and financial markets, and doubt that any amount of quantitative easing will prevent a market slaughter in any environment where investors find short-term liquidity desirable (QE only “works” to the extent that zero-interest liquidity is treated as an undesirable “hot potato”). Still, the novelty of quantitative easing, and the misattributed belief that monetary policy ended the banking crisis, has created financial distortions where perception-is-reality, at least for now. We believe that the modifier “for now” will prove no more durable than it was during the tech bubble or the housing bubble. On Full-Cycle Discipline From a short-term perspective, the S&P 500 is pushing its upper Bollinger bands at daily, weekly and monthly resolutions (two standard deviations above the respective 20-period averages), which to say that the recent advance looks stretched. At the same time, though our measures of market internals still show internal divergence, there’s little question that speculation has gathered some momentum. Specifically, monetary “tapering” is likely to be taken off the table for a while, as the result of recent fiscal wrangling, which requires us to allow for the possibility of a speculative blowoff over a handful of weeks. Even if a speculative ramp occurs, it’s not at all clear that speculators will actually be able to get out with much – the first few days off the top are likely to wipe out months of gains in one fell swoop – but again, we have to at least allow for an already reckless situation to become even more reckless over the short run, as the crowd seems to have a bit in its teeth. In any event, while the potential for further speculation may warrant a bit of insurance (index call options have a useful contingent profile), the most important consideration continues to be the complete cycle, not the next few weeks. As in 2007, we’re back to a situation where fair value is more than 40% below present levels, and I believe that it is essential to maintain a strong defense overall. If you picture a small child throwing a stone upward and out over the edge of the Grand Canyon, you’ll get a general idea of the market trajectory that we expect over the completion of this cycle. With regard to catalysts, it’s a market truism that the catalysts become clear only after a bear market is well underway, but my impression is that the primary factor contributing to market losses over the remainder of this cycle will not be some abrupt crisis, but instead a persistent and broadening loss of confidence – not only in the ability of monetary policy to produce economic growth, but in the prospects for economic growth itself. The predictable contraction in corporate profit margins will certainly contribute, but remember that changes in corporate profits typically follow changes in combined government and household savings with a lag of 4-6 quarters, and most of the recent shift in combined savings has only occurred since the third quarter of 2012. All of this is a mixed situation – one where valuations and long-run evidence are extremely clear, but where perception and sentiment may dominate over the short-run. Our discipline remains to rely on the demonstrated historical evidence, while allowing for some amount of further distortion. Since 2000, we’ve made only two material changes to our investment discipline – one resulted from stress-testing against Depression-era outcomes that I insisted on in 2009-early 2010 (despite the fact that our existing estimation methods had served admirably to that point), and the other being a smaller hedging adaptation in 2012 (see Notes on An Extraordinary Market Cycle). Our confidence in our discipline follows directly from knowing exactly how our present methods have performed in market cycles across history, including the Depression, including the cycle from 2000-2007, and including the cycle from 2007 to the present. In hindsight, I would undoubtedly prefer to have applied either our present return/risk estimation methods or our pre-2009 methods over the complete course of the most recent cycle, without the unfortunate and awkward transition that the credit crisis provoked. We don’t have that luxury, but to understand the full story of the half-cycle since 2009, and to take either our pre-2009 or present methods to the data (the present ones also covering Depression-era outcomes) is to understand why we adhere to our discipline without blinking. See Aligning Market Exposure with the Expected Return/Risk Profile for the general framework and a very simple illustration of this discipline. As I’ve noted before, history repeatedly teaches a very coherent set of lessons:
Monetary conditions can be a modifier, but have historically not prevented these basic tendencies from dominating over time. Investors who are convinced that this time is different or that following the Fed is some kind of “sure thing” are at liberty to forge their own path and test that hypothesis on their own. We cannot do it for them, nor are we moved by any inclination to do so. It’s quite popular, at times like these, for people to quote Keynes, saying “the market can remain irrational longer than you can remain solvent,” but insolvency is the problem of debtors and those who speculate on margin, not for those who simply await better opportunities. Keynes actually made that comment because he was wiped out with a leveraged long position in a plunging market. From my standpoint, the more apt perspective is that of J. Paul Getty (whom I also quoted in 2000, and at the May highs, a few percent from current levels). Getty wrote: “For as long as I can remember, veteran businessmen and investors – I among them – have been warning about the dangers of irrational stock speculation and hammering away at the theme that stock certificates are deeds of ownership and not betting slips... The professional investor has no choice but to sit by quietly while the mob has its day, until the enthusiasm or panic of the speculators and non-professionals has been spent. He is not impatient, nor is he even in a very great hurry, for he is an investor, not a gambler or a speculator. The seeds of any bust are inherent in any boom that outstrips the pace of whatever solid factors gave it its impetus in the first place. There are no safeguards that can protect the emotional investor from himself.” The foregoing comments represent the general investment analysis and economic views of the Advisor, and are provided solely for the purpose of information, instruction and discourse. Only comments in the Fund Notes section relate specifically to the Hussman Funds and the investment positions of the Funds. Fund Notes As of last week, Strategic Growth Fund remained fully hedged, with a “staggered strike” position that places the strike prices of its index put options moderately below present market levels. The Fund also carries a small contingent call option position representing a small fraction of 1% of assets, as slight insurance against the possibility of a further speculative “blowoff” over the shorter-term. To be clear, we remain defensive overall. Meanwhile, Strategic International remains fully hedged, Strategic Dividend Value is hedged at about 50% of the value of its stock holdings, and Strategic Total Return carries a duration of just over 6 years (meaning that a 100 basis point move in yields would be expected to impact the Fund by about 6% on the basis of bond price fluctuations), with just over 8% of assets in precious metals shares and a small position in utility shares. --- The foregoing comments represent the general investment analysis and economic views of the Advisor, and are provided solely for the purpose of information, instruction and discourse. Prospectuses for the Hussman Strategic Growth Fund, the Hussman Strategic Total Return Fund, the Hussman Strategic International Fund, and the Hussman Strategic Dividend Value Fund, as well as Fund reports and other information, are available by clicking "The Funds" menu button from any page of this website. |
|||||||||||||||||||||||||
|
For more information about investing in the Hussman Funds, please call us at
1-800-HUSSMAN (1-800-487-7626) 513-326-3551 outside the United States Site and site contents © copyright Hussman Funds. Brief quotations including attribution and a direct link to this site (www.hussmanfunds.com) are authorized. All other rights reserved and actively enforced. Extensive or unattributed reproduction of text or research findings are violations of copyright law. Site design by 1WebsiteDesigners. |