
|
|
||||||
|
|

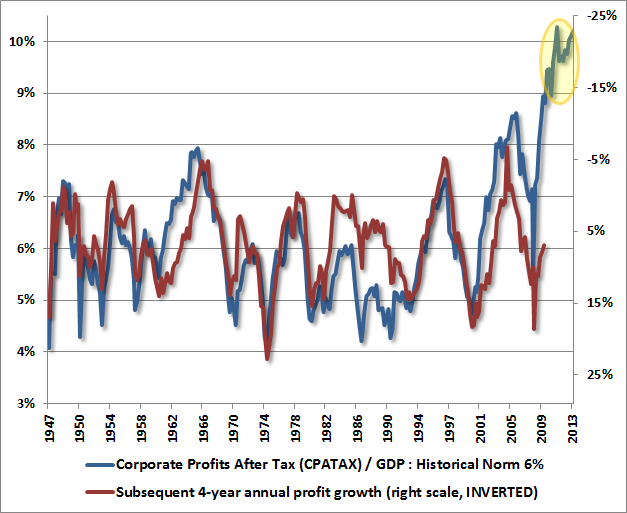
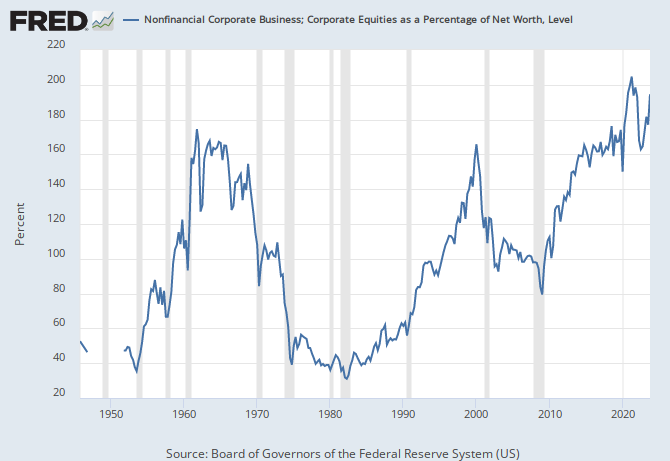
March 31, 2014 Shifting Policy at the Fed: Good for Long-Term Growth, Bad for Cyclical Bubbles In the face of financial markets that we view as steeply overvalued as a result of yield-seeking by investors, an important development in the financial markets in recent months is the gradual recognition by the Federal Reserve that, in the words of several FOMC members, the policy of quantitative easing has “overstayed its welcome”, and that the Fed has attempted to “overplay its hand.” As FOMC member Richard Fisher has observed, the Fed is “distorting financial markets and creating incentives for managers and market players to take increasing risk.” Member Charles Evans – correctly in our view – openly warns “I am very worried about the potential for unintended consequences of all this action.” Esther George concurred last week “these policy settings also contain risk in the long run to financial stability.” FOMC member James Bullard observed that the Fed has set “a high bar” for moving away from tapering QE. Charles Evans and Narayana Kocherlakota, in contrast, remain dovish. Among the moderates, Sandra Pianalto indicated that the first step to unwinding the Fed’s balance sheet would likely be to stop reinvesting the proceeds of maturing Treasury and mortgage debt held by the Fed. The key observation here is that the Fed is wisely and palpably moving away from the idea that more QE is automatically better for the economy, and has started to correctly question the effectiveness of QE, as well as its potential to worsen economic risks rather than remove them. We continue to believe that the financial crisis was ended not by QE, but instead by the March 2009 decision by the Financial Accounting Standards Board to relieve banks of the need to mark distressed assets to market, allowing “significant judgment” instead. Though QE undoubtedly helped the mortgage market to recover, nearly a century of economic history had long rendered a verdict on broader hopes for QE even before the policy began. Both theory and evidence reject the idea of a useful “wealth effect” from stock market valuations to consumer spending. As Milton Friedman and Franco Modigliani demonstrated decades ago, consumers do not alter spending in response to variations in volatile forms of income, but instead consume based on their assessment of their probable “permanent income” over the long-term. Until 2008, variations in home values did exhibit a wealth effect, but that was because those variations were fairly smooth and unidirectional. Equity prices are anything but smooth or permanent. To offer an idea of “effect sizes,” a 40% increase in the value of the stock market would be associated with a short-lived (roughly 2-year) boost to GDP of about 2%, and a short-lived reduction in the rate of unemployment of about 1%. Needless to say, any subsequent market loss would be accompanied by similar, though also short-lived, downside risk to the economy. Ultimately, wealth is a claim on a stream of future consumption, aggregate wealth creation requires productive investment, and changing the transitory price paid for equities does not materially alter aggregate wealth, however aggressively policy might attempt to prop valuations higher in the short run. In some sense, the weakness of the “equity wealth effect” is good news – an eventual and economically healthy retreat in equity valuations is likely to have only transitory effects on employment, but favorable effects on the productive allocation of capital. All of this is true, however, provided that the Fed does not respond by encouraging fresh cycles of yield-seeking speculation, and is vigilant about emerging risks in leveraged loans and the now record level of equity exposure financed with margin debt. Fed-induced yield seeking is alive and well, but the desire for new “product” is being satisfied not with mortgage debt, but with low quality covenant lite debt and equity market speculation. With regard to the debt markets, leveraged loan issuance (loans to already highly indebted borrowers) reached $1.08 trillion in 2013, eclipsing the 2007 peak of $899 billion. The Financial Times reports that two-thirds of new leveraged loans are now covenant lite (lacking the normal protections that protect investors against a total loss in the event of default), compared with 29% at the 2007 peak. European covenant lite loan issuance has also increased above the 2007 bubble peak. This is an important area for regulatory oversight. Meanwhile, almost as if to put a time-stamp on the euphoria of the equity markets, IPO investors placed a $6 billion value on a video game app last week. Granted, IPO speculation is nowhere near what it was in the dot-com bubble, when one could issue an IPO worth more than the GDP of a small country even without any assets or operating history, as long as you called the company an “incubator.” Still, three-quarters of recent IPOs are companies with zero or negative earnings (the highest ratio since the 2000 bubble peak), and investors have long forgotten that neither positive earnings, rapid recent growth, or a seemingly “reasonable” price/earnings ratio are enough to properly value a long-lived security. As I warned at the 2000 and 2007 peaks, P/E multiples – taken at face value –implicitly assume that current earnings are representative of a very long-term stream of future cash flows. One can only imagine that recording artist Carl Douglas wishes he could have issued an IPO based his 1974 earnings from the song Kung Fu Fighting, or one-hit-wonder Lipps Inc. based on Q2 1980 revenues from their double-platinum release Funkytown. The same representativeness problem is evident in the equity market generally, where investors are (as in 2000 and 2007) valuing equities based on record earnings at cyclically extreme profit margins, without considering the likely long-term stream of more representative cash flows. There’s certainly a narrow group of stable blue-chip companies whose P/E ratios can be taken at face value. But that’s because they generate predictable, diversified, long-term revenue growth, and also experience low variation in profit margins across the economic cycle. Warren Buffett pays a great deal of attention to such companies. But looking at major stock indices like the S&P 500, Nasdaq and Russell 2000 as a whole, margin variation destroys the predictive usefulness of P/E ratios that fail to take these variations into account. Similarly, the “equity risk premium” models often cited by Chair Yellen and others perform terribly because they fail to capture broader variation in profit margins over the economic cycle. Even measures such as market capitalization / national income and Tobin’s Q have dramatically stronger correlations with actual subsequent market returns (particularly over 7-10 year horizons), and have been effective for a century, including recent decades. The FOMC would do well to increase its oversight of areas where exposure leveraged loans, equity leverage, and credit default swaps could exert sizeable disruption. From a monetary policy standpoint, the effort to shift from a highly discretionary policy to a more rules-based regime is a welcome development... except for speculators banking on an endless supply of candy. Economic Notes Small fourth-quarter revisions for GDP and other economic statistics were released last week. Broadly speaking, we continue to observe GDP, real final sales and other economic measures hovering at growth rates that typically delineate the border between expansion and recession. With inventory accumulation the primary driver of growth in gross domestic investment, and households carrying more debt as a ratio of disposable income than at any time in history (supported only in the near-term by suppressed interest costs), we don’t observe a great deal of pent-up economic demand in the system save for the possibility of a weather-related bounce. As I’ve noted in recent months, the correlation between historically useful leading economic measures and actual economic activity has been disrupted a great deal by quantitative easing in recent years. This has made economic projections much more difficult. So while we observe borderline economic activity, any expectation of an economic downturn would require much stronger evidence on a diverse range of measures, including equity price weakness, widening credit spreads (both on a 6-month lookback), a drop in year-over-year payroll growth below about 1.3%, and further softening in a range of national and regional Fed surveys and purchasing managers indices. As a rule, when the noise increases relative to the signal, the best information is obtained by looking for uniform shifts across several imperfectly correlated measures. We don’t yet observe that sort of uniformity. Meanwhile, the latest economic data provide no optimism on the outlook for profit margins over the completion of the present market cycle or over the longer-term. From our perspective, the central economic relationships we’ve described previously continue to hold in current, real-world data – see The Coming Retreat in Corporate Earnings. Keep in mind, however, that some of these relationships are exerted with a lag of several quarters and are not immediate. Corporate profits appear likely to contract over the next few years from a mean-reversion perspective. The chart below shows corporate profits relative to GDP, against subsequent 4-year growth in corporate profits (right scale inverted). While relationship is not exact, there is little reason to believe that the current near-record share of profits will be sustained indefinitely. A high share of profits relative to GDP is related, even in recent economic cycles, to weak subsequent profit growth over the next several years. Arguments that the economy that has “changed” in a way that invalidates this regularity had better identify something that has permanently invalidated all of economic history prior to about 2010.
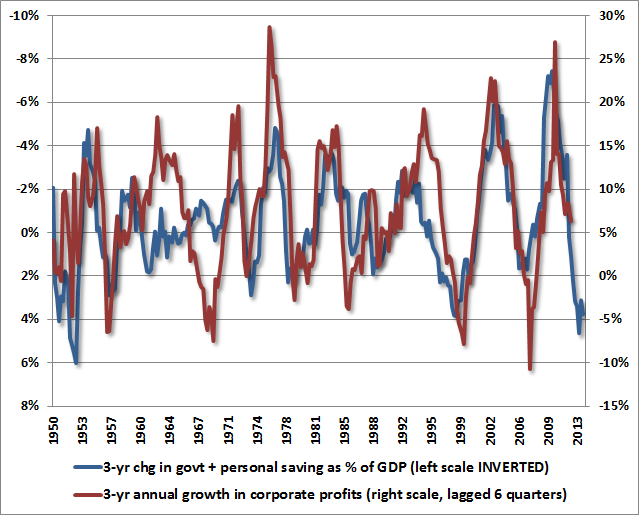
Likewise, corporate profits appear likely to contract over the next few years from a surplus/deficit perspective. In equilibrium, the deficits of one sector must emerge as the surplus of another. As we and GMO’s James Montier have detailed elsewhere, the massive deficits of the household and government sectors following the Great Recession produced a mirror image surplus in the corporate sector in recent years, and this relationship is nothing new (see An Open Letter to the FOMC: Recognizing the Valuation Bubble in Equities for a review of the accounting relationships here). The gradual normalization of household and government deficits suggests that a reversal of this trend is already underway (though the impact tends to work itself out over several quarters). Again, there is no evidence at all that these relationships have broken down even in recent economic cycles, as much as some analysts wish to argue that the world has completely changed and that corporate profits will remain permanently elevated.
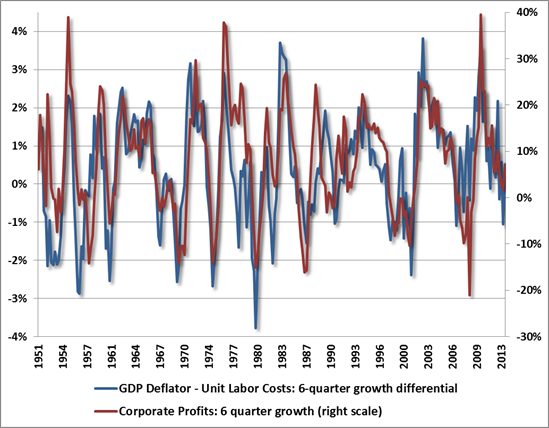
Finally, corporate profits are already being pressured from a labor cost perspective as well. Again, we don’t observe any meaningful “new economic era” that has disrupted the historical relationships in this data.
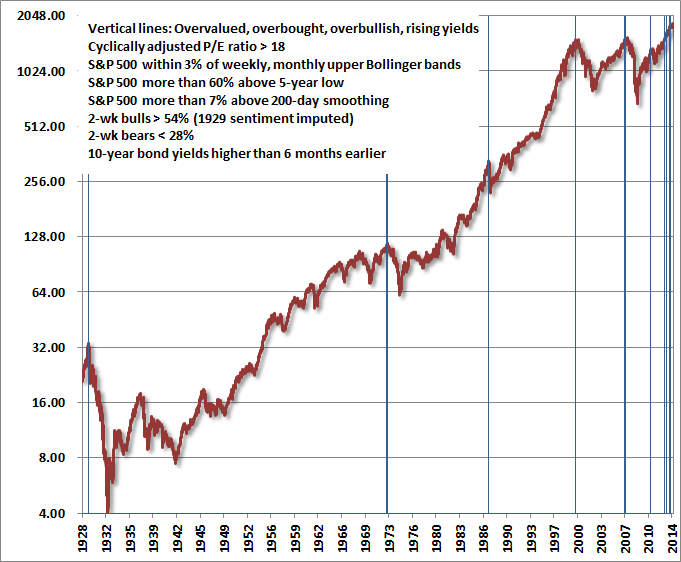
The Statistics of Discipline One of the central views underlying our investment approach is that the expected return and risk of the market varies based on observable conditions, particularly valuations, market action, sentiment, interest rates, and other factors. For an overview of these principles, see Aligning Market Exposure with the Expected Return/Risk Profile. I have a “permabear” reputation with those not familiar with our experience in the years prior to 2009. The fact is that even our defensiveness in the late-1990’s bubble was easily vindicated by the 2000-2002 plunge, after which we shifted to a positive stance in early 2003, and then largely avoided the 2007-2009 collapse (which wiped out the entire total return of the S&P 500 – in excess of Treasury bill returns – all the way back to June 1995). Our present defensiveness is easiest to dismiss by ignoring the reason for the unique challenges we’ve faced in this particular cycle: the awkward transition resulting from my 2009 insistence on stress-testing our methods against Depression-era outcomes. For those who understand that narrative, I’ll note that my confidence in our approach is rooted in a century of market history, including how both our pre-2009 and present methods (had they been in hand) would have navigated the current market cycle in the absence of that stress-testing. Suffice it to say that I believe that transition is behind us. Our defensiveness in recent months is not something that we are inclined to “fix,” because the objective data would have encouraged the identical defensiveness at only a small handful of similar points, including the 1929, 1972, 1987, 2000 and 2007 peaks, as well as a less extreme peak in 2011 (which still resulted in a near-20% market loss before another round of QE restored the speculative pitch). Even the most hostile set of market conditions we identify include periods of advancing prices, and even the most favorable set of market conditions we identify include periods of declining prices. It is only over repeated instances over the course of the market cycle that we expect the average market behavior in these market conditions to dominate the random day-to-day and week-to-week noise. If we partition market history into periods when our return/risk estimates and other considerations would have supported a fully unhedged or aggressive stance toward stocks (which is true of roughly 52% of history), we still find that the 1.71% standard deviation of actual weekly returns is slightly more than four times the 0.42% average weekly return (24.3% annualized) of the S&P 500 during those historical periods. In periods that would have supported our most defensive position (roughly 6% of history, including today), we find that the 2.64% standard deviation of weekly returns is still about three times the -0.90% average weekly return (-37.4% annualized) of the S&P 500 during those historical periods. As for intermediate conditions, those that support a constructive but not aggressive stance (roughly 11% of history) are associated with a weekly standard deviation of 2.13% and an average weekly return of 0.22% (16.6% annualized). Those that support a fully-hedged stance, but not arm-waving bearish (roughly 31% of history) are associated with a weekly standard deviation of 2.36% and an average weekly return of 0.23% (1.2% annualized). Note that these figures are based on the historical market returns associated with various observable conditions we identify. While we strongly believe that conditions such as valuations, market action, monetary conditions, sentiment, and other factors are informative, there is no assurance that these return/risk relationships will persist in the future. In a “bell shaped” curve, about two-thirds of the observations are within one standard deviation from the average, and about 95% of the observations are within two standard deviations from the average. Using basic statistics, we can estimate that even in the most favorable conditions we identify, we would still expect to see the market decline about 40% of the time on a week-to-week basis. Similarly, even in the most negative conditions we identify, we would still expect to see the market advance about 37% of the time on a week-to-week basis. It’s only over the course of a full market cycle that we would begin to expect the averages to hold with any precision. Moreover, the various return/risk distributions are typically skewed (compared with a standard bell-curve), which means that infrequent events can have a substantial overall impact. This increases the number of individual "draws" needed to for those averages to hold. In any event, even a standard bell-curve offers useful intuition. If the single-period expected gain of a given process is “a” and the single period standard deviation is “s,” it turns out that the expected gain of the process over N periods is roughly N*a, and the standard deviation over N periods is (square root of N)*s. So as you increase the number of periods, the relationship between the “predictable” component and the “noise” component changes. If the amount of single-period noise is several times the single-period expected return, it takes a whole series of periods to predictably reverse that relationship. In the investment arena, this need for repeated behavior is better known by the words “patience” and “discipline.” The key point is that our investment approach is not based on forecasting near-term movements in the financial markets, but instead on aligning our investment stance with the average return/risk profile that we associate with various observable market conditions. Over the very short-term, the volatility of week-to-week market returns completely dominates any predictable component. Our investment outlook will change as conditions change, but throughout, our effort is to align our outlook with the average return/risk profile that we associate with observable market conditions at each point in time. The foregoing comments represent the general investment analysis and economic views of the Advisor, and are provided solely for the purpose of information, instruction and discourse. Only comments in the Fund Notes section relate specifically to the Hussman Funds and the investment positions of the Funds. Fund Notes The Hussman Funds remain defensively positioned in the equity markets, with modestly favorable stances toward Treasury debt and precious metals shares. Given the extremely overvalued, overbought, overbullish syndrome of conditions we observe, coupled with a clear transition in monetary policy, I expect to observe a significant shift in market conditions in year ahead, and over the completion of the present market cycle. We will align our investment stance in response. In this context, it’s important to recognize that the same methods that presently encourage a defensive position would have encouraged a similarly defensive position in less than 6% of market history, while encouraging an unhedged or leveraged stance in about 52% of market history. Since 2000, this historical balance has certainly been skewed toward the defensive side, given repeated episodes of speculative overvaluation and subsequent market collapses. However, the assumption that we maintain a permanently bearish outlook toward the market is an artifact of a stress-testing period that led us to miss a constructive shift following the 2007-2009 market plunge. That missed opportunity is now long gone, and the half-cycle since 2009 is decidedly lacking a full-cycle completion. I cannot emphasize strongly enough that we view the present market extreme, and the defensive stance it justifies, as an historical anomaly. --- The foregoing comments represent the general investment analysis and economic views of the Advisor, and are provided solely for the purpose of information, instruction and discourse. Prospectuses for the Hussman Strategic Growth Fund, the Hussman Strategic Total Return Fund, the Hussman Strategic International Fund, and the Hussman Strategic Dividend Value Fund, as well as Fund reports and other information, are available by clicking "The Funds" menu button from any page of this website. |
|||||||||||||||||||||||||
|
For more information about investing in the Hussman Funds, please call us at
1-800-HUSSMAN (1-800-487-7626) 513-326-3551 outside the United States Site and site contents © copyright Hussman Funds. Brief quotations including attribution and a direct link to this site (www.hussmanfunds.com) are authorized. All other rights reserved and actively enforced. Extensive or unattributed reproduction of text or research findings are violations of copyright law. Site design by 1WebsiteDesigners. |

