|
|
||||||
|
|

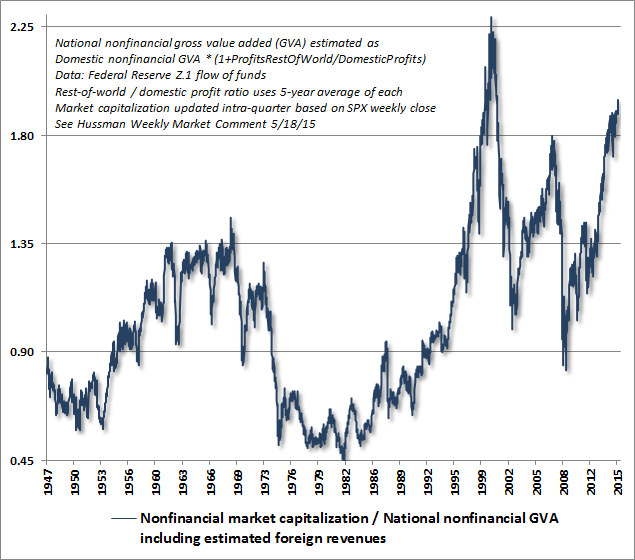
June 8, 2015 Why Stocks are Not "Cheap Relative to Bonds" One of the constant refrains we hear at present is that while stocks may be richly valued on an absolute basis, they are “cheap relative to bonds.” At least one professor recently told students that valuations are meaningless because the P/E on cash is 100. Technically, with T-bill yields at just 0.01%, the P/E on cash is more like 10,000, but let’s not quibble. Using simple P/E ratios or inverted interest rates as a standard of value only makes sense if you have no appreciation for how securities are valued. By this kind of standard, I would advise these students to propose that their professor give them each $100 in return for a promise of a single payment of $2 next year, on the argument that the P/E of 50 is a fraction of the "P/E on cash." The immediate objection - "but, value isn't just about the coming year" - is the beginning of insight. I’ll repeat what I’ve called the Iron Law of Valuation: every security is a claim on a very long-term stream of future cash flows that will be delivered into the hands of investors over time. Given that expected stream of future cash flows, the current price of the security moves opposite to the expected future return on that security. The value of a share of stock is determined by far more than current earnings, and one's estimate of value will be ill-formed if current earnings aren't a sufficient statistic for the long-term earnings trajectory. Moreover, market valuations, prospective equity returns, and actual realized equity returns have historically been only weakly related to the level of interest rates (even long-term interest rates). The long-term rate of return priced into stocks is far less correlated and less sensitive to interest rates than investors seem to believe (see Recognizing the Risks to Financial Stability for the record on this, particularly with regard to the "Fed Model"). Every valuation ratio used on Wall Street is simply an effort to approximate the Iron Law of Valuation by comparing price with some fundamental “X,” instead of explicitly modeling the long-term stream of deliverable cash flows for that investment. And here’s the central issue – if your fundamental “X” is not representative and proportional to the very, very long-term stream of cash flows that stocks are likely to deliver over time (think 50 years), valuing stocks as a ratio to X is meaningless. At the extreme, paying $100 for a one-year promise of $25 would represent a “cheap” P/E of just 4, but it would also be a ridiculous investment. Similarly, history has demonstrated cycle after cycle after cycle that paying elevated P/E multiples on record earnings is a time-tested way to lose 30-50% of your money by the time the cycle is complete. As for the discount rate applied to those cash flows, understand that whatever discount rate you use is also the long-term rate of return that you get if the expected cash flows actually materialize. The higher the price an investor pays for a given stream of expected cash flows today, the lower the return that an investor should expect over the long-term. As detailed below, investors have responded to zero interest rates by driving stock valuations up to the point where expected market returns over the coming decade are also zero. Given that outcome, one is quite free to say that stocks are reasonably valued “relative” to zero interest rates, but one should still expect zero 10-year returns on stocks. My impression is that's not how investors are thinking. Particularly at market peaks, investors seem to believe that regardless of the extent of the preceding advance, future returns remain entirely unaffected. The repeated eagerness of investors to extrapolate returns and ignore the Iron Law of Valuation has been the source of the deepest losses in history. If one cares about evidence, the evidence will demonstrate that the most reliable valuation measures across a century of market history are those that implicitly or explicitly adjust for variation in profit margins over the economic cycle. See Margins, Multiples, and the Iron Law of Valuation for extensive detail on this fact. The argument is not that record profit margins need to retreat at all anytime soon, only that history teaches that one should not base equity valuations on the presumption that record profit margins will persist for the next five decades. This is particularly true when we can clearly identify their temporary origin in exteme mirror-image deficits in the household and government sectors. For as much detail on this as one could wish, see An Open Letter to the FOMC: Recognizing the Valuation Bubble in Equities, and Profit Margins, Is the Ladder Starting to Snap? Indeed, across a wide range of measures including price/trailing earnings, price/forward operating earnings, the Fed Model, price/book value, price/dividend, Shiller P/E, Tobin’s Q, market capitalization to GDP, and even S&P 500 price/revenue, the ratio-based valuation measure most tightly correlated with actual subsequent S&P 500 nominal total returns over the following decade is the ratio of nonfinancial market capitalization to national nonfinancial gross value added (which I introduced in order to account for the estimated impact of foreign revenues). We’ll simply call this measure “market cap/GVA.” Call it the “Hussman Ratio” if you want it to be completely dismissed by investors here, and to suddenly become a revered valuation metric after all the horses have left the stable. Champ to chump, chump to champ. Bubble-era soundtrack of value investors everywhere. Ignore the next four charts at your peril. Note that current valuations are above the 2007 peak, and are now within about 15% of the 2000 extreme. Of course, this might be easily ignored except for the fact that this measure is also more tightly correlated with actual subsequent market returns than any alternative valuation ratio we’ve tested across history.
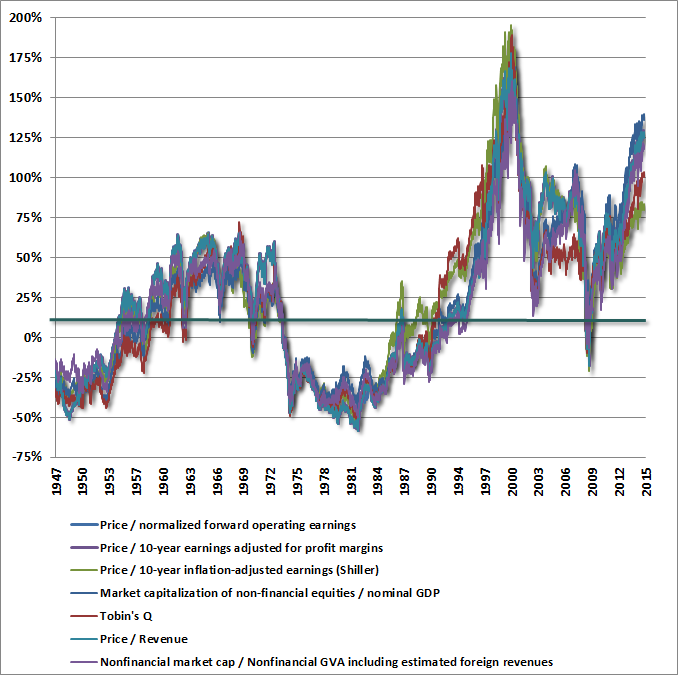
That’s not to say that other historically reliable valuation measures don’t share largely the same implication. The following chart provides a broad review, with each measure plotted as a percentage deviation from its respective pre-bubble historical norm. With the average of these easily more than twice those norms, the only argument between them is whether prospective 10-year returns are closer to 2% annually or whether they are actually negative. Still, among these, market cap/GVA is the best correlated with actual subsequent market returns.
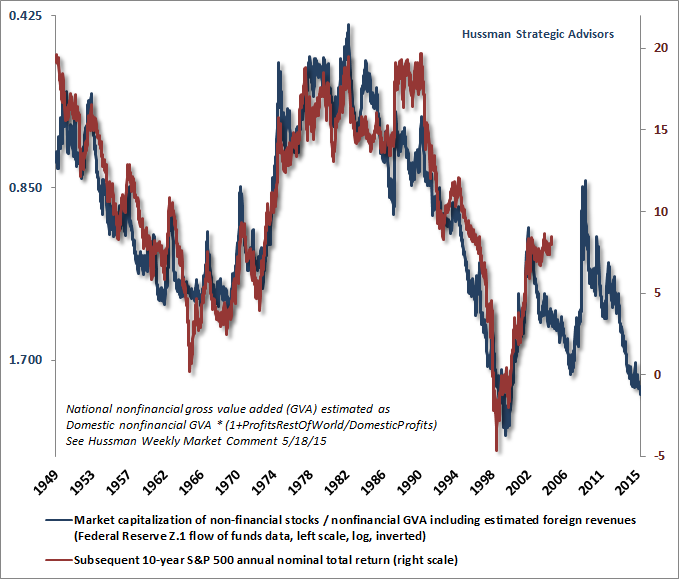
The following chart places market cap/GVA on an inverted log scale, along with the actual subsequent annual nominal total return of the S&P 500 over the following decade. Put simply, investors should expect no additional total return at all for the S&P 500 over the next 10 years. This isn’t some preposterous, hyperbolic, worst-case scenario. It’s the run-of-the-mill expectation, and reflects how extreme valuations have become as a result of yield-seeking speculation promoted by Federal Reserve interventions.
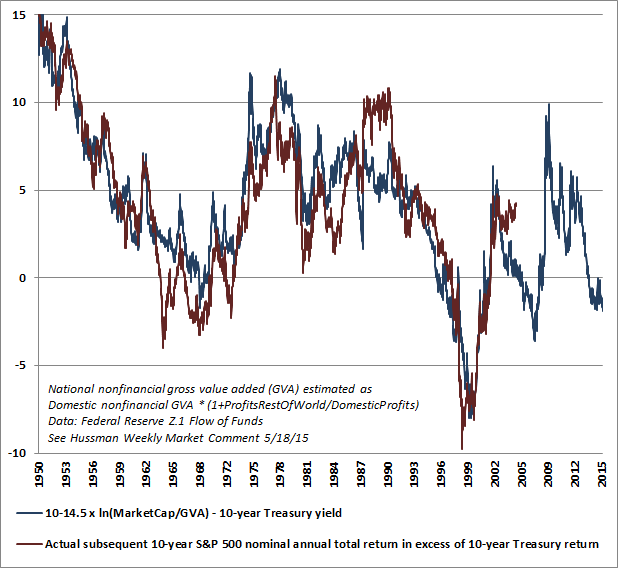
The S&P 500 has seen negative 10-year prospective returns before (as we correctly projected in real-time at the 2000 peak, based on similar arithmetic, even allowing for optimistic assumptions). What we haven’t seen at any point in history is the combination of dismal projected returns for the S&P 500 coupled with a similarly dismal yield-to-maturity on bonds. The coming decade will be an underfunding disaster for corporate pension plans, endowments, and municipalities, most that still typically plan around an assumed rate of return closer to 8%. The most reliable measures we identify suggest that nominal total returns on a conventional asset mix are likely to be closer to 1% annually. Quantitative easing has already given investors, at least on paper, the gains that they would otherwise have waited years longer to achieve (again, at least on paper). Particularly in equities, investors who do not have a very long horizon and cannot actually tolerate a 50% loss should consider realizing those paper gains now and cutting exposure to a tolerable level. That's not market timing - it's sound financial planning that may be quite overdue. My impression is that the window of opportunity is closing quickly. My guess is that many observers may be thinking, “Well, even if I agree, the Fed may not tighten until September or later, so I’ll hang on until then.” To which I have two responses: 1) Recall that the 2000-2002 and 2007-2009 collapses were accompanied by Fed easing, not tightening. “Following the Fed” would have been disastrous in each case, as the Fed cut rates persistently and aggressively as the market lost half its value. Indeed, the Fed began cutting rates several weeks before the 2007 peak. The Fed also did not tighten within a year of the 1929 peak. Conversely, the market has often advanced in the face of repeated Fed rate hikes. If you actually care about evidence, you'll find that "following the Fed" has a much poorer record than investors seem to imagine. Fed easing only supports the financial markets to the extent that it provokes risk-seeking investor preferences, and that link is far from reliable. Market internals are a much more direct measure of investor risk preferences. The most reliable precursor to major market collapses has instead been a breakdown of market internals following an extended and seemingly interminable period of overvaluation – which we already observe here. 2) How many investors do you suspect will be available to absorb your shares at current price levels once they begin trying to exit simultaneously? Look around, and all you’ll see are other bulls who share virtually identical beliefs despite the fact that many of those beliefs are contradicted by historical evidence. As I’ve detailed in recent weeks, stocks have been in a clear price-volume distribution pattern for nearly a year. The NYSE Composite has gone nowhere since last July, while the Dow and S&P 500 are back to their late-December levels. Soon, the only ones who will be available to take the buy side against sell orders are, well, value investors like me, and we don’t see value anywhere near current levels. The rule is simple. Once market internals have deteriorated, the exit rule for bubbles is that you only get out if you panic before everyone else does. But aren’t stocks “cheap relative to bonds”? Unfortunately, the evidence suggests exactly the opposite. Indeed, despite a yield to maturity of hardly more than 2% annually, Treasury bonds are still likely to outperform the total return of the S&P 500 over the coming decade. The following chart presents the difference between the estimated 10-year total return of the S&P 500 and the yield-to-maturity on 10-year Treasury bonds, compared with the actual subsequent return of the S&P 500 in excess of 10-year bond yields. We estimate that from current valuations, the S&P 500 will underperform Treasury bonds by more than 2% annually over the coming decade. We’ve never observed a similar level of stock vs. bond valuations without stocks actually underperforming bonds over the subsequent 10-year period. Next, look at bear market lows such as 2009, 2002, 1990, 1987, 1982, 1978, and 1974, and recognize that the completion of every market cycle in history has provided better investment opportunities, both in absolute terms, and relative to bonds, than are presently available. Frankly, history suggests that a rather ordinary completion to the present market cycle would involve the S&P 500 losing more than half of its value.
As a side note, the regression estimate of 10-14.5 x ln(MarketCap/GVA) is a convenient way of noting that the long-term norm of MarketCap/GVA is almost exactly 1.0, and this norm has historically been associated with S&P 500 10-year returns of 10% annually. Given that MarketCap/GVA recently peaked at about twice that level, we would estimate that the S&P 500 would be priced for historically run-of-the-mill 10% annual returns only after a loss of about 50%. That lines up well with the implications of other methods (see Fair Value on the S&P 500 Has Three Digits). Regardless of the level of interest rates, that level of prospective market returns has been approached or exceeded in every market cycle across history. Nodding to the elephant As usual, if we expect others to have confidence in our present outlook, we have to address the elephant in the room, which is our difficulty during the half-cycle since the 2009 low. I’ve written a great deal about the inadvertent challenges that resulted from my 2009 insistence on stress-testing our methods of estimating market return/risk profiles against Depression-era data, which I believe we fully addressed in mid-2014 (see Voting Machine, Weighing Machine and A Better Lesson than “This Time is Different” for the full narrative). Still, as a colleague correctly noted last week, the actual break from years of outstanding outcomes actually occurred in late-2008, after the market had plunged more than 40% and I shifted to a constructive outlook (as I have after every bear market decline in my investment career of three decades – which complicates the narrative for those who prefer to label me a “permabear”). I’ve often observed that the best investment opportunity in each market cycle, from the standpoint of prospective return/risk, occurs at the point where a material retreat in valuations is joined by an early improvement in market internals. So, what happened in late-2008? As I noted a couple of years ago, one of our stress-testing findings was that Depression-era data, as well as 2008, demanded "a broader set of positive divergences in what we define as 'early improvement in market action'" than was required in other post-war market cycles. In late-2008, we saw an improvement in “early” measures of market action that had – during the post-war era – consistently identified important market reversals. You can watch me walk right into that late-2008 constructive stance in the section titled “Early measures of market action turn favorable” in Why Warren Buffett is Right and Why Nobody Cares. While I didn’t encourage an unhedged investment stance, I did encourage a put-option-only defense, keeping average strike prices close to prevailing market levels (which behaves as a roughly 50% invested position). Yet the market continued to plunge further in late-2008, and the problem from an analytical standpoint became that the behavior of both the financial markets and the economy finally became “out of sample” from the context of post-war data. That was one of the factors that convinced me to stress-test our methods against Depression-era data. Another was the experience of the legendary value investor Benjamin Graham, who lost two-thirds of his portfolio during the Great Depression by becoming constructive too early, as valuations returned to historically reasonable levels. When we compare our present methods with our pre-2009 methods, the central difference is the explicit imposition of strong overlays related to market internals, credit spreads, and related factors, which we view as the most reliable means to infer changes in investor risk preferences. This addresses our two central challenges in the complete market cycle since 2007: 1) post-war measures of “early improvement” in market action were not demanding enough to deal with Depression-like selling pressure in late-2008, so despite a 40% collapse in valuations, we responded too soon with a constructive stance; 2) the ensemble methods that initially resulted from our stress-testing captured the historical regularity that extreme overvalued, overbought, overbullish syndromes had historically accompanied or closely preceded breakdowns in market internals, and immediately encouraged a defensive response as soon as those syndromes emerged. If quantitative easing did one thing, it was to to weaken that link between overextended conditions and subsequent internal deterioration. Our present methods require a breakdown in market internals or credit spreads in order to support a hard-defensive outlook. Everyone is free, of course, to dismiss both unfavorable valuations and unfavorable market internals here. I see that as a terrible idea – the error of conflating objective evidence with our subjective experience in the recent half-cycle. To understand that subjective experience more broadly is to understand that respect for the interplay of valuations and market internals has been the central factor in every major success in my investment career (both bullish and bearish), and that every material disappointment has traced in one way or another to an insufficient focus on the risk preferences of investors, as conveyed by broad market internals and credit spreads. I started this comment with a reference to what I call the Iron Law of Valuation. It’s worth ending this comment with the Iron Law of Speculation, to bring these features into a coherent whole: The near-term outcome of speculative, overvalued markets is conditional on investor preferences toward risk-seeking or risk-aversion, and those preferences can be largely inferred from observable market internals and credit spreads. In the long-term, investment outcomes are chiefly defined by valuations, but over the shorter-term, the difference between an overvalued market that becomes more overvalued, and an overvalued market that crashes, has little to do with the level of valuation and everything to do with investor risk preferences. Based on the combination of obscene valuations and increasing deterioration across a wide range of market internals, our outlook remains hard-defensive here. If market internals improve, our downside concerns will become much less pointed. At present, market losses that may seem like “worst case” scenarios are actually quite run-of-the-mill expectations. As Santayana wrote, “Those who do not remember the past are condemned to repeat it.”
“I’ve given you a great gift, George;” said Clarence, “the chance to see what the world will be like now that QE has driven the prospective return of every risky asset class to zero.” The foregoing comments represent the general investment analysis and economic views of the Advisor, and are provided solely for the purpose of information, instruction and discourse. Please see periodic remarks on the Fund Notes and Commentary page for discussion relating specifically to the Hussman Funds and the investment positions of the Funds. --- The foregoing comments represent the general investment analysis and economic views of the Advisor, and are provided solely for the purpose of information, instruction and discourse. Prospectuses for the Hussman Strategic Growth Fund, the Hussman Strategic Total Return Fund, the Hussman Strategic International Fund, and the Hussman Strategic Dividend Value Fund, as well as Fund reports and other information, are available by clicking "The Funds" menu button from any page of this website. |
|||||||||||||||||||||||||
|
For more information about investing in the Hussman Funds, please call us at
1-800-HUSSMAN (1-800-487-7626) 513-326-3551 outside the United States Site and site contents © copyright Hussman Funds. Brief quotations including attribution and a direct link to this site (www.hussmanfunds.com) are authorized. All other rights reserved and actively enforced. Extensive or unattributed reproduction of text or research findings are violations of copyright law. Site design by 1WebsiteDesigners. |