|
|
||||||
|
|

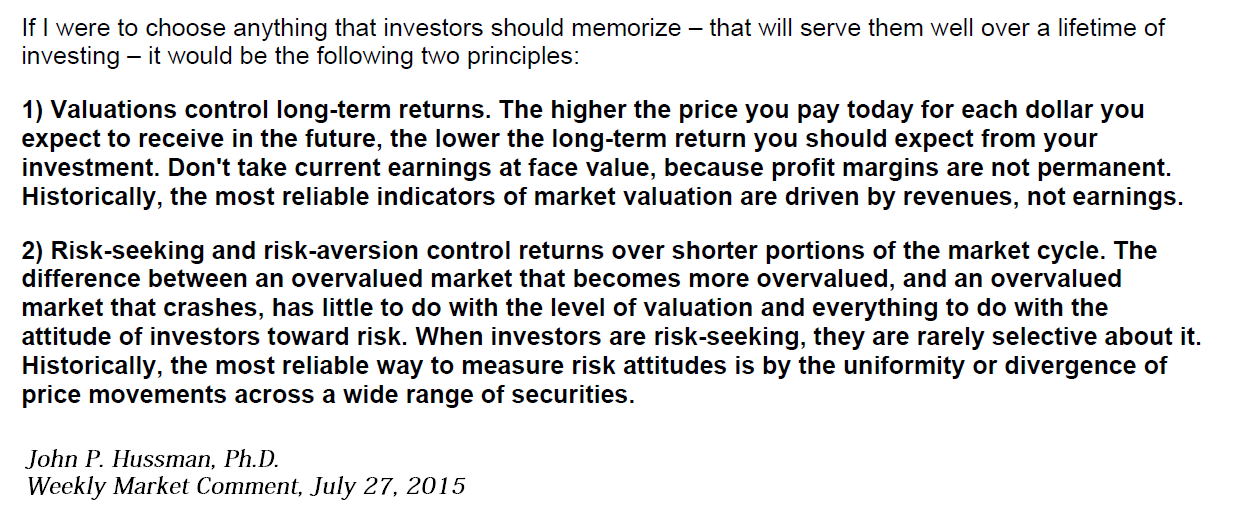
August 10, 2015 Thin Slices from the Top of a Bubble “You need to know very little to find the underlying signature of a complex phenomenon.... This is the gift of training and expertise – the ability to extract an enormous amount of meaningful information from the very thinnest slice of experience.” Malcolm Gladwell, Blink The ability to make accurate decisions in the face of overwhelming amounts of information can require a great deal of experience, but what does that experience actually do? My impression is that experience – studied and absorbed carefully – nurtures the ability to see and identify subtle elements in the landscape, and eventually to recognize patterns. Accurate decision-making doesn’t rely on weighing and deliberating over every detail of that landscape. As Malcolm Gladwell brilliantly writes in Blink, accurate decisions often rely on “thin-slicing” – a kind of pattern recognition that perceives and filters out the very few factors that actually matter. That’s not to suggest that simplicity, in and of itself, is the objective. Ockham’s Razor doesn’t merely say that the simplest explanation is usually the best; it requires that the explanation must also be consistent with the evidence. Likewise, Einstein joined his advice that “A theory should be made as simple as possible,” with the essential condition “but not so simple that it does not conform to reality.” One of the striking features of investing by the simplistic aphorism “Don’t fight the Fed” is precisely that it doesn’t conform to reality. For example, the Fed was persistently and aggressively easing through the entire market collapse of 2000-2002 and again through the collapse of 2007-2009. As I’ve often noted, “The trend is your friend” does much better historically, though the primary benefit is to reduce the depth of periodic market losses, as most popular trend-following methods fail to outperform a passive buy-and-hold approach after transaction costs. If I were on a desert island where I could invest using only one aphorism, I would choose “Don’t fight the tape” - provided that “the tape” was properly defined to capture the uniformity and divergence of a very broad range of individual stocks, industries, sectors, and security types, including yield spreads on debt of varying quality. "Buy low, sell high" is a tempting aphorism but is difficult to execute without additional information; while valuation is extremely informative about long-term returns, valuation is most useful when joined by market action. It's the combination of the two that distinguishes a bubble from a crash, and a crash from a recovery, and thereby identifies when to take action. Early in my career, I worked for Ralph Peters, an enormously successful investor and the former head of the Chicago Board of Trade. Out of an endless expanse of available data, he discerned a handful of essential considerations that he drew from the behavior of various markets. He called one of them his “lucky coin.” Research can be exhausting, experience can be painful, invention can be fraught with trial and error. Yet it’s exactly through that painstaking process that one gradually discerns a few central elements that actually matter. At the end of that enormous effort, many of the greatest discoveries seem simple - even obvious. As Peters told me, “Everything is easy, once you know how it works.” Thin-slicing can’t be done well without developing a very detailed vocabulary that allows key features to be recognized. One has to think about a given issue enough to develop an exhaustive vocabulary that can describe each case. That vocabulary is what then allows an expert to identify a handful of critical features in a blink of an eye, instead of losing all of that detail in a blur. As Gladwell writes, “Every moment – every blink – is composed of a series of discrete moving parts, and every one of those parts offers an opportunity...” Refining market vocabulary I’ve often observed that the central elements of our own discipline fall into two primary areas: “valuation,” and “market action.” Valuation provides enormous guidance about long-term returns. Every security is a claim on a very long-term stream of expected future cash flows that will be delivered into the hands of an investor over time. Given a stream of expected future cash flows and the current price of a security, it’s straightforward to estimate the long-term expected return. Conversely, given a stream of expected future cash flows and the long-term expected return that one requires, it’s straightforward to estimate the current price that would be consistent with that required rate of return. As I’ve detailed in numerous recent comments (see, for example, All Their Eggs in Janet’s Basket), the most historically reliable valuation measures currently suggest a negative nominal total return for the S&P 500 over the coming decade. Our concept of “market action” captures a broad range of market behavior, including not only the uniformity and divergence of individual stocks, industries, sectors, and security types (what I often call “market internals”), but also trading volume (e.g. “accumulation” and “distribution” measures), extremes in the extent and duration of prevailing trends (e.g. “overbought” and “oversold” measures), and other indicators based on data generated by the trading process. Undoubtedly the most difficult aspect of the half-cycle market advance since 2009 has been this: in prior market cycles across history, a combined syndrome of overvalued, overbought, overbullish conditions was typically accompanied or closely followed by deterioration in market internals. Quantitative easing did one thing to make the half-cycle since 2009 legitimately “different”: it repeatedly and deliberately encouraged continued yield-seeking speculation regardless of those overvalued, overbought, overbullish extremes. From the standpoint of longer-term financial stability, it has been the most reckless central bank policy in history, however glorious it has been for speculators in the shorter run. Yet if one carefully examines the data, stocks have lost value, even since 2009, in periods where market internals have been unfavorable. Those of you who have followed these missives for a long time know much of our vocabulary by heart. It is the same vocabulary, and the same considerations, that enabled the rather striking success of our discipline prior to 2009. My decision to stress-test our methods of classifying market return/risk profiles against Depression-era data in 2009, after a financial crisis that we had fully anticipated, led to a glaring stumble during the recent bull market advance. Put simply, based on a century of prior evidence, the resulting methods encouraged us to take a hard-defensive outlook immediately as an overvalued, overbought, overbullish syndrome emerged. QE intentionally encouraged speculation, introducing a long delay between the emergence of overbought extremes and the subsequent breakdown in market internals. Since 2009 the market has lost ground, on average, only when market internals have actually become unfavorable. It is precisely that exception that establishes the rule: In the face of extreme overvalued, overbought, overbullish conditions, one can be neutral, but one should not adopt a strongly negative market outlook until market internals actually deteriorate. So how should investors “thin-slice” the most critical information from the avalanche of data and opinion that constantly crashes toward them? In my view, the essential considerations are what I call the Iron Law of Valuation and the Iron Law of Speculation. I can repeat these a million times, and the beauty is that we’ll still have them all to ourselves. Believe me, it doesn’t matter that I anticipated the 2000-2002 and 2007-2009 collapses. It doesn't matter that those collapses wiped out the entire total return of the S&P 500, over-and-above Treasury bill returns, all the way back to May 1996 and June 1995, respectively. It doesn’t matter that I’ve become constructive or even leveraged after each bear market decline in the past quarter century (including late-October 2008 after the market had collapsed by more than 40%, though my insistence on stress-testing later interrupted that shift). It doesn’t matter that I’ve admitted my own stumble in this half-cycle, and addressed it in a way that can be validated in market cycles across history. It doesn’t matter that our present methods are realigned with the same elements that drove our success prior to 2009. The fact is that it will require the completion of the current market cycle to restore our prior credibility. By then, I expect the market damage will be done, and valuations and market action will be encouraging a constructive shift, with the major indices at half the level that could be realized by exiting now. A diagonal market trend makes investors believe that no other outcome is possible. If market internals were favorable here, I’d be more sympathetic to that hope. At present, every nerve of investors should be twitching like a downed power line. In the shortest possible form, here are the Iron Laws:
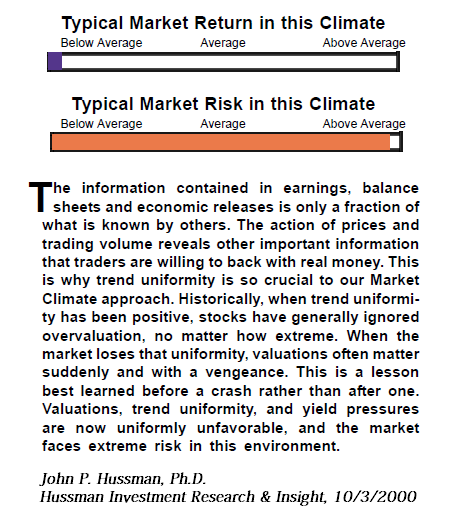
To fully encourage your sense of deja-vu, the following is clipped from my October 3, 2000 commentary in Hussman Investment Research & Insight, a few weeks after our measures of market action turned negative. It details a lesson that I admittedly had to learn twice in my investment career as a result of that stress-testing stumble. I strongly encourage investors to learn it once, learn it permanently, and teach it to your children.
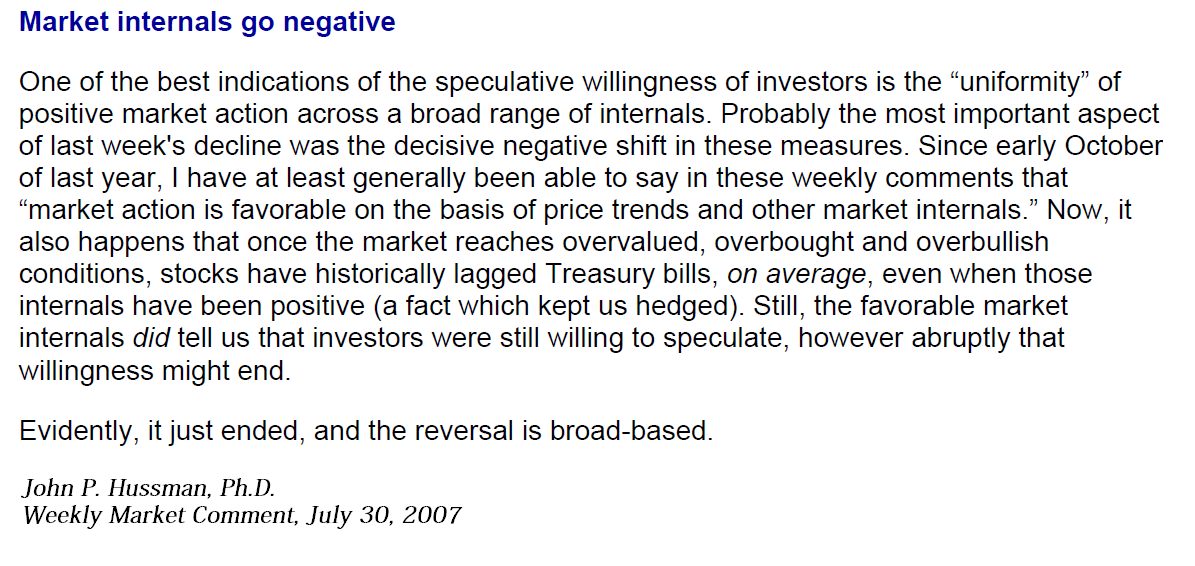
Lest we forget the setup to the worst financial collapse since the Great Depression, it will also be useful to revisit similar considerations I emphasized at the 2007 market peak. What’s fascinating to me is how unwilling investors will be to recognize any of this until the third speculative bubble in 15 years collapses again over the completion of this cycle.
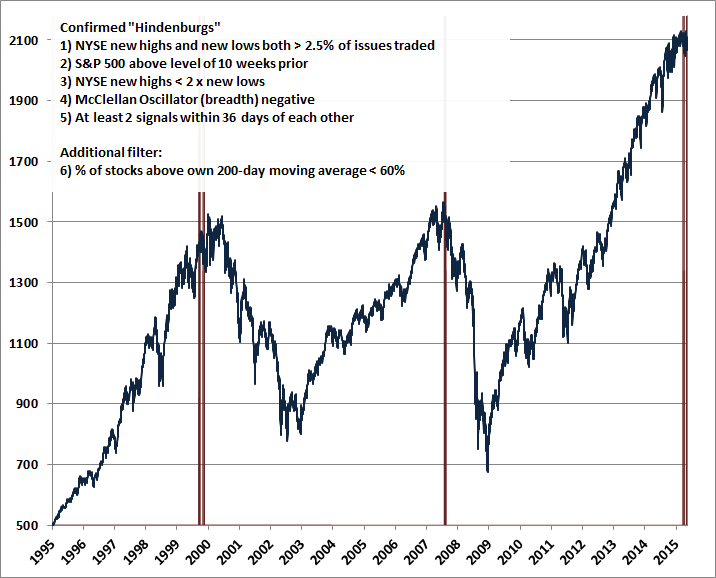
When Hindenburg Omens are Ominous I’ve frequently noted that Hindenburg “Omens” in their commonly presented form (NYSE new highs and new lows both greater than 2.5% of issues traded) appear so frequently that they have very little practical use, especially when they occur as single instances. While a large number of simultaneous new highs and new lows is indicative of some amount of internal dispersion across individual stocks, this situation often occurs in markets that have been somewhat range-bound. Still, when we think of market “internals,” the number of new highs and new lows can contribute useful information. To expand on the vocabulary we use to talk about internals, “leadership” typically refers to the number of stocks achieving new highs and new lows; “breadth” typically refers to the number of stocks advancing versus declining in a given day or week; and “participation” typically refers to the percentage of stocks that are advancing or declining in tandem with the major indices. The original basis for the Hindenburg signal traces back to the “high-low logic index” that Norm Fosback created in the 1970’s. Jim Miekka introduced the Hindenburg as a daily rather than weekly measure, Kennedy Gammage gave it the ominous name, and Peter Eliades later added several criteria to reduce the noise of one-off signals, requiring additional confirmation that amounts to a requirement that more than one signal must emerge in the context of an advancing market with weakening breadth. Those refinements substantially increase the usefulness of Hindenburg Omens, but they still emerge too frequently to identify decisive breakdowns in market internals. However, one could reasonably infer a very unfavorable signal about market internals if leadership, breadth, and participation were all uniformly negative at a point where the major indices were still holding up. Indeed, that’s exactly the situation in which a Hindenburg Omen becomes ominous. The chart below identifies the small handful of instances in the past two decades when this has been true.
While the measures of market internals that we use in practice are far more comprehensive, the evidence from leadership, breadth and participation above provides a fairly obvious signal of internal dispersion in the market. In our view, that dispersion is a strong indication that investors are shifting toward greater risk aversion. In an obscenely overvalued market with razor-thin risk premiums, a shift in the risk-preferences of investors has historically been the central feature that distinguishes a bubble from a collapse. In my view, dismal market returns over the coming decade are baked in the cake as a result of extreme overvaluation at present. An improvement in market internals, however, would reduce the immediacy of our downside concerns. While a decision by the Federal Reserve to postpone the first interest rate hike might prompt a shift to more risk-seeking speculation, this outcome is not assured. The key indicator of risk-seeking would still be the behavior of market internals directly, not the words or behavior of the Fed. So we remain focused on market internals. In any event, waiting to normalize monetary policy may defer, but cannot avoid, a market collapse that is already baked in the cake. The Fed has only encouraged the completion of the current market cycle to begin from a more extreme peak. As we saw in 2000-2002 and again in 2007-2009, until and unless investors shift toward risk-seeking, as evidenced by the behavior of market internals, monetary easing may have little effect in slowing down a collapse. The foregoing comments represent the general investment analysis and economic views of the Advisor, and are provided solely for the purpose of information, instruction and discourse. Please see periodic remarks on the Fund Notes and Commentary page for discussion relating specifically to the Hussman Funds and the investment positions of the Funds. --- The foregoing comments represent the general investment analysis and economic views of the Advisor, and are provided solely for the purpose of information, instruction and discourse. Prospectuses for the Hussman Strategic Growth Fund, the Hussman Strategic Total Return Fund, the Hussman Strategic International Fund, and the Hussman Strategic Dividend Value Fund, as well as Fund reports and other information, are available by clicking "The Funds" menu button from any page of this website. |
|||||||||||||||||||||||||
|
For more information about investing in the Hussman Funds, please call us at
1-800-HUSSMAN (1-800-487-7626) 513-326-3551 outside the United States Site and site contents © copyright Hussman Funds. Brief quotations including attribution and a direct link to this site (www.hussmanfunds.com) are authorized. All other rights reserved and actively enforced. Extensive or unattributed reproduction of text or research findings are violations of copyright law. Site design by 1WebsiteDesigners. |