|
|
||||||
|
|

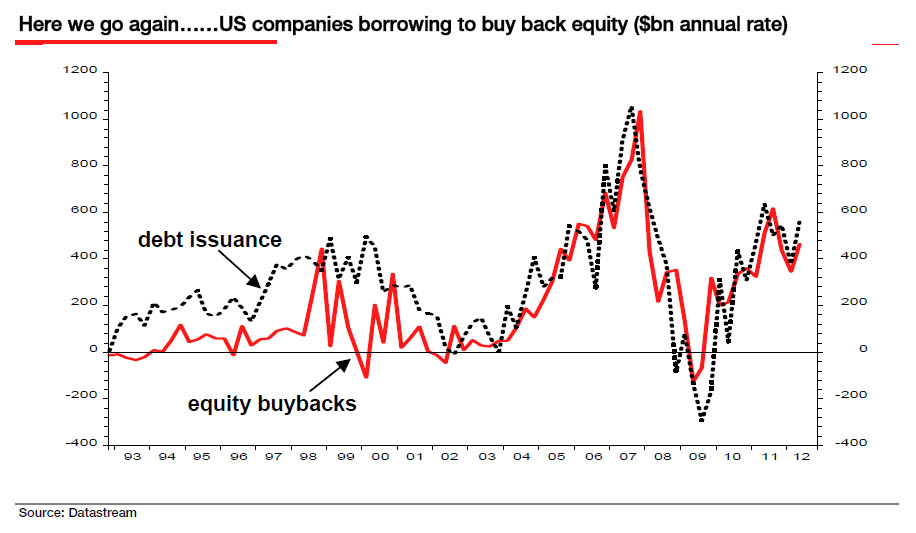
August 17, 2015 Debt-Financed Buybacks Have Quietly Placed Investors On Margin “The way to wealth in a bull market is debt. The way to oblivion in a bear market is also debt, and nobody rings a bell.” When corporations and even developing countries experience debt crises, one of the primary means of restructuring is the debt-equity swap. This sort of transaction involves canceling out debt of the company or government in return for equity of the company, or privatization of some of the assets of the country. Corporate debt-equity swaps typically result in severe dilution of the equity claims of existing shareholders, and in some cases, can wipe those claims out as creditors take control of the company. At a national level, debt-equity swaps can take a punitive form that forces countries to privatize and sell off their assets in satisfaction of their debts. Aside from austerity demands, one of the most severe outcomes of the ongoing saga in Greece is the demand for exactly that kind of debt restructuring. The opposite of a debt-equity swap, of course, is a debt-financed stock repurchase, which leverages up the claims of existing shareholders. One of the more troubling aspects of the Federal Reserve’s suppression of interest rates is the speculation it has encouraged, by giving companies access to enormously cheap funding on a 5-7 year horizon. Though nominal economic growth has been tepid, revenue growth has turned negative, and profits as a share of GDP have been falling for more than a year, companies have scampered to boost their per-share earnings by taking out debt to repurchase and reduce the number of shares outstanding. This leveraging has been done at market valuations that are near the highest levels in history on historically reliable measures. See, the timing of buybacks at an aggregate level has nothing to do with value. As Albert Edwards at SocGen has often observed, not only do buybacks increase at rich market valuations and dry up in depressed markets, they are also typically financed by issuing debt. What drives buyback activity is not value, but the availability of cheap, speculative capital at points in the business cycle where profit margins are temporarily elevated and make the increased debt burden seem easy to handle. The chart below showed the developing situation a few years ago...
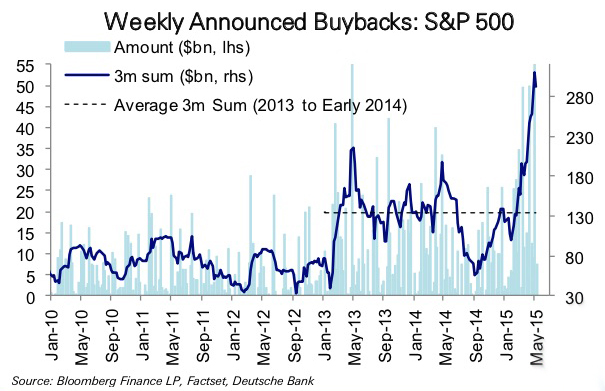
... and the chart below shows the frantic pace that repurchases have reached – at what are now the most extreme levels of valuation in U.S. history outside of a few months surrounding the 2000 market peak.
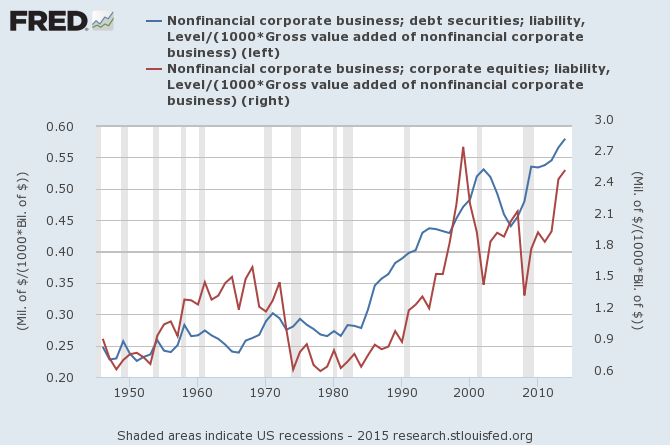
One emerging problem here is that credit spreads in corporate debt have begun to widen considerably, increasing the cost of debt, while profit margins continue (predictably) to come under pressure. Corporations tend to press their luck when it comes to buybacks, largely because profit margins tend to be deceptively high at major market peaks, but it’s difficult to maintain a high pace of repurchases when fading revenue growth and narrowing profit margins are joined by wider credit spreads. The larger problem with repurchases is that debt-financed buybacks effectively put investors on margin. As corporations have borrowed in order to aggressively buy back their stock near the highest market valuations in history, existing stockholders have quietly become heavily leveraged, without even realizing it. The first exhibit of analysts who claim that corporations are not highly leveraged is to compare the amount of debt owed by companies to the market value of corporate equities. But this is a deceptive metric because equities themselves are so extremely overpriced. Similarly, comparing the enterprise value of the company (the combined value of its stock and bond obligations) to earnings before interest, taxes, depreciation, and amortization (EBITDA) is also misleading because profit margins, despite some initial erosion, are still near record highs. We’ve emphasized that the most reliable valuation metrics we identify are based not on earnings but on measures such as revenue, GDP and corporate gross value added, all of which essentially suppress the cyclical impact of profit margin fluctuations. Among these, the single most reliable variant is Market Cap/GVA, which has a correlation of roughly 92% with actual subsequent S&P 500 10-year total returns. Over the long term, it is gross value added that provides the fundamental basis for cash flows that will be delivered to stockholders and bondholders over time. Comparing both equity market capitalization and corporate debt obligations to GVA offers a reasonable indication as to how leveraged corporate securities have become, relative to the top-line driver that is ultimately responsible for providing long-term returns to investors.
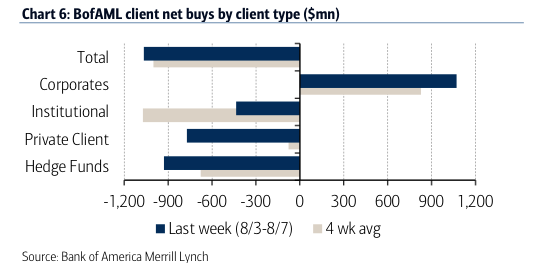
So not only is the equity market at the second most overvalued point in U.S. history, it is also more leveraged against probable long-term corporate cash flows than at any previous point in history. As we observed during the housing bubble, yield-seeking by investors opens the door to every form of malinvestment. The best way to create a debt-financed wave of speculative and unproductive activity is to starve investors of safe return. In 2000 that wave of speculation focused on technology. The next Fed-induced wave of speculation focused on mortgage securities, which financed a housing bubble. In our view, the primary avenue of speculation in the current cycle has been debt-financed corporate equity purchases. Over the completion of this cycle, we fully expect that many companies and private-equity firms will be forced to reverse this activity through involuntary debt-equity swaps, with a corresponding dilution in the ownership stakes of existing shareholders. Indeed, the group that led the largest-ever leveraged buyout in the oil and gas sector in 2011 announced last week that its ownership stake would be handed over to lenders. Back in 2011, profit margins were elevated in the energy sector, making the new debt burdens seem easy to handle. But part of the signature of an emerging global economic slowdown has been pressure on energy and industrial commodity prices (see the February 2, 2015 comment, Market Action Suggests an Abrupt Slowing in Global Economic Activity). The grandiose leveraged buy-outs of 2011, now facing Chapter 11, are the canaries in the global economic coal mine. In the words of Bad Company, “It ain’t the first time baby... baby it won’t be the last.” In the short run, however, as the characters in the LEGO movie would sing, “Everything is awesome.” Despite extreme valuations and clearly deteriorating market internals, price-insensitive corporate stock repurchases have represented the last remaining source of support for the stock market. BofAML provides an instructive chart of recent net equity purchases by client type. The same sort of concentrated corporate buying was likely responsible for Wednesday’s stick-save rebound after the S&P 500 broke below its 200-day moving average.
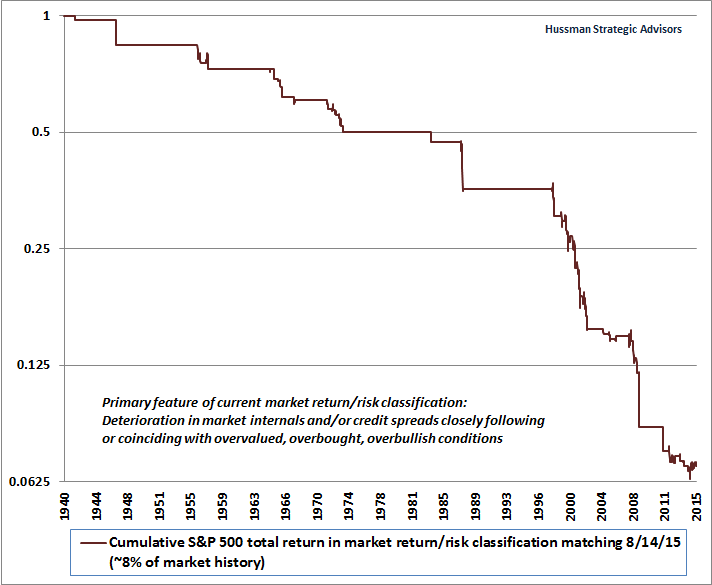
While this sort of action may seem encouraging, it actually places existing shareholders in an even more highly levered position. As in prior waves of corporate repurchases at market peaks, this activity will burn itself out – particularly if credit spreads continue to widen. Investors should remember from the 2000-2002 and 2007-2009 collapses that the market can become extremely unpleasant when sellers stop being able to find willing buyers at nearby prices. Our market outlook remains highly defensive here. While our immediate downside concerns would become less pointed if market internals and credit spreads were to improve, we presently observe a breakdown in market internals and a widening of credit spreads, following an extended period of extreme overvalued, overbought, overbullish conditions. The current set of conditions has been observed in only about 8% of market history, and that 8% of history captures the only set of conditions that we associate with expected and severe market losses. Another 32% of market history is associated with relatively flat expected returns and risks sufficient to encourage a partially or fully-hedged position. The remaining 60% of historical market conditions are associated with an expected return/risk profile strong enough to encourage an aggressive or leveraged market outlook. It's the 8% of history that matches current conditions where most market crashes have occurred. The chart below shows the cumulative total return of the S&P 500 restricted to this subset of history. The chart is on log scale, so each horizontal line represents a 50% loss. The vertical lines straight down are actually 2-3 week air pockets, free-falls and crashes where stocks experienced losses of as much as 25%, often with continued (but less predictable) follow-on losses after exiting this particular return/risk profile. The past several months appear as a little congestion area in the lower right of the graph. Investors should emphatically not rule out progressive losses – even a straight line down – under present conditions.
In any event, it's not necessary to make forecasts. It is enough to align our outlook with prevailing conditions, and shift that outlook when conditions shift. There’s no point in fretting over whether or not the economy will roll into a recession, or whether the Fed will tighten, avoid tightening, or even launch another round of QE. Whatever actions the Fed may take are likely to have their impact on stocks by encouraging (or failing to encourage) risk-seeking by investors. What matters most is to focus directly on valuations and the risk-preferences of investors, as conveyed by the behavior of market internals and credit spreads. Presently, observable market conditions are associated with the most negative expected return/risk profile we identify, and our stance is aligned accordingly. Our stance will change as those conditions shift. The foregoing comments represent the general investment analysis and economic views of the Advisor, and are provided solely for the purpose of information, instruction and discourse. Please see periodic remarks on the Fund Notes and Commentary page for discussion relating specifically to the Hussman Funds and the investment positions of the Funds. --- The foregoing comments represent the general investment analysis and economic views of the Advisor, and are provided solely for the purpose of information, instruction and discourse. Prospectuses for the Hussman Strategic Growth Fund, the Hussman Strategic Total Return Fund, the Hussman Strategic International Fund, and the Hussman Strategic Dividend Value Fund, as well as Fund reports and other information, are available by clicking "The Funds" menu button from any page of this website. |
|||||||||||||||||||||||||
|
For more information about investing in the Hussman Funds, please call us at
1-800-HUSSMAN (1-800-487-7626) 513-326-3551 outside the United States Site and site contents © copyright Hussman Funds. Brief quotations including attribution and a direct link to this site (www.hussmanfunds.com) are authorized. All other rights reserved and actively enforced. Extensive or unattributed reproduction of text or research findings are violations of copyright law. Site design by 1WebsiteDesigners. |