|
|
||||||
|
|

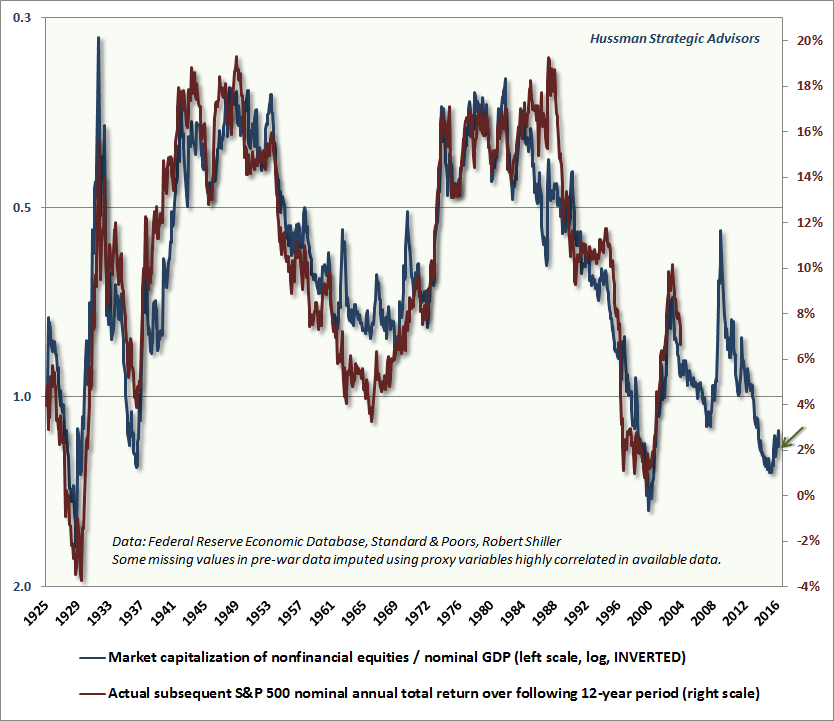
April 11, 2016 Rounding the Bubble's Edge The single most important quality that investors can have, at present, is the ability to maintain a historically-informed perspective amid countless voices chanting “this time is different” and arguing that long-term investment returns have no relationship to the price that one pays. From a long-term, historically-informed investment perspective, the S&P 500 remains obscenely overvalued on valuation measures most closely correlated with actual subsequent market returns (and that have remained tightly correlated with actual market returns even in recent cycles). We estimate that S&P 500 nominal annual total returns will average only about 0-2% on a 10-12 year horizon, with negative expected real returns after inflation. From a cyclical perspective, we continue to expect the S&P 500 to retreat by about 40-55% over the completion of the current market cycle; an outcome that we would view as run-of-the-mill and that would in no way represent a worst-case scenario. Every market cycle in history has drawn valuations toward or below levels consistent with expectations of 10% nominal annual returns over a 10-12 year horizon. This includes cycles prior to the 1960’s when interest rates regularly visited levels similar to the present. Those two perspectives, in combination, mean that we expect the market to go nowhere for more than a decade, but to go nowhere in a distressing way that includes steep interim losses. This is really no different than the expectations I expressed at the 2000 and 2007 market peaks, based on similar valuation arithmetic. Of course, in order to get to zero 10-12 year returns, steep interim losses must also be followed by substantial gains. In my view, the best way for investors to achieve strong returns in the S&P 500 over the coming 10-12 years is to wait for the rain, and torrential rain at that. In post-war data, we find 10-12 year S&P 500 total returns best correlated with the ratio of market capitalization to corporate gross value added. However, we complement this with numerous other measures, including conventional ones (precisely because they are followed by others, though we do take account of their respective shortfalls). For a very long-term perspective, the ratio of market capitalization to GDP is useful because of the ability to impute estimated pre-war values using related economic data. The chart below is sufficient to summarize the long-term relationship between valuations and expected subsequent market returns. The completion of every market cycle has been associated with a plunge in valuations and a spike in prospective long-term returns. The present situation offers long-term investors very little for the risk they assume. That will change.
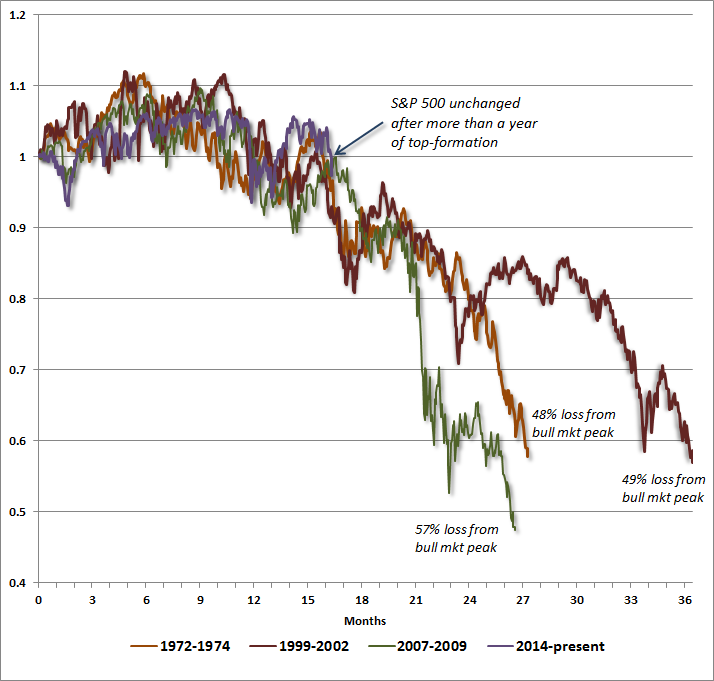
From an intermediate-term perspective, the U.S. equity market continues to trace out an arc that we view as the rounded top-formation of the third speculative bubble in 16 years. The S&P 500 is presently at the same level it set in November 2014, and the broad NYSE composite is at the same level it set in November 2013. I’ve frequently emphasized that, with a few exceptions such as 1987, most market peaks are a process, not an event. While we have to be alert for the potential for steep, vertical losses, a historically-informed understanding of this process demands that investors be patient, and refrain from placing too much faith in what I’ve often called the “fast, furious, prone-to-failure” advances that occasionally clear oversold conditions. Visualizing this process of top-formation from a historical standpoint provides a useful reminder that even the worst bear market retreats across history were generally preceded by quite an extended period of choppy sideways market action. The following chart was suggested by Bill Hester based on a commentary by Owen Williams. It shows daily S&P 500 data from 1972-1974, 2000-2002, 2007-2009, and the period since late-2014. The version below differs a bit in that it sets the origin to capture the whole top formation, rather than starting from the exact top itself. The chart isn’t intended as a forecast of any sort, but is instead a reminder that the kind of market action we’ve observed over the past year is consistent with what has regularly been observed in other contexts where valuations were extreme and tepid market internals suggested growing risk-aversion among investors. Each instance included a long period of choppy top-formation over which the market was essentially unchanged.
If one thing in the advancing half-cycle since 2009 has been legitimately “different,” it’s this: in the face of zero-interest policy, even extreme “overvalued, overbought, overbullish” conditions, which were reliably negative for stocks in prior cycles across history, weren’t sufficient to stop investors from speculating in recent years. Before adopting a hard-negative market outlook, one had to wait for explicit deterioration in market internals across a broad range of individual stocks, industries, sectors, and security types, including debt securities of varying creditworthiness. We view market internals as the central consideration in distinguishing overvalued markets that tend to continue higher from overvalued markets that collapse, and we introduced adaptations to our own approach in mid-2014 to better reflect that importance (see the Box in The Next Big Short for the full narrative). Even if “this time is different,” we don’t expect it will be different enough to sustain valuations at current obscene levels in the absence of favorable market internals. We can’t rule out a fresh shift back to the kind of speculative yield-seeking that dominated investor behavior earlier in this cycle, but we’ll take that cue directly from market internals. In any event, we doubt that fresh speculation would be sustained for long, so any constructive view on that basis would demand a tight safety net. For investors optimistic enough to reject the idea that the market is doomed to suffer extreme valuations and dismal expected returns forever, the completion of this cycle is likely to offer numerous opportunities to act on that optimism, at far higher prospective returns than are currently available. With respect to the near-term, my views aren’t very pointed here, though as I noted last week, I do believe "tail risk" is increasing. In recent weeks, I’ve maintained a neutral near-term market outlook because of improvement in various trend-following measures, though broad internals still don’t support the view that investors have shifted to the kind of persistent risk-seeking behavior that we observed prior to mid-2014. Last week, there was enough deterioration in momentum measures to chip away at the technical picture, throwing near-term conditions to a somewhat negative outlook, overall. That negative outlook would harden substantially on a break below about 1975 on the S&P 500. Purely as something to monitor, my impression is that any sustained break below the widely-followed 200-day moving average (presently about 2014 simple and 2008 exponential) could contribute to exit attempts by trend-followers. Even here, 56% of individual stocks remain below their own respective 200-day averages. Regardless of near-term technical factors, however, the most important consideration here is that extreme valuations continue to be joined by relatively poor market internals, which introduces negative skew and a fat left tail into the likely distribution of returns. Put differently, even if short-term market behavior appears relatively stable, one should be prepared for steep losses that may emerge, if history is any guide, seemingly out-of-the-blue.The foregoing comments represent the general investment analysis and economic views of the Advisor, and are provided solely for the purpose of information, instruction and discourse. Please see periodic remarks on the Fund Notes and Commentary page for discussion relating specifically to the Hussman Funds and the investment positions of the Funds. --- The foregoing comments represent the general investment analysis and economic views of the Advisor, and are provided solely for the purpose of information, instruction and discourse. Prospectuses for the Hussman Strategic Growth Fund, the Hussman Strategic Total Return Fund, the Hussman Strategic International Fund, and the Hussman Strategic Dividend Value Fund, as well as Fund reports and other information, are available by clicking "The Funds" menu button from any page of this website. |
|||||||||||||||||||||||||
|
For more information about investing in the Hussman Funds, please call us at
1-800-HUSSMAN (1-800-487-7626) 513-326-3551 outside the United States Site and site contents © copyright Hussman Funds. Brief quotations including attribution and a direct link to this site (www.hussmanfunds.com) are authorized. All other rights reserved and actively enforced. Extensive or unattributed reproduction of text or research findings are violations of copyright law. Site design by 1WebsiteDesigners. |