|
|
||||||
|
|

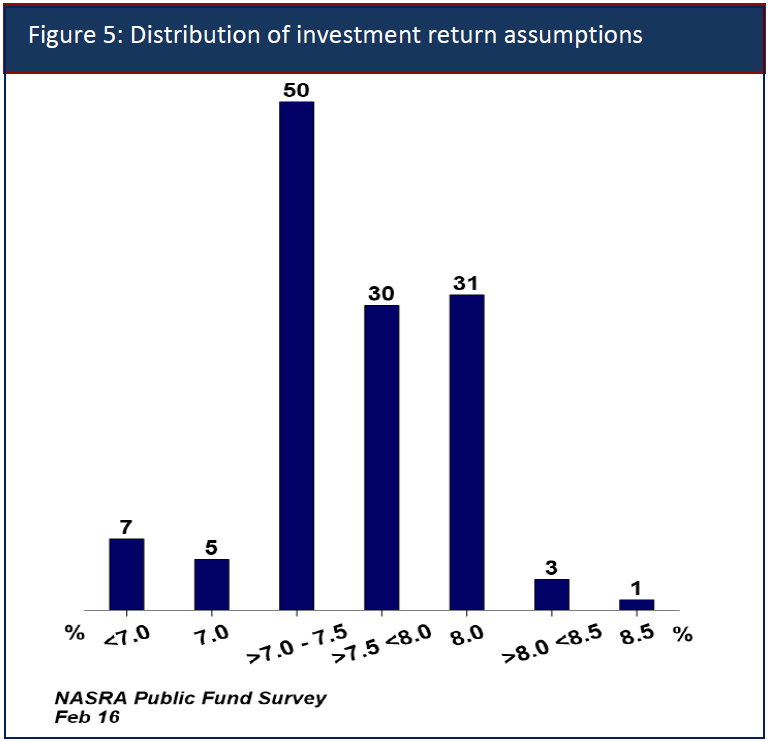
May 23, 2016 The Coming Fed-Induced Pension Bust Last week, I observed that based on the most reliable measures we identify (those having the strongest correlation with actual subsequent 10-12 year investment returns across history as well as in recent cycles), “the expected return on a traditional portfolio mix is actually lower at present than at any point in history except the 1929 and 1937 market peaks. QE has effectively front-loaded realized past returns, while destroying the future return prospects of conventional portfolios, at least as measured from current valuations. As a result, the coming years are likely to see a major pension crisis across both corporations and municipalities because the illusory front-loading of returns has encouraged profound underfunding.” On Thursday, Chicago’s Municipal Employees Annuity and Benefit Fund reported that its net pension liability soared to $18.6 billion, from $7.1 billion a year earlier, as a result of new accounting rules that prevent governments from using aggressive investment return assumptions (thanks to my friend Mike Shedlock for his post on this news). But here’s the kicker - the rules only apply after pension funds go broke. In Chicago’s case, pension return assumptions had been optimistically set at 7.5%, and the city had vastly underfunded its obligations. Still, this isn’t a Chicago problem. It’s a national, even global problem, and it’s going to get much worse. See, Chicago’s assumptions were actually below the national 7.62% average. The following chart is from the National Association of State Retirement Administrators (NASRA). Chicago is essentially the rule, not the exception.
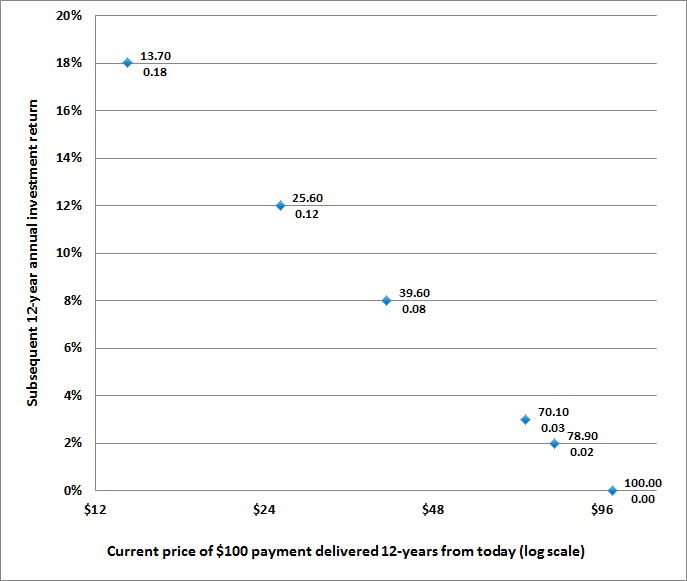
These return assumptions effectively guarantee a widespread crisis in already underfunded state, corporate, and municipal pensions in the coming decade. This underfunding has resulted from a failure to appreciate the links between reliable valuation measures, realized past returns, and prospective future returns. To understand this problem, let’s begin by considering the following chart. It’s a graphic version of the thought-experiment in last week’s market comment. Imagine paying some amount today in return for a $100 bill 12 years from now. The chart shows the 12-year annual return you will earn, based on how much you pay today. The higher the price you pay for a given set of future cash flows, the lower the long-term return you can expect. Notice that the horizontal axis is on log scale, which is what makes the relationship linear. Each point is labeled: paying $13.70 gets you an 18% 12-year return, paying $25.60 gets you a 12% return, paying $39.60 gets you an 8% return, and so forth.
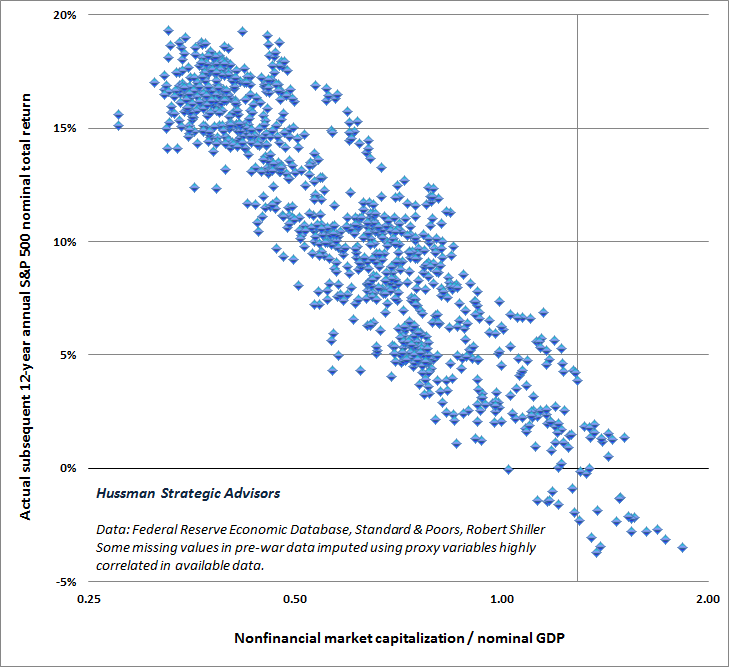
As one gradually raises today's price from $13.70 to $100, the prospective 12-year return drops from 18% annually to zero. The central lesson here isn’t only that rich valuations imply poor long-term returns. It’s also that every increase in valuation converts expected future returns into realized past returns: “The exercise you just did is the single most important thing to understand about long-term investing. I’ve often called it the Iron Law of Valuation: the higher the price you pay today for a given stream of future cash flows, the lower your rate of return over the life of the investment. As the price goes up, what investors considered “expected future return” only a moment before is suddenly converted into “realized past return.” The higher the current price rises, the more expected future returns are converted into realized past returns, and the less expected future return is left on the table. Notice that the point where a security seems most enticing on the basis of realized past returns is also the point where the security is least promising on the basis of expected future returns.” Blowing Bubbles: QE and the Iron Laws, Hussman Weekly Market Comment, 5/16/16 Next, let’s generalize this example to real financial markets. In market cycles across history, the valuation measures most reliably correlated with actual subsequent stock market returns are those that mute the impact of cyclical fluctuations in profit margins (see Margins, Multiples, and the Iron Law of Valuation). These measures are linked to subsequent returns in very much the same way as in our simple thought-experiment. The chart below presents the ratio of nonfinancial market capitalization / nominal GDP on log-scale, versus actual subsequent S&P 500 12-year nominal annual total returns in data since 1926.
Note that although low interest rates may encourage yield-seeking speculators to drive stock market valuations to extremes, those rich valuations, in turn, are associated with low subsequent market returns. This is precisely what one should expect when investors respond to zero interest rates by driving valuations on risky assets to obscene levels: realized past returns are amplified for a period of time, but expected future returns are driven toward zero. The chart below presents estimated 10-year returns on a conventional asset mix (60% stocks, 30% bonds, 10% Treasury bills) versus actual historical returns on that mix. We would obtain the tightest historical relationship by using a 12-year horizon (the period over which the autocorrelation of valuations decays to zero) and by estimating S&P 500 total returns using MarketCap/GVA, but the version below offers a more standard rule-of-thumb and a longer data set. We currently estimate that the total return on a conventional portfolio mix of stocks, bonds and Treasury-bills is likely to average scarcely 1.5% annually over the coming decade. Ironically, however, the advance to extreme valuations (and correspondingly poor long-term return prospects) has encouraged pension administrators to underfund future liabilities, on the belief that high realized past returns are representative of future outcomes.
I should point out that there are a few “outliers” in the S&P 500 return estimates. For example, S&P 500 total returns in the 10-year period following 1988-1990 significantly exceeded estimated returns, due to a bubble that brought equity valuations at the end of that 10-year period (1998-2000) to the highest levels in history. There’s a smaller outlier in 2005 corresponding to the valuation extreme a decade later in 2015. Conversely, S&P 500 total returns in the 10-year period following 1964 and 1972 were much weaker than one would have estimated, owing to a market collapse that brought valuations to deep secular lows in 1974 and 1982. That said, to rely on portfolio returns much different than these estimates is essentially to rely on an obscene bubble or deep secular low a decade from now. Notice that between 1980 and 1991, the financial markets were priced to deliver significantly above-average long-term returns for a conventional portfolio mix. As the late-1990’s tech bubble unfolded, much of this expected future return was converted to realized past return, leaving little on the table for long-term investors. Indeed, at the 2000 market peak, I estimated that the S&P 500 was priced for negative expected 10-year total returns, even on the basis of optimistic assumptions. Still, because 10-year bond yields were near 6.5%, investors at least had other conventional investment options available. The 2002 and 2009 bear market lows restored long-term return prospects to some extent, but the stronger prospective equity market returns were joined by rather meager bond yields, so prospective returns on the overall mix were restrained. At present, years of relentless quantitative easing by the Federal Reserve have driven equity valuations to the point where prospective 10-12 year S&P 500 total returns are just 0-2% by our estimates, while Treasury yields are also below 2% and Treasury bill yields are only a fraction of a percent. The combination brings the expected return on this portfolio mix to the lowest level in history outside of the valuation extremes of 1929, 1937, and 2000. Yet, because investors and policy-makers seem incapable of distinguishing realized past returns from expected future returns, they fail to see the danger in this situation. Recall, as I detailed last week, that real "wealth" is not inherent in the price of a security, but in the stream of cash flows it delivers over time, and the value-added production that generates those cash flows. The only way for you to spend out of the paper "wealth" of an overvalued security is by selling it to someone else and letting them hold the bag. By encouraging a sense of illusory, paper wealth, all the Fed has done is to discourage saving, and by extension, real investment (which in equilibrium must be identical to saving). Because of the Fed's singular focus on punishing saving and encouraging debt-financed consumption, growth in real gross private domestic investment in the U.S. has collapsed in the past 16 years, growing at less than 1.0% annually since 2000, compared with 4.6% annually in the preceding half-century. Put another way, the Fed has encouraged the illusion of paper wealth while simultaneously destroying the capacity of the U.S. to produce real wealth. All of this is tied together: zero interest rate policy, speculative yield-seeking, pension underfunding, financial bubbles, malinvestment, crisis, and economic stagnation. The intentional distortions created by wholly experimental monetary policy carry a great deal of responsibility for these outcomes. The global financial economy has been pushed to such reckless speculative extremes that the ability of this house of cards to survive even a quarter point increase in short-term interest rates is a subject of serious and uninterrupted debate. The Fed has done enormous violence to the public, and to the underlying stability of the financial markets, not only by encouraging a reckless yield-seeking financial bubble as the response to a global financial crisis that resulted from the previous Fed-induced yield-seeking bubble; not only by driving the financial markets to the point where poor long-term returns and wicked interim losses are inevitable (the same dangers investors faced at the 2000 and 2007 peaks); but also by creating an environment where scarce savings have been increasingly diverted to speculative activities, and where pensions have been encouraged to underfund their liabilities in the belief that past realized returns are indicative of future outcomes. Savings and umbrellas Despite the dismal 10-12 year prospects for conventional portfolios, we strongly encourage investors to continue to save in a disciplined way, but nothing forces investors to allocate these funds to speculative asset classes. I expect the S&P 500 to lose about 40-55% over the completion of this cycle, which would be only a run-of-the-mill outcome from a historical perspective, given current valuation extremes. It’s unfortunate that prospective returns on traditionally rewarding asset classes have been driven to zero, and it may be uncomfortable to park savings in safe but low-return investments, hedged equity, and the like. Still, I strongly encourage investors to continue a disciplined saving program, even if the funds have to stay under an umbrella for a while. Market conditions will change, but the opportunity to save is always much harder to recover once it is abandoned. I never hestiate to acknowledge that my insistence on stress-testing our methods of classifying market return/risk profiles against Depression era data, following a financial crisis we fully anticipated, led to a difficult and awkward transition from 2009 until mid-2014 when those challenges were fully addressed (see the Box in The Next Big Short for the detailed narrative). But to point to our experience in this speculative period as the basis for ignoring a century of objective historical evidence is terribly misplaced, in my view. One can do what one wishes, but having addressed the challenges we faced in the half-cycle since 2009, I believe that our experience in complete market cycles prior to 2009 warrants consideration - particularly as the stock market continues to trace out an arc that appears likely to represent the top-formation of the third speculative financial bubble in 16 years. There’s very little that individual investors or pension funds - in aggregate - can do about dismal 10-12 year investment prospects, because every security that is outstanding must be held by someone until it is retired. Injuries are inevitable. Those who are sensitive to deep losses or have relatively short horizons might want to pass their risk exposure off to speculators and passive investors, and allow them to take one for the team (even if they don’t fully realize they’ve done so until it’s too late). Fortunately, as equity valuations fall, the effective duration of equities also shortens, making stocks more appropriate for investors with more moderate horizons. At a 2% dividend yield on the S&P 500, the effective duration of equities works out to about 50 years. At a more normal 4% dividend yield, the duration works out to be about 25 years. That means that an investor with a 25-year spending horizon could be comfortable being 100% in stocks at a 4% yield, but might best limit exposure to about 50% invested at a 2% index yield. That’s not market timing - that’s just duration matching. Presently, investors with short horizons or low tolerance for steep losses should reach for the available umbrellas. The Iron Law of Equilibrium here is that somebody will have to stand in the rain between now and the point where reasonable long-term return prospects are restored by a surrender of realized past returns. What’s quite unfortunate, in my view, is that the strong realized past returns of the past 25 years are now actually being taken as a justification of current, unrealistically high pension return assumptions. This, in turn, encourages continued underfunding. This inclination appears to be wholly encouraged by Federal Reserve policies, and threatens to amplify an inevitable pension crisis in the coming years. To get a full sense of the level of denial here, the following argument appeared in a February brief from the National Association of State Retirement Administrators: “Some critics of the current public pension investment return assumption levels say that current low interest rates and volatile investment markets require public pension funds to take on excessive investment risk to achieve their assumption... Although public pension funds, like other investors, experienced sub-par returns in the 2008-2009 decline in global equity markets, median public pension fund returns over a longer period exceed the assumed rates used by most plans. Specifically, the median annualized investment return for the 25-year period ended December 31, 2015 exceeds the average assumption of 7.62 percent... Over the last 25 years, a period that has included three economic recessions and four years when median public pension fund investment returns were negative, public pension funds have exceeded their assumed rates of investment return.” National Association of State Retirement Administrators, NASRA Issue Brief, February 2016 To draw an inference about future returns using investment returns over the past 25 years is to draw a line from the depressed valuations of 1990 to the obscene valuations of today, and then extrapolate it indefinitely. The realized past returns of this period have been strong precisely because they have robbed from future expected returns. The tide will turn, as it always has in complete market cycles across history, and as investors discovered during the market collapses of 2000-2002 and 2007-2009. The erasure of realized past returns will restore reasonable prospects for future investment, as other retreats have done. Meanwhile, keep saving, reach for umbrellas, fasten your seat belt, and brace for the consequences and eventual opportunities that the current recklessness will bring.The foregoing comments represent the general investment analysis and economic views of the Advisor, and are provided solely for the purpose of information, instruction and discourse. Please see periodic remarks on the Fund Notes and Commentary page for discussion relating specifically to the Hussman Funds and the investment positions of the Funds. --- The foregoing comments represent the general investment analysis and economic views of the Advisor, and are provided solely for the purpose of information, instruction and discourse. Prospectuses for the Hussman Strategic Growth Fund, the Hussman Strategic Total Return Fund, the Hussman Strategic International Fund, and the Hussman Strategic Dividend Value Fund, as well as Fund reports and other information, are available by clicking "The Funds" menu button from any page of this website. |
|||||||||||||||||||||||||
|
For more information about investing in the Hussman Funds, please call us at
1-800-HUSSMAN (1-800-487-7626) 513-326-3551 outside the United States Site and site contents © copyright Hussman Funds. Brief quotations including attribution and a direct link to this site (www.hussmanfunds.com) are authorized. All other rights reserved and actively enforced. Extensive or unattributed reproduction of text or research findings are violations of copyright law. Site design by 1WebsiteDesigners. |