
|
|
||||||
|
|

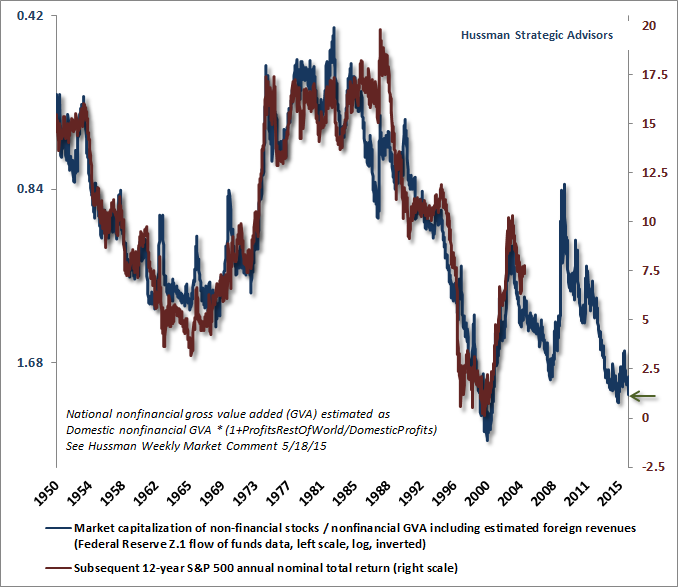
August 15, 2016 The Decade of Zero and its Chaotic Unwinding Imagine someone offers you a 10-year bond with a coupon yield (annual interest payment / face value) of 3.0%, and a current yield (annual interest payment / current price) of 2.3%. Let’s assume zero probability of default. Comparing this opportunity with the 1.5% yield-to-maturity available on 10-year Treasury bonds, would you prefer the bond “yielding” 2.3%? I’ve offered a hint by using quote marks, but if you chose the 2.3% bond anyway, you’ve joined the company of countless other investors who are making effectively the same mistake as they reach for yield across every financial asset. In order for a 10-year 3% coupon bond to provide a 2.3% current yield, one must pay $130 today in return for the following set of future cash flows: $3 a year for 10 years, plus $100 at the end. Paying $130 today in return for $130 in future cash flows, buyers of that bond will inadvertently discover that they’ve locked in a total return of zero. The error here is in using “yield” as shorthand for “expected total return on investment.” Focusing on yield alone quietly overlooks any consideration of capital loss - even when a capital loss is built into the deal. We increasingly see this error among stock market investors, as they incorrectly compare the dividend yield on stocks (annual dividend / current price) with prevailing interest rates, eliminating the “capital gain/loss” component of total return from their arithmetic (or assuming it will naturally be positive, regardless of the price one pays). Yet we know very well that valuations have reliably determined that component, in market cycles across a century of history. Indeed, the most historically reliable measures of market valuation (those with a correlation of 90% or more with actual subsequent 10-12 year market returns) currently project a likely S&P 500 nominal annual total return averaging just 0.9% over the coming 12-year period, with negative total returns at shorter horizons. As I detailed last week in Morton’s Fork, this outcome is likely to emerge almost regardless of the rate of economic growth and the level of interest rates over the coming decade. On a cyclical horizon, we continue to expect the present market cycle to be completed by a 40-55% decline in the S&P 500 Index; an outcome that would be historically run-of-the-mill from current valuations. The chart below presents the ratio of nonfinancial market capitalization to nonfinancial gross value-added, on an inverted log scale (left, blue) versus the actual subsequent 12-year S&P 500 nominal average annual total return (right, red).
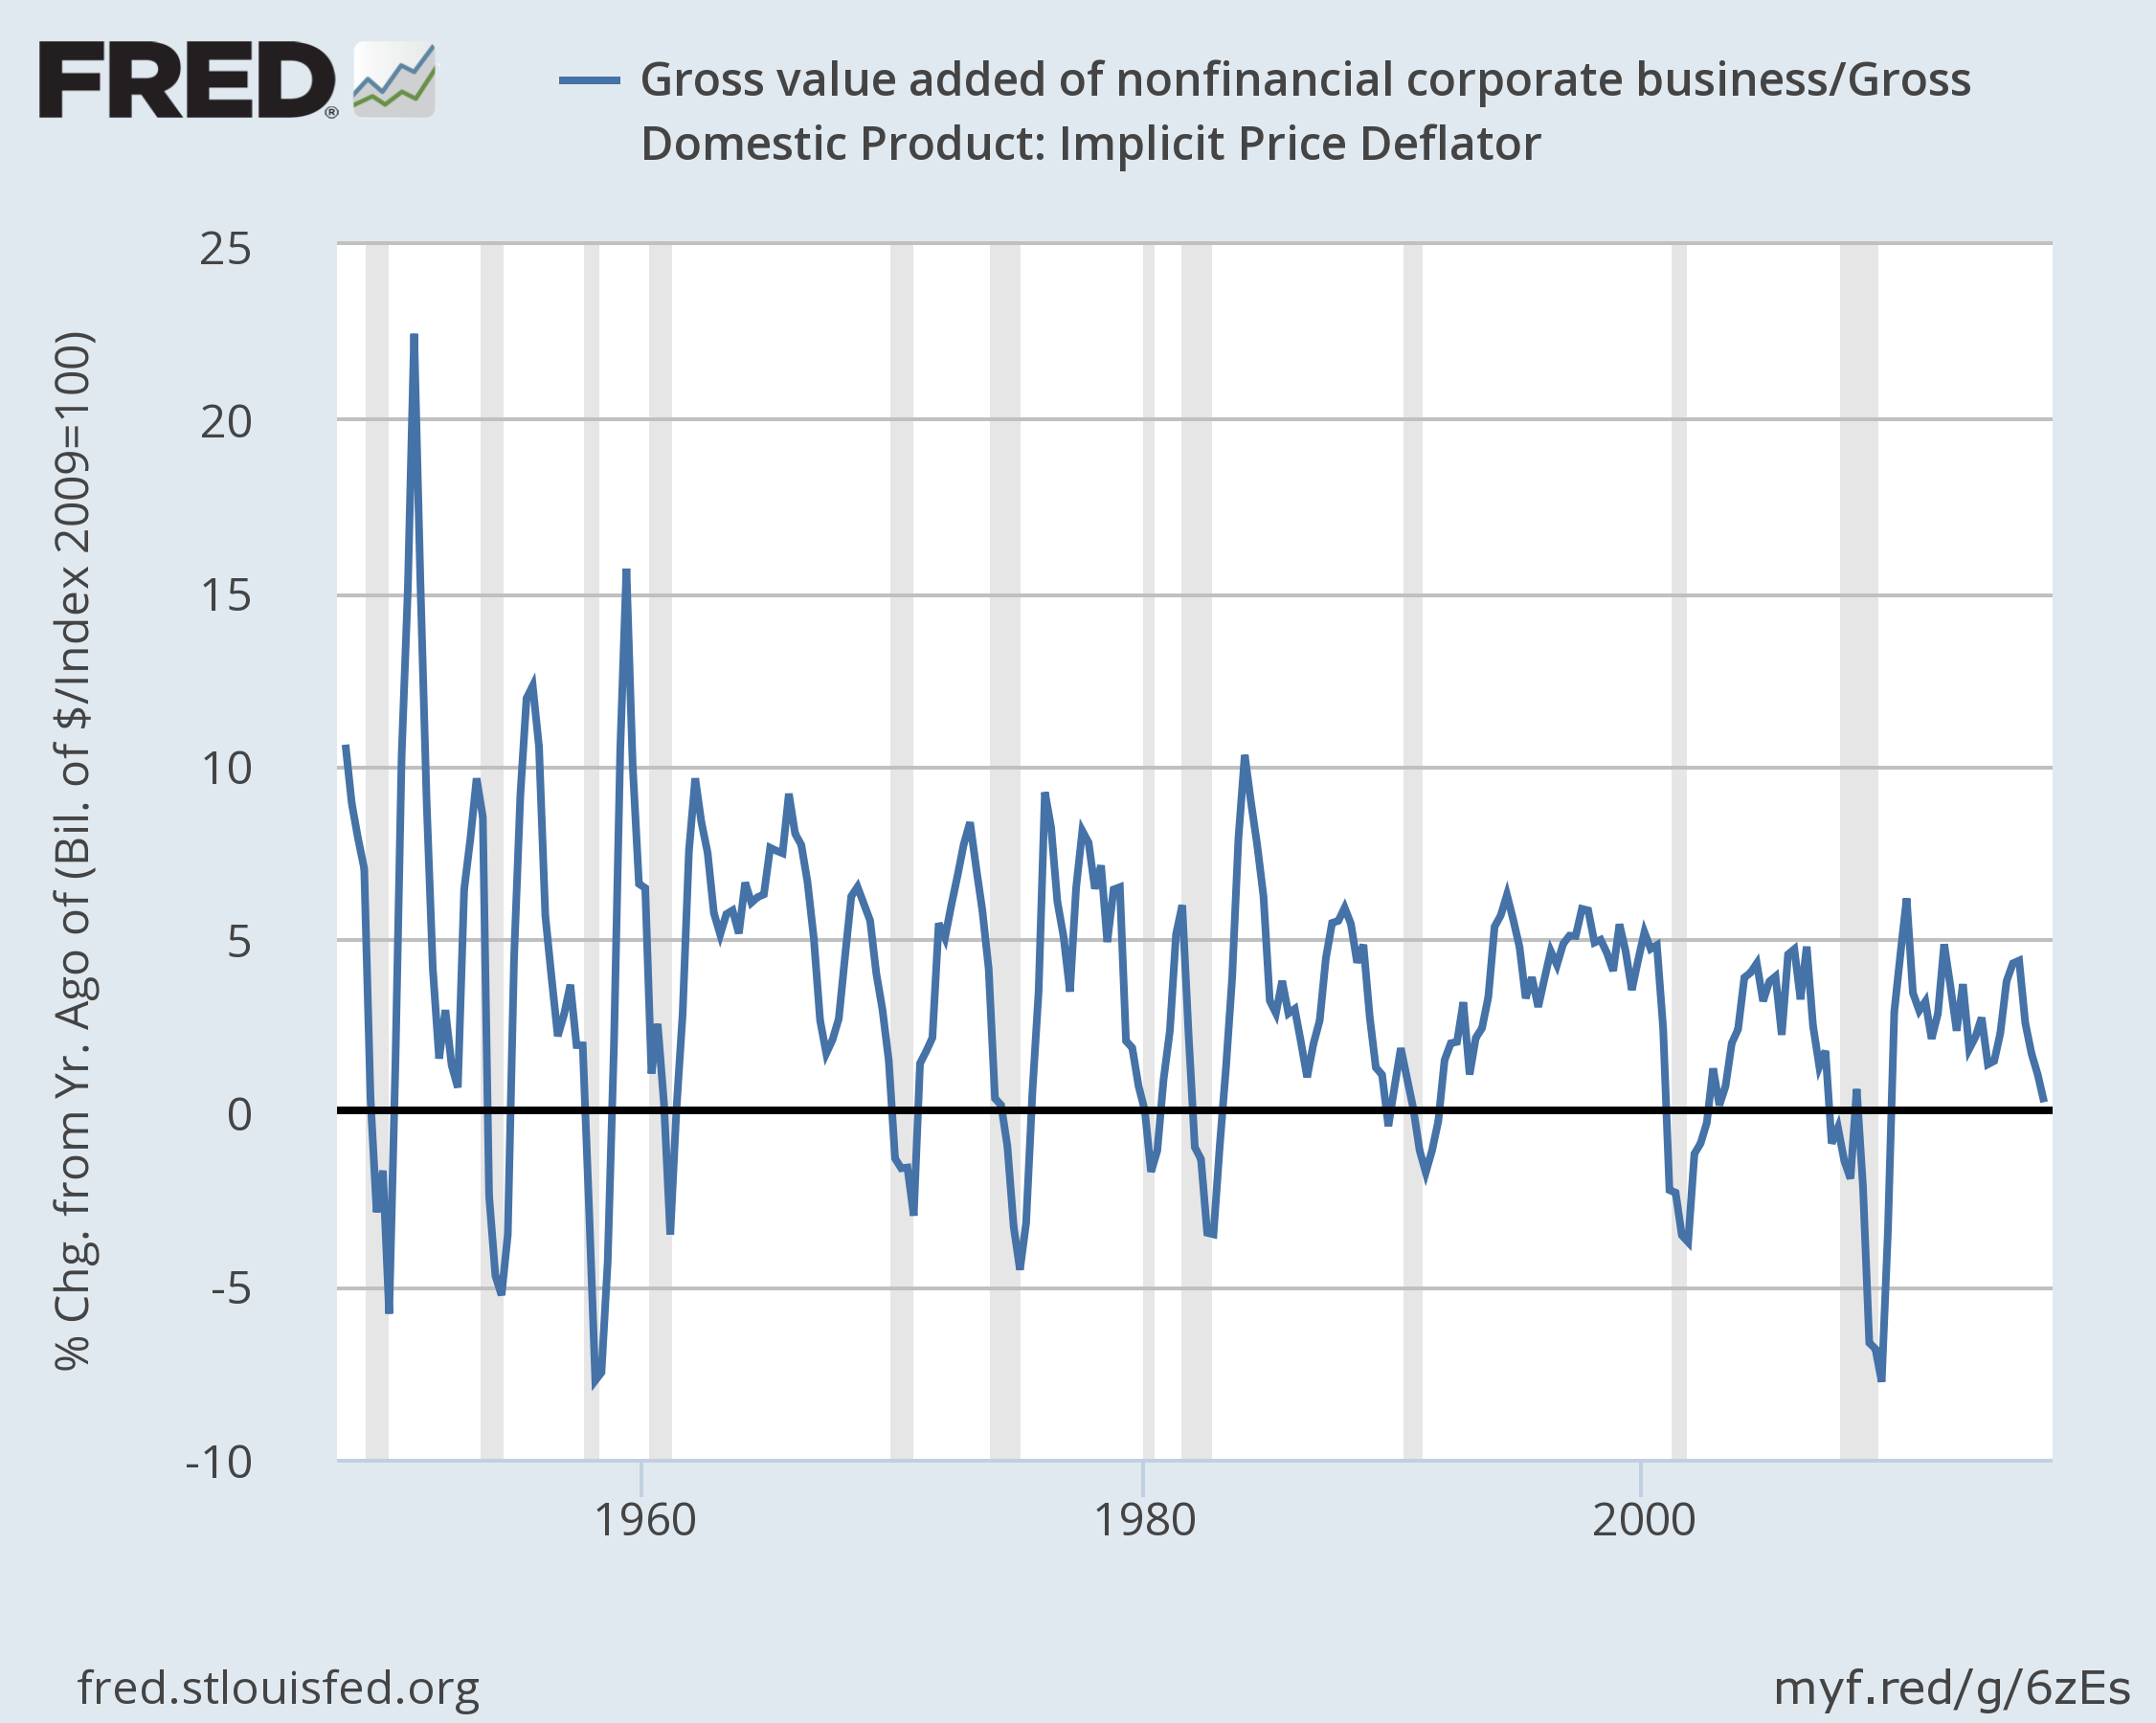
A related problem is evident in corporate bonds. Nonfinancial corporate debt has easily reached the highest ratio in history to corporate gross value-added, but appears less extreme relative to “EBITDA” - earnings before interest, taxes, depreciation and amortization. The problem is that corporate profit margins are enormously variable over the economic cycle, which is why corporate defaults spike dramatically during recessions. Given that nearly 70% of outstanding corporate debt is now “covenant-lite,” offering substantially less protection in the event of default, we’ve seen average recovery rates on recent defaults plunge to just 20%; the lowest level in history. The recent market cycle has joined extremely high debt burdens with extremely low recovery rates, which will create a wide gap between stated yields and actual realized returns as the economic cycle is completed. The chart below shows the year-over-year growth rate of nonfinancial gross value-added since 1947 (shaded regions are recessions), expressed in real terms by dividing by the GDP deflator. I’ve deferred table-pounding about recession risks until we observe a more significant deterioration in the equity market (say, below 2000 on the S&P 500) coupled with widening credit spreads and a slowing in employment growth below about 1.4% annually (it’s currently about 1.7%), but it’s clear that the overall pace of economic activity has rolled over considerably in recent quarters.
Yes, low interest rates are a source of relief for credit strains in this situation, but when companies default, it’s typically because of underlying profit headwinds and solvency issues. In my view, financial distortions have allowed those underlying risks to progressively worsen in recent years. When the likely impact of cumulative default rates and spread volatility are taken into account, I would suggest that corporate bond yields are already at zero from the standpoint of probable realized total return on investment, particularly on a risk-adjusted basis. Ditto for foreign investors chasing yields in U.S. Treasury bonds. While U.S. yields may be higher than those in Japan and Europe, there’s currency risk involved in reaching for yield in U.S. Treasuries. In recent weeks, the cost of foreign currency “basis swaps” to hedge that risk have increased to levels that wipe out any yield “pickup” that might be available, so foreign investors in U.S. Treasuries now face negative interest rates on a currency-hedged basis. Even on an unhedged basis, foreign currency markets have already responded to low interest rates abroad by driving foreign currencies well below their longer-term “purchasing power parity” values, simultaneously driving up the value of the U.S. dollar. This response reflects a Dornbusch-type “overshooting” where foreign investors in higher yielding U.S. Treasuries are likely to be penalized by a gradual longer-term depreciation in the dollar that offsets the potential benefit of the higher yield. Put simply, most apparent “opportunities” to obtain investment returns above zero in conventional assets over the coming decade are based on a misunderstanding of valuations, total returns, and historical yield relationships. At current valuations, virtually everything is priced for a decade of zero. The unwinding of these speculative extremes is likely to be chaotic, and will likely occur over a shorter horizon than investors imagine. That chaos, driven not by central bank tightening but by an emerging default cycle, will usher in fresh investment opportunities in conventional assets, where presently there are none. Keep in mind that negative interest rates can only be negative to an extent, and for a period of time, that is limited enough to make avoidance measures unprofitable. The easiest way to avoid negative interest rates is to hold physical currency in a safe. To invest in the safe and insure the contents involves a cost that’s too high if negative interest rates are a fraction of a percent and aren’t likely to be sustained for long, particularly since one gives up useful banking services (e.g. check writing and clearing) by doing so. Institutional constraints (such as legal requirements that insurance companies hold long-duration assets to offset their long-duration liabilities) have played a part in enabling negative rates, but the revulsion of savers who aren’t subject to institutional constraints is likely to set a lower bound on even negative rates. I imagine that Ben Bernanke, Mario Draghi and Haruhiko Kuroda all stay awake at night imagining ways to force negative rates on savers. But the larger question, beyond a sociopathic desire to control others in service of one’s own intellectual dogma, is why anyone would advocate such policies. I can’t emphasize strongly enough that there is no economic evidence that activist monetary intervention has materially improved economic performance in recent years; a fact that can be demonstrated using constrained and unconstrained vector autoregressions (which overcome the incorrect notion that “there is no counterfactual”). Specifically, the trajectory of the economy in recent years has followed a largely mean-reverting course that one could have anticipated simply on the basis of lagged economic data, and there is no economically meaningful difference in the projected trajectories of GDP, industrial production, and employment using purely non-monetary variables, compared with projections that include measures of recent extraordinary monetary policy. Even allowing for a negative “shadow” Federal Funds rate, as Wu and Xia have done, results in the conclusion that extraordinary monetary policy boosted U.S. industrial production by less than 1%, and lowered the unemployment rate by just over one-tenth of 1% beyond what would have been expected from conventional monetary policy (as defined by the Taylor Rule). Though Wu and Xia dutifully, and a bit stunningly, accept this meager difference as evidence that extraordinary monetary policy “succeeded,” the magnitude of that success is economically trivial, and pales in comparison to the extraordinary speculative distortions and vulnerabilities that zero-interest policies have now built into the global economic system. The outcome of years of yield-seeking speculation induced by central banks is that investors across the globe have now locked in zero prospective total returns in virtually in every asset class for the coming decade. In an environment of perfect economic stability, perhaps these zero returns might come as they have in the U.S. stock market since about mid-2014, with meager overall progress and moderate intermediate-term volatility, but without an intervening bear market collapse. The broad NYSE Composite remains below the level it set in June 2014, and the S&P 500 is scarcely 2% above its May 2015 high. We actually view this period as the extended top-formation of the third speculative bubble in the past 16 years, not as a representative sample of things to come. We don’t rule out a near-term continuation of this sideways market behavior, but we doubt it will continue longer-term. In recent weeks, we’ve maintained a rather neutral near-term outlook as a result of mixed market internals (mainly driven by various trend-following components), but this outlook also features very “unpleasant skew.” Near term, the single most likely outcome in any given week is a small gain, but that likelihood is also offset by the small probability of a wicked loss that can easily wipe out weeks or months of upside progress in one fell-swoop. Those plunges are random in the sense that we have no idea when they will occur, but they are also predictable in the sense that the underlying probability distribution of returns, during overextended conditions similar to the present, has been fairly stable across decades of market history. It’s like drawing randomly from a hat that contains lots of small green balls, but also includes red balls that are disproportionately large, and often have lit fuses. Overall, the average expected return under the current expected market return/risk classification is highly negative, but that loss typically reflects an extended period of misleadingly complacent week-to-week stability that then abruptly ends in disruption (see Impermanence and Full Cycle Thinking for a chart of this probability distribution in data since 1940). Looking beyond the near-term, my view is that a “permanently high plateau” is unlikely, and we will instead see a violent unwinding of recent speculative extremes over the completion of the current market cycle, even if central banks ease aggressively, as they did throughout the 2000-2002 and 2007-2009 collapses. Corporate income growth and profit margins have already begun to narrow from their extremes, and the default cycle has already turned higher. The completion of this cycle won’t arrive because central banks suddenly become enlightened enough to abandon their recklessness. It will arrive precisely because they have sustained yield-seeking speculation for too long already; because they have amplified the vulnerability of the debt and equity markets to normal economic fluctuations; and because the consequences of this fragility are now fully baked in the cake. The foregoing comments represent the general investment analysis and economic views of the Advisor, and are provided solely for the purpose of information, instruction and discourse. Please see periodic remarks on the Fund Notes and Commentary page for discussion relating specifically to the Hussman Funds and the investment positions of the Funds. --- The foregoing comments represent the general investment analysis and economic views of the Advisor, and are provided solely for the purpose of information, instruction and discourse. Prospectuses for the Hussman Strategic Growth Fund, the Hussman Strategic Total Return Fund, the Hussman Strategic International Fund, and the Hussman Strategic Dividend Value Fund, as well as Fund reports and other information, are available by clicking "The Funds" menu button from any page of this website. |
|||||||||||||||||||||||||
|
For more information about investing in the Hussman Funds, please call us at
1-800-HUSSMAN (1-800-487-7626) 513-326-3551 outside the United States Site and site contents © copyright Hussman Funds. Brief quotations including attribution and a direct link to this site (www.hussmanfunds.com) are authorized. All other rights reserved and actively enforced. Extensive or unattributed reproduction of text or research findings are violations of copyright law. Site design by 1WebsiteDesigners. |

