|
|
||||||
|
|

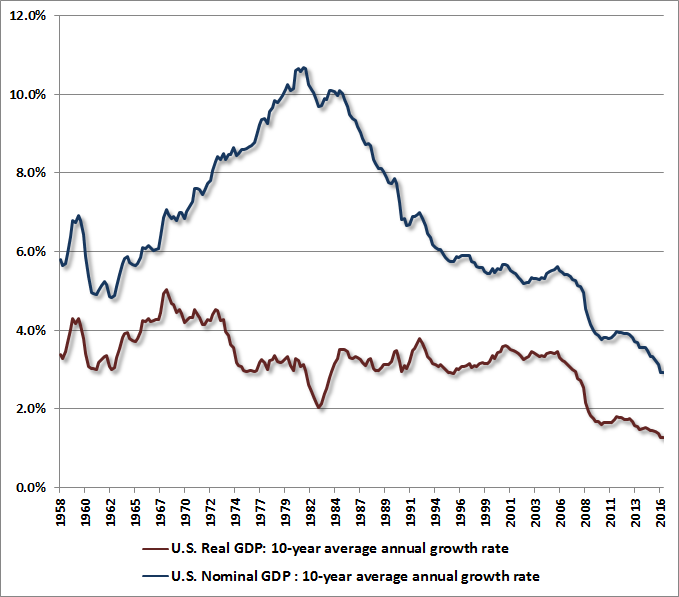
September 26, 2016 Structural Growth and Dope Dealers on Speed-Dial In recent years, the U.S. equity market has scaled the third steepest cliff in history, eclipsed only by the 1929 and 2000 peaks, as investors rest their full confidence and weight on the protrusions of a structurally deteriorating economy, imagining that they are instead the footholds of a robust investment environment. The first of these is the current environment of low interest rates. While investors take this as quite a positive factor, it’s largely a reflection of a steep downturn in U.S. structural economic growth, magnified by reckless monetary policy. Over the past decade, the average annual nominal growth rate of GDP has dropped to just 2.9%, while real GDP growth has plunged to just 1.3%; both the lowest growth rates in history, outside of the Depression (see the chart below). Indeed, probably the most interesting piece of information from last week’s FOMC meeting was that the Federal Reserve downgraded its estimate for the central tendency of long-run GDP growth to less than 2% annually.
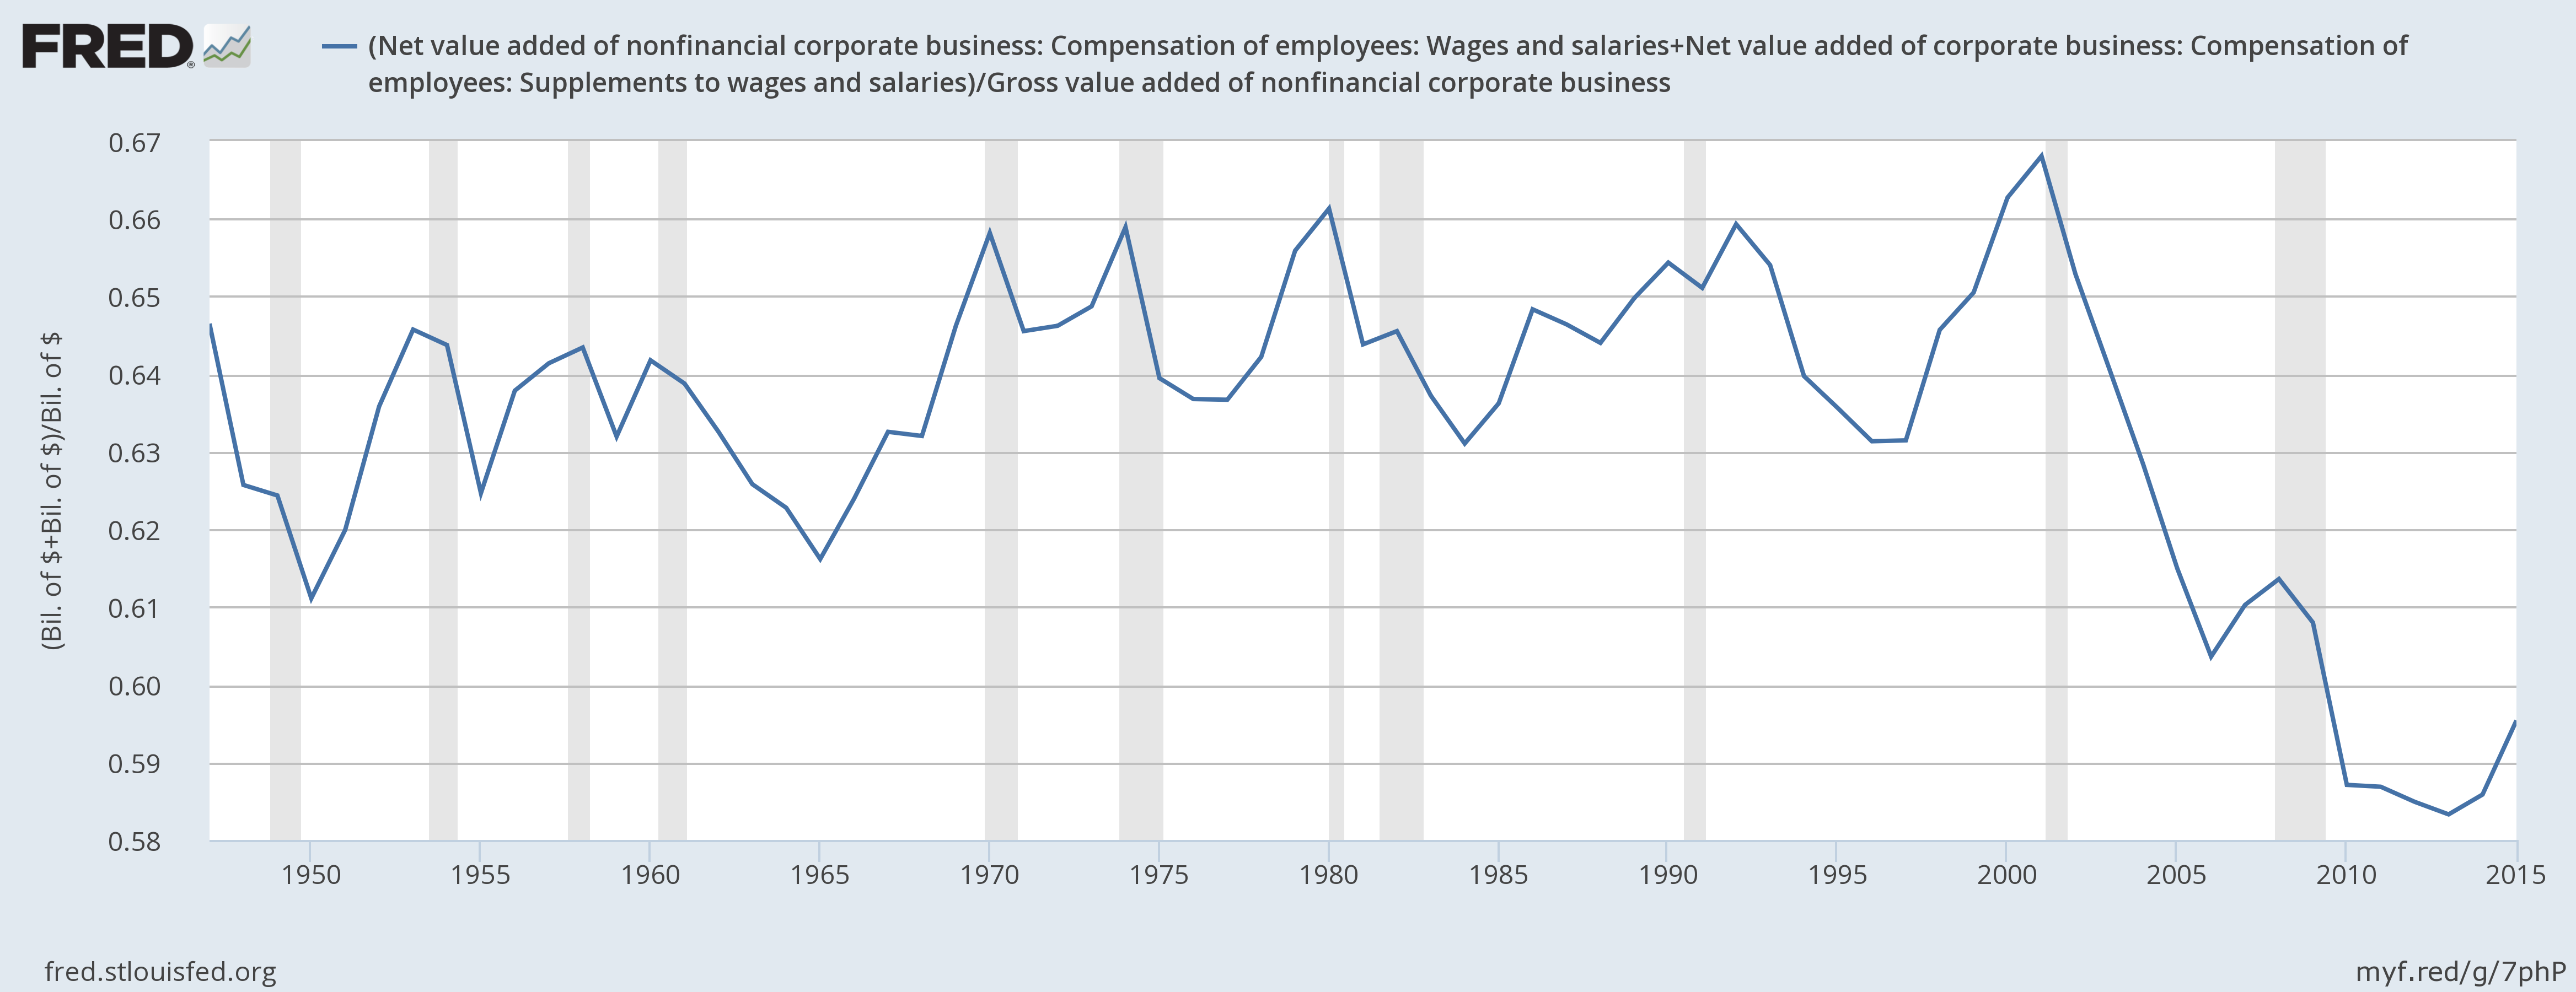
The weakness in real GDP growth is of greatest concern, because it’s largely the consequence of policies that encourage repeated cycles of bubbles and collapses, and chase debt-financed consumption instead of encouraging productive real investment. Indeed, growth in real U.S. gross domestic investment has collapsed since 2000 to just one-fifth of the rate it enjoyed in the preceding half-century, and has averaged zero growth over the past decade. While labor force growth has slowed, it’s really the self-inflicted collapse of U.S. productivity growth, enabled by misguided policy, that’s at the root of the problem. Ironically, investors have been slow to recognize the implications of declining structural growth precisely because of the opium-like qualities of the Federal Reserve policies that are responsible for it. Fed policy has amplified the feedback loop of weak growth on interest rates, driving short-term rates not only to low single-digits (where historical relationships suggest they ought to be here), but all the way to zero. In turn, the discomfort with zero interest rates has provoked persistent yield-seeking speculation by investors, driving the most historically-reliable equity market valuation measures to offensive extremes. This yield-seeking behavior has also encouraged heavy issuance of low-grade “covenant lite” debt in order to satisfy investor demand for more “product” (just as we observed during the mortgage bubble). Corporate debt has never been higher as a fraction of corporate gross value-added. The result is an enormous volume of overvalued financial securities that rely on the cash flows generated by an increasingly stagnant economy. All of this may feel good, but it’s only a temporary high in a fatal cycle, and the members of the Federal Reserve Board are just dope dealers on speed-dial. Intuitively, from the standpoint of income and expenses, the spike in corporate profits emerged because the combined deficit of government and households allowed companies to keep on selling despite the fact that payroll expenditures had plunged to the lowest share of revenues in history. The chart below shows employee compensation as a share of corporate gross value-added. In recent quarters, revenue growth has turned down while labor costs (particularly unit labor costs) have advanced, putting pressure on corporate profits. From a the standpoint of sectoral surpluses and deficits, the combined deficit of government and households has narrowed, gross domestic investment is now in retreat, and the trade deficit has deteriorated, all predictably contributing to lower corporate profit margins in recent quarters.
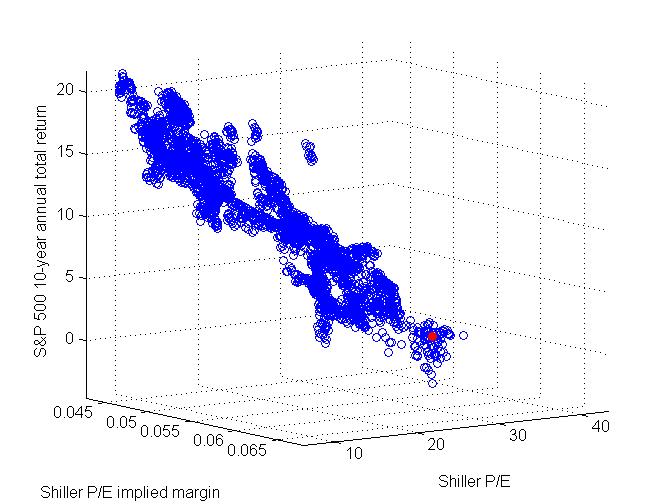
If one invests by way of the rear-view mirror, the recent half-cycle could hardly present a more beautiful picture to investors: low interest rates, record-high profit margins, and equity prices that have appeared to climb to the sky without correction, seemingly guaranteed through the benevolence of central bankers toward the investor class. Unfortunately, like the housing bubble and the tech bubble before it, this gleeful romp into the land of “this time it’s different” is likely to collapse in a smoldering pile of ruins. The reason is that the very things that have created this glorious rear-view landscape have been obtained by ripping prosperity from the future. By following a dogma that treats debt-financed consumption and financial speculation as a substitute for actual economic growth, policymakers have encouraged obscene valuations, extreme debt burdens, and speculative malinvestment; front-loading market returns to the point where there is little but risk on the financial horizon for the coming 10-12 years (though there will undoubtedly be excellent opportunities much sooner, at points where substantial retreats in valuations are joined by early improvements in market action). We currently estimate S&P 500 nominal total returns averaging just 1.4% annually over the coming 12-year period. The higher investors have driven market valuations, the lower prospective future returns have become. What looks beautiful in the rear-view mirror has been torn from the abyss that lies ahead in the windshield. The most substantial risk is that a mountain of debt and overvalued financial securities has been built on the expectation of permanently high corporate profits, which were actually an artifact of temporary sectoral deficits and monetary interventions. The consequences will unfold as a tidal wave of debt defaults, earnings shortfalls, and pension crises in the years ahead. Unfortunately, in both real and nominal terms, the underlying growth rate of the U.S. economy has never been weaker outside of the Depression; and this is after one of the longest economic recoveries in history. If one couples a sub-3% nominal growth environment with any further retreat in corporate profit margins at all, investors should expect corporate earnings not to grow, but to contract, in the next few years. On normalized margins, the cyclically-adjusted P/E is now at 36 Presently, S&P 500 reported GAAP earnings (based on generally-accepted accounting principles) are essentially where they stood at the 2007 market peak. Even Wall Street’s optimistic non-GAAP estimates for year-ahead “forward operating earnings” are no higher than they were in early-2014. Still, when we discuss profit margins, the argument is not that the financial markets are at risk simply because earnings will retreat over the next few years. Yes, given sluggish nominal growth, coupled with unit labor costs now outstripping the GDP deflator, the earnings weakness we’ve seen for several quarters does appear likely to continue. But that’s not the main risk. Rather, the problem is that investors have priced stocks in a way that quietly embeds the assumption that record profit margins seen earlier in this cycle will persist forever. So regardless of whether margins normalize over two years or ten, investors have inadvertently priced stocks at an obscene multiple of representative long-term cash flows. As I emphasized in Margins, Multiples, and the Iron Law of Valuation, the objective of a good valuation measure is to act as a “sufficient statistic”- not for earnings over the next year or two, but for the entire long-term stream of cash flows that will be delivered into the hands of investors over time. There are numerous, historically-reliable valuation measures available to investors. While Robert Shiller’s cyclically-adjusted P/E (CAPE) is widely recognized to be more reliable across history than raw trailing price/earnings ratios, it actually underperforms Tobin’s Q, nonfinancial market capitalization/GDP and market capitalization/corporate gross value-added (our preferred measure) in market cycles across history. The reason is that despite using the 10-year average of inflation-adjusted earnings, the CAPE is systematically corrupted by variations in the embedded profit margin, and correcting for that substantially improves its reliability. A couple of years ago, I showed that it’s necessary to adjust the CAPE by considering its embedded profit margin. To illustrate why the adjustment is necessary, the chart below, from my May 5, 2014 weekly comment, shows a 3-dimensional scatter of the Shiller P/E, the embedded profit margin (the denominator of the Shiller P/E divided by S&P 500 revenues), and the actual subsequent 10-year nominal annual total return of the S&P 500 Index. A reliable outlook for subsequent market returns requires investors to consider both the multiple and the embedded profit margin. Notably, when both the multiple and the margin are high, investors are essentially paying prices that represent a rich multiple of already-elevated earnings. Subsequent market returns are predictably dismal. The red dot corresponds to the margin, multiple, and expected return as of May 2014. Because valuations have become somewhat more extreme since then, the prospective 10-12-year market outlook is currently even worse.
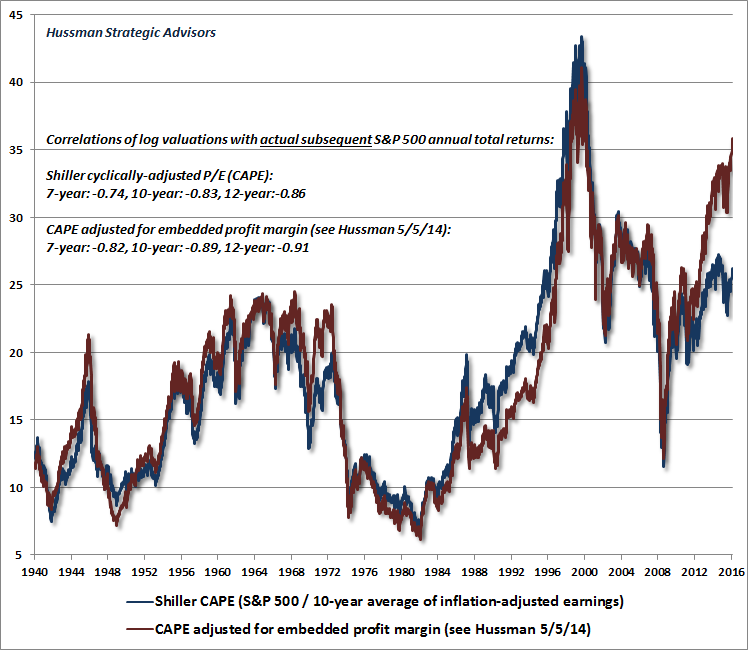
The chart below shows just how high reliable measures of valuation have been driven by yield-seeking speculation. Presently, the Shiller CAPE stands at close to 26, which is already well above historical norms, and above anything seen prior to the sequential bubbles (and collapses) of recent cycles. But the CAPE only captures part of the risk, because that 10-year average of inflation-adjusted earnings actually embeds the highest profit margin in history. By accepting the CAPE at face-value, investors are quietly assuming that profit margins will remain at this level permanently. On the basis of normalized profit margins, which systematically produce a more reliable valuation measure across history, the CAPE would presently be at 36.
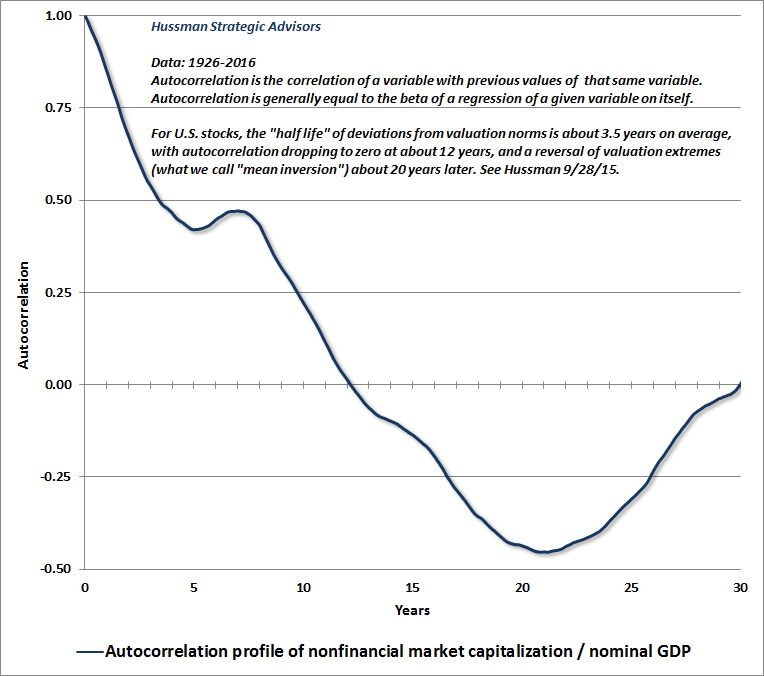
I get it. Investors don’t want to believe any of this. They prefer popular metrics like price/forward operating earnings despite the relatively weak correlation of that measure with actual subsequent market returns. Wall Street certainly prefers that measure because it can drive forward-earnings estimates up to elevated levels (which are virtually never realized), producing a P/E multiple that can be compared, through a bit of slight-of-hand, with historical “norms” that are based on entirely different earnings figures. The problem is that stocks aren’t a claim on next year’s earnings. They’re a claim on decades and decades of future cash flows that will actually be delivered into the hands of investors over time. The only reason to use a valuation multiple is as shorthand for a more detailed discounted cash-flow analysis. But if one uses a valuation multiple, it’s essential that the underlying fundamental should be a reasonably “sufficient statistic” that’s representative not of next year’s earnings, but of that very, very, long-term stream of underlying cash flows. This is the same argument I made at the market peak in 2000, and again in 2007. While my concerns may have been the subject of debate at the time, the dismissive argument that “profit margins are fine, valuations should be higher, and stocks are going up” was settled by the steepest market plunge since the Great Depression. The fact that those losses have been stick-saved by creating the third speculative bubble since 2000 doesn’t mean that these concerns can be dismissed. No, it means that the spectacular collapse of yet another bubble is going to be replayed over the completion of the current cycle. At present, we estimate prospective S&P 500 nominal total returns averaging just 1.4% annually over the coming 12 year horizon, with the likelihood of an interim 40-55% market collapse over the completion of the current cycle. It’s tempting to believe that the continued suppression of interest rates will prevent any normalization of valuations “this time.” But when one examines a century of market evidence, it turns out that the completion of every single market cycle in history has brought valuations to the point where prospective returns increased to the 8-10% range or higher. That’s true even of cycles where interest rates were quite low. Indeed, the level of interest rates at any point in time exerts a minuscule effect on the level of valuations observed even a few years later. Even if we assume dismal enough economic growth that interest rates will remain low indefinitely, what investors might gain from the hope of higher future valuations would be taken away in the form of poor growth in revenues and earnings. Conversely, if we assume that the economic growth will normalize, it follows that the appropriate range of valuations for equities will be the same range that has prevailed for the past century, where the mean is actually less than half of present levels, at least on measures that are actually reliable. Historically, extreme valuations have been a very tight box, from which there has never been a bloodless escape. To offer some statistical perspective on the subject, the chart below shows the autocorrelation profile of market capitalization/nominal GDP in data since 1926. Autocorrelation describes the relationship of a variable with previous values of that same variable. Autocorrelation is also essentially the “beta” of a regression of a variable on itself. So you can think of the profile below as the average time it takes for overvaluation or undervaluation to “decay.”
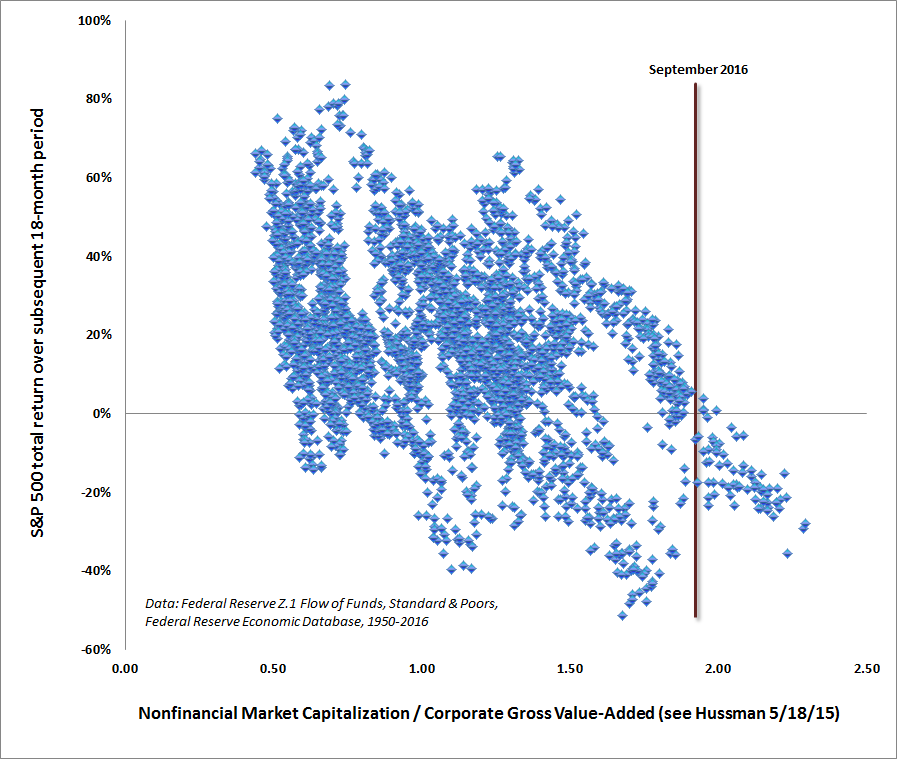
Since the autocorrelation profile doesn’t simply collapse to zero in the first year or so, it should be clear that valuations have relatively little effect on near-term outcomes. Instead, notice that the “half-life” of a given departure of valuations from their norms is about 3.5 years. On average, the relationship between current and previous valuations drops to zero after 12 years (which is why we often use a 12-year horizon in our estimates of future prospective S&P 500 total returns). Notably, there’s also a tendency for valuation extremes to “invert” to opposite extremes after about 20 years, which is what we observe as “secular” movements between extreme undervaluation and extreme overvaluation, typically spread across a series of cyclical bull-bear periods. We often hear the argument “well, stocks were supposedly overvalued a few years ago, and they’re even higher now, so obviously valuations are wrong.” This is like imagining that a house of cards is more stable the taller it becomes. History has repeatedly crushed investors who think like that, because extended deviations from the norm that result in even more extreme valuations tend to be resolved by violent reversion in the opposite direction. If one hasn’t learned this from the extended advances that produced the 1929, 2000, and 2007 peaks, and the collapses that followed, one hasn’t actually studied market history. The hinge that determines whether an overvalued market will become more overvalued, or whether it will crash, is the prevailing attitude of investors toward risk. Specifically, returns over shorter segments of the market cycle are generally driven by the preference of investors toward risk-seeking or risk-aversion (which we infer from the uniformity or divergence of a broad range of market internals). As I noted last week, various trend-following elements of our own measures have deteriorated, which moved our near-term outlook from a relatively neutral view to what is now effectively the most negative outlook we could adopt. Moreover, even without unfavorable market internals, we would not ignore current valuation extremes. Valuations have now reached the point where we simply observe no historical instances where similar levels were followed by anything but tepid returns or losses, even over a horizon as short as 18-months.
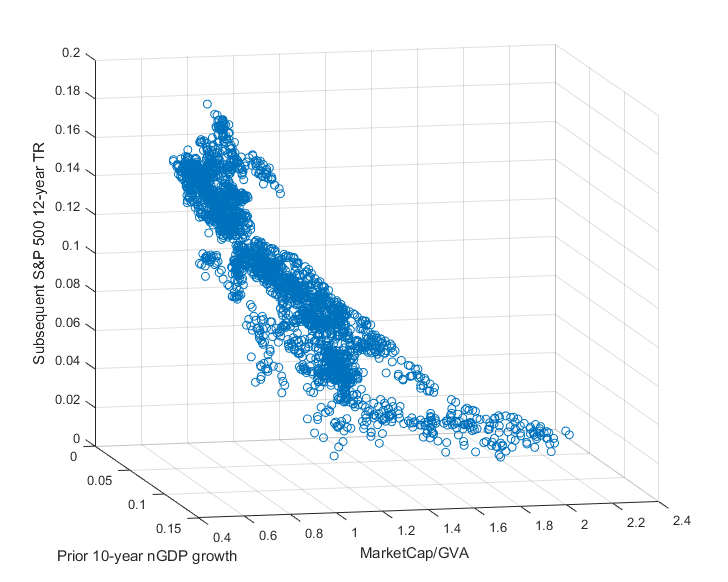
While weak nominal GDP growth over the preceding decade is correlated with both low interest rates and elevated market valuations, this combination actually turns out to be the worst possible setup for future investment returns. Investors are treating the artifacts of deteriorating U.S. structural economic growth as if somehow depressed interest rates and elevated valuations are a good thing. Nothing could be further from the truth. The chart below shows a 3-dimensional scatter of trailing 10-year nominal GDP growth, the ratio of nonfinancial market capitalization to corporate gross value-added (currently at a multiple of 1.9), and the actual subsequent 12-year annual total return of the S&P 500, in data since 1940. Investors are presently sitting near the far bottom corner of this scatterplot.
I remain convinced that whatever incremental returns investors expect from the U.S. stock market in the next few years should be tempered by an estimate of potential losses in the 40-55% range. That outcome would actually be fairly run-of-the-mill over the completion of the present market cycle, from the standpoint of current valuation extremes. Whatever your estimate of potential return, temper it with a historically-informed assessment of the potential risk. Virtually every result in portfolio theory instructs investors to align their exposure in response to two things; the expected return/risk profile of an investment, and the correlation of that investment with other elements in the portfolio. A seemingly “diversified” portfolio of U.S. and international stocks, emerging market securities, and low-grade debt is misleadingly unsound because these asset classes tend to be tightly correlated when risk-premiums expand (investors should demonstrate this to themselves with historical data before it’s too late). Even if investors believe that international equities represent a better value than U.S. equities, their betas still tend to approach 1.0 during general U.S. market declines. My view remains that investors should make room in their portfolios for safe, low-duration assets, hedged equities, and alternative strategies that have a modest or even negative correlation with conventional securities. The opportunity to take significant exposure to conventional assets is when their risk premiums are elevated and being pressed lower, which typically occurs when a material retreat in valuations is joined by an early improvement in market action. At present, given the fresh deterioration in market internals that I noted last week, investors face exactly the opposite situation. Until this combination of unfavorable valuations and unfavorable market internals is reversed, the risk to capital will remain steep.The foregoing comments represent the general investment analysis and economic views of the Advisor, and are provided solely for the purpose of information, instruction and discourse. Please see periodic remarks on the Fund Notes and Commentary page for discussion relating specifically to the Hussman Funds and the investment positions of the Funds. --- The foregoing comments represent the general investment analysis and economic views of the Advisor, and are provided solely for the purpose of information, instruction and discourse. Prospectuses for the Hussman Strategic Growth Fund, the Hussman Strategic Total Return Fund, the Hussman Strategic International Fund, and the Hussman Strategic Dividend Value Fund, as well as Fund reports and other information, are available by clicking "The Funds" menu button from any page of this website. |
|||||||||||||||||||||||||
|
For more information about investing in the Hussman Funds, please call us at
1-800-HUSSMAN (1-800-487-7626) 513-326-3551 outside the United States Site and site contents © copyright Hussman Funds. Brief quotations including attribution and a direct link to this site (www.hussmanfunds.com) are authorized. All other rights reserved and actively enforced. Extensive or unattributed reproduction of text or research findings are violations of copyright law. Site design by 1WebsiteDesigners. |