|
|
||||||
|
|

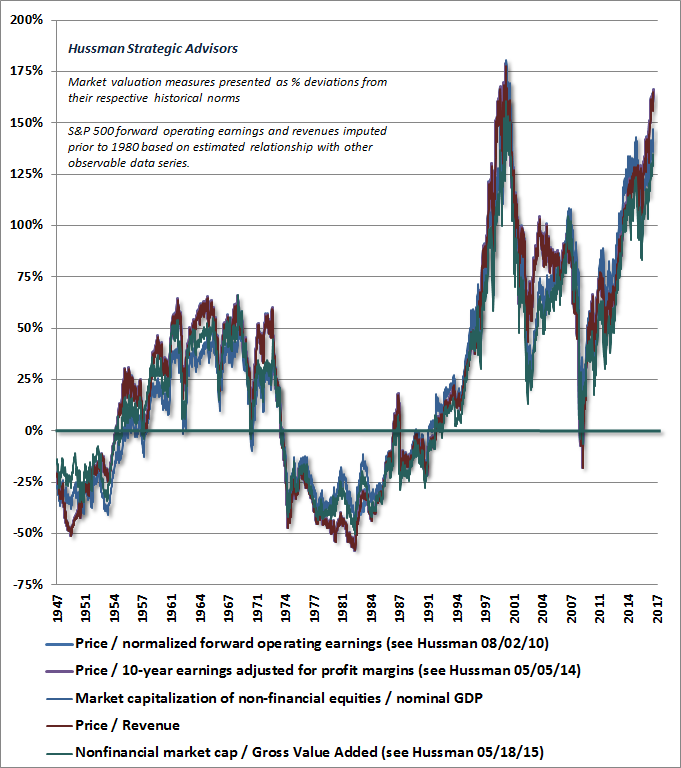
June 5, 2017 Three Factors Having extensively detailed my concerns about market conditions in prior comments, my impression is that the best course at present is to discuss the status of the more important elements of our discipline. Overall, my impression remains that the market is in the process of tracing out the blowoff finale of the third speculative financial bubble since 2000. Still, as is true for the market cycle as a whole, the broad outline of this top formation is likely to be shaped by three factors: 1) valuations, which primarily affect total market returns over a 10-12 year horizon, as well as the magnitude of potential losses over the completion of the market cycle; 2) the uniformity or divergence of market internals across a broad range of stocks and security-types, which remains the most reliable measure we’ve identified of the psychological preference of investors toward speculation or risk-aversion (when investors are inclined to speculate, they tend to be indiscriminate about it); and 3) overextended market action highlighting extremes of speculation or fear - in the advancing portion of the market cycle, these are best identified by syndromes of overvalued, overbought, overbullish conditions. Recall the central lesson and adaptation we had to introduce during the recent advancing half-cycle, as a result of deranged central bank intervention: in prior market cycles across history, “overvalued, overbought, overbullish” syndromes could be immediately relied on as a warning of steep and abrupt market losses. In the recent half-cycle, however, investors became compelled that zero interest rates created a situation where there was no alternative to equities, and yield-seeking speculation persisted long after even the most extreme “overvalued, overbought, overbullish” syndromes emerged. In the presence of zero interest rates, one had to wait for market internals to deteriorate explicitly, before adopting a hard-negative market outlook. Put simply, in prior market cycles across history, a hard-defensive outlook was appropriate either when rich valuations were joined by divergent market internals, or at the point that severely “overvalued, overbought, overbullish” syndromes emerged. In the presence of zero interest rates, however, “overvalued, overbought, overbullish” syndromes were not enough, and had to be explicitly prioritized behind our measures of market internals. Understand that distinction, and you understand virtually everything that was necessary to avoid our own difficult experience in the recent half-cycle, without losing the capacity of our discipline to anticipate the 2000-2002 and 2007-2009 collapses, which we demonstrated in real-time; without losing the capacity to adopt a constructive outlook at the point that a material retreat in valuations is joined by an early improvement in market action, which I’ve done after every bear market decline in over 30 years as a professional investor (though my late-2008 shift was truncated by my insistence on stress-testing our methods against Depression-era data); without losing the capacity to tolerate an extended further market advance if the recent period of speculation continues; and without abandoning the capacity to avoid what we fully expect to be extraordinary market losses over the completion of the current cycle. Three factors Valuations: From a long-term and full-cycle standpoint, I continue to view current market valuations as obscene. Based on measures we find most tightly correlated with both actual subsequent 10-12 year S&P 500 total returns, and prospective market losses over the completion of the market cycle, the outlook for investors is easily the second most offensive in history. From the standpoint of individual stocks, the median price/revenue ratio of S&P 500 components is now more than 50% beyond the 2000 extreme, and establishes the present moment as the single most extreme point of broad market overvaluation in U.S. history. The chart below offers a good sense of where current valuations stand from a historical perspective. Our most reliable measures range between 135-165% above historical norms that have regularly been visited or breached during the completion of market cycles across history, including those featuring relatively low interest rates. I’ve extensively reviewed the “justified” impact of interest rates on valuations, so I won’t review that analysis here, except to reiterate that the argument is vastly overstated, and does nothing to change the dismal prospects of the equity market in the coming 10-12 years. From the standpoint of downside risk over the completion of the current cycle, merely touching historically run-of-the-mill valuations in the next few years would presently require a decline in the S&P 500 on the order of 57-62%. Even coming within 25% of historical norms (which no market cycle in history has failed to revisit, even since 2000) would require a market decline on the order of 47-53%. Suffice it to say that a 50-60% loss in the S&P 500 over the completion of the current market cycle would not be a “worst case” scenario, but instead a run-of-the-mill outcome.
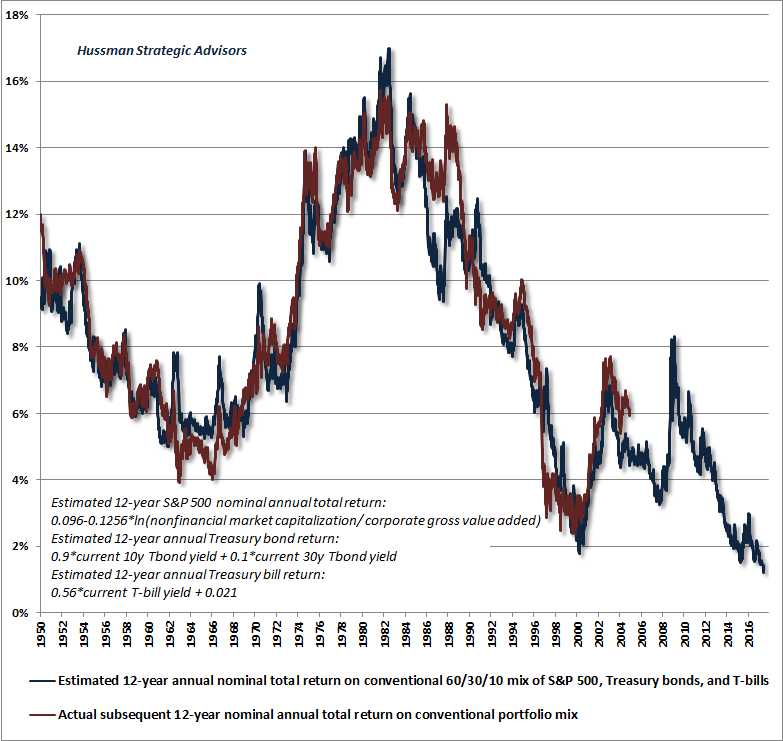
On a 12-year horizon, our estimate of prospective S&P 500 nominal annual total returns has now dropped below 0.5% annually. The low interest rates accompanying these valuations create not a favorable situation but a brutal one for investors. Unlike the market peak in 2000, when Treasury bonds provided a relatively safe and acceptable alternative to hypervalued equities, investors presently face dismal prospective returns in every component of a passive portfolio mix (even as investors continue their frantic exodus into passive investments, based on a rear-view, performance-chasing response to the very price advance that has created these dismal future return prospects). The chart below shows our estimate of the forward-looking reality. The blue line presents the 12-year average annual total return that we estimate for a passive, conventional portfolio mix invested 60% in the S&P 500, 30% in Treasury bonds, and 10% in Treasury bills (blue line). The chart also shows the actual 12-year total return for this portfolio mix (red line). Our current estimate has now plunged to just 1% annually, the lowest prospective return that passive investors have faced in history. I remain convinced that investors with the discipline and flexibility to vary their exposure to market risk over the course of the market cycle are likely to be well-served by that flexibility, as frustrating as it may be over the near term to refrain from speculation in the face of hypervalued new highs.
Market Internals: The second factor to consider is the uniformity or divergence of market action across a wide range of individual stocks, industries, sectors and security-types (including debt securities of varying creditworthiness). Valuations provide an extraordinary amount of information about long-term and full-cycle investment prospects, but have little impact on near-term market behavior over shorter segments of the market cycle. For most of this half-cycle prior to mid-2014, market internals displayed uniform strength, despite persistently overvalued, overbought, overbullish market conditions. In doing so, market internals indicated a continued willingness of investors to speculate, despite conditions that had historically created immediate risk for stocks. The ability of zero interest rates to encourage persistent yield-seeking speculation, despite the most extreme overvalued, overbought, overbullish syndromes, was our Achilles Heel in this half-cycle. The proper response was not to abandon the information from valuations, but to instead require confirmation from deteriorating market internals. Even here, with U.S. interest rates off the zero bound, we are inclined to do so, because interest rates remain near zero abroad. While the relative strength of the U.S. dollar should dissuade capital inflows into overvalued U.S. securities, we can’t rely on that. This possibility doesn’t create any difficulty for our approach. It simply means that in the event our measures of market internals improve materially from here, we would be inclined to soften our immediate market outlook to neutral (that is, we would defer our presently negative outlook) despite the presence of extreme overvalued, overbought, overbullish conditions. Overextended Market Action: The third important factor relates to those overvalued, overbought, overbullish syndromes, which currently reflect the most severely negative conditions we define. Given that valuations remain extreme, and our measures of market internals remain divergent, our present assessment of market risk is steeply negative. The recent advance market has gone some distance, though not enough, to improve those measures of internals. Though these measures extract a signal from the behavior of thousands of securities, my impression is that a few weeks of uniformly favorable market action could shift these measures to a more favorable condition. We wouldn’t become bullish at that point, but we would not be inclined to raise our defenses further on market advances (as we remain moderately, but not aggressively, inclined to do here). Given the recent advance, I reviewed history for points where overvalued conditions were in place, market internals had already deteriorated, and a recent market advance was strong, but insufficient to trigger the thresholds we use to shift our measures to a favorable condition. My objective was to check whether these instances were regularly followed by further strength. If they were, it would argue that we should already defer our negative views. As it happens, there are three points that match those specific criteria: July 1998, November 2011, and February 2015. Only the 1998 instance was memorable enough to recall the market outcome immediately; the S&P 500 dropped by -19.3% over the following 6 weeks. The November 2011 instance initiated a drop of -9.2% in a period of less than 3 weeks, and the February 2015 instance initiated a -5.0% decline over the next two weeks. That’s a rather small set of instances, and we prefer to respond to observed changes in market conditions rather than making forecasts about those changes. Still, the exercise leaves me somewhat more comfortable maintaining our current negative outlook despite the recent advance. As usual, our market outlook will change as conditions shift. Our measures of market internals remain important here, and we’ve embraced the lessons of the recent half-cycle to a far greater extent than observers may assume. Long-term and full-cycle market prospects are aggressively negative, in my view, but our near-term outlook is more flexible. I don’t expect that we’ll shift to a constructive or aggressive outlook until a material retreat in valuations is joined by an early improvement in our measures of market action, but we’re open to a softening of our hard-negative views if improvements in market internals support that shift. Run of the mill outcomes and worst-case scenarios For now, our outlook does remain hard-negative, and regardless of near-term market behavior over the course of this extended top-formation, I continue to have every expectation for a 50-60% loss in the S&P 500 over the completion of the current market cycle. Nothing in that range would require the most reliable valuation measures to breach their historical norms. For that reason the 50-60% range of losses should be considered a run-of-the-mill cycle completion. I’ve been asked what I would consider a “worst case” scenario from a valuation standpoint. You may not want to know, but the chart at the top of this comment offers some perspective as a matter of historical record. On the most reliable measures, the current level of valuations stands at about 2.5 times historical norms (i.e. an average of 150% above those norms), and the lowest point for valuations reaches about 0.45 of historical norms at the 1982 secular low (i.e. -55% below those norms). The journey from one to the other would involve a market loss of -82%. That outcome strikes me as extraordinarily unlikely in the foreseeable future. Still, I view the following outcome as plausible enough to give investors pause at current valuation extremes: assume that a secular low like 1982 does not occur for another 25 years, and assume 5% nominal annual economic growth between now and then. In that event, the loss in the S&P 500 Index between today and the year 2042 would be (0.45/2.50) x (1.05)^25 - 1 = -39%, though dividend income would be expected to bring total returns to nearly 2% annually. Alternatively, if valuations were to take another 25 years merely to touch historical norms, the same arithmetic implies S&P 500 nominal total returns averaging less than 5% annually over the coming quarter-century. The arithmetic linking valuations and expected returns is straightforward, but is also unpleasant at current levels. It offers insight into why, despite an advance to the second most offensive valuation extreme in history, the total return of the S&P 500 has averaged just 4.7% annually during the more than 17-year period since the 2000 peak, with two intervening collapses of 50% or more, and most likely a third one on the way. Unless investors can rely on rich valuations a decade from now, the intervening returns of the S&P 500 are likely to average zero or worse between now and then.The foregoing comments represent the general investment analysis and economic views of the Advisor, and are provided solely for the purpose of information, instruction and discourse. Please see periodic remarks on the Fund Notes and Commentary page for discussion relating specifically to the Hussman Funds and the investment positions of the Funds. --- The foregoing comments represent the general investment analysis and economic views of the Advisor, and are provided solely for the purpose of information, instruction and discourse. Prospectuses for the Hussman Strategic Growth Fund, the Hussman Strategic Total Return Fund, the Hussman Strategic International Fund, and the Hussman Strategic Dividend Value Fund, as well as Fund reports and other information, are available by clicking "The Funds" menu button from any page of this website. |
|||||||||||||||||||||||||
|
For more information about investing in the Hussman Funds, please call us at
1-800-HUSSMAN (1-800-487-7626) 513-326-3551 outside the United States Site and site contents © copyright Hussman Funds. Brief quotations including attribution and a direct link to this site (www.hussmanfunds.com) are authorized. All other rights reserved and actively enforced. Extensive or unattributed reproduction of text or research findings are violations of copyright law. Site design by 1WebsiteDesigners. |