|
|
||||||
|
|

July 3, 2017 Mesas, Valleys, Plateaus, and Cliffs In the Navajo Oljato-Monument Valley, along the Utah-Arizona border, a set of mesa formations rises up from the desert. These mesas are defined by high plateaus that tower above the ground, with vertical cliffs defining each side.
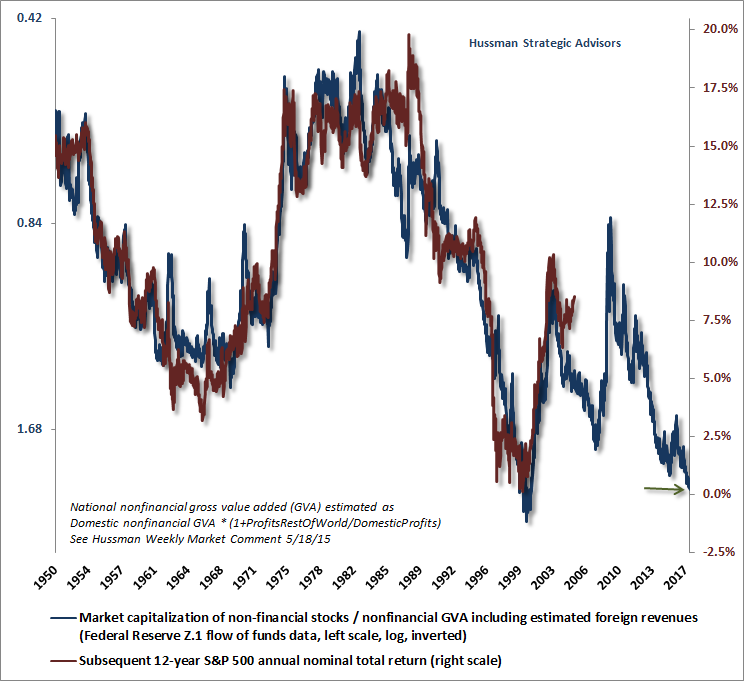
In recent decades, we’ve seen the same kind of mesa formations in the equity market; points where historically extreme valuation bubbles temporarily draw S&P 500 10-year returns well above levels that would have been projected on the basis of valuations a decade earlier, with vertical plunges taking returns back to earth as valuations are restored. Modest patterns like that are normal, but at the 2000 valuation extreme, and again today, they have been taken to levels that history will remember as monuments to speculative recklessness. From the standpoint of market valuations, we know that the autocorrelation profile (the correlation between current valuations and valuations at future dates) tends to hit zero at about 12 years. As a result, reliable valuation measures are typically strongly correlated with actual subsequent market returns over a 12-year horizon, even if they have less impact on market returns during occasional speculative episodes. The chart below illustrates this using the ratio of nonfinancial market capitalization to corporate gross value-added (including estimated foreign revenues), which we find better correlated with actual subsequent S&P 500 total returns than any other indicator. MarketCap/GVA is shown in blue on an inverted log scale. The red line shows actual S&P 500 12-year average annual nominal total returns. Presently, we associate current valuations with prospective S&P 500 12-year returns of roughly zero, coupled with the likelihood of a 50-60% interim market loss.
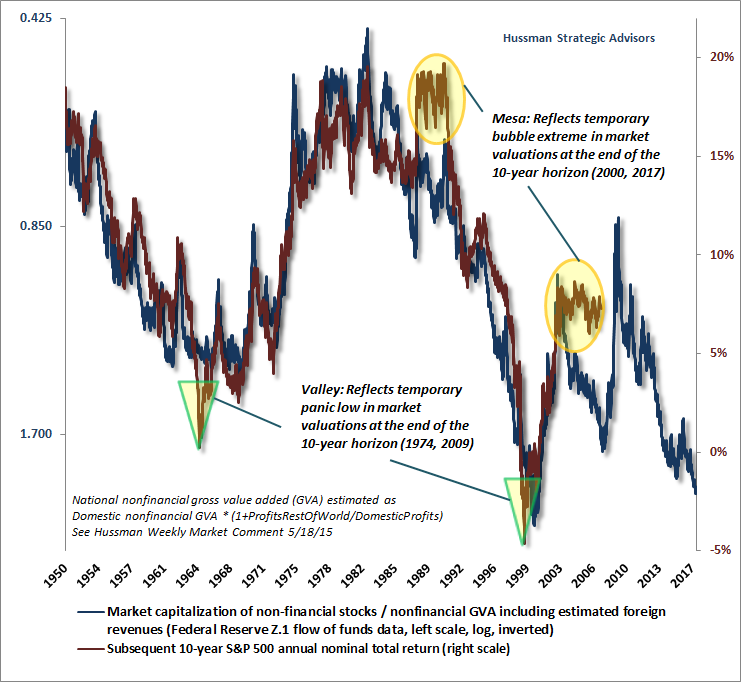
Recall that interest rates do not affect the arithmetic here. Now, that doesn't mean that interest rates can't affect valuations. Rather, it means that once a given level of valuations is established, interest rates don't change the arithmetic that maps those valuations to expected future market returns. Given any level of valuations, one can estimate prospective market returns from valuations directly, and then those prospective returns can be compared with interest rates if one wishes to do so. See The Most Broadly Overvalued Moment in Market History for more detail on asset pricing; particularly the form, reliability, and magnitude of the relationship between valuations and interest rates. One of the reasons investors abandon their attention to valuations at bubble extremes, unfortunately, is that valuations often don’t seem to “work” over shorter horizons. I discussed this issue in the context of our use of market internals in When Valuations Don’t Seem To “Work”. Still, the mapping between valuations and actual subsequent market returns is very tight on a 10-12 year horizon. The exception is when market valuations at the end of a given horizon are at a bubble extreme or a panic trough. Let's shorten our horizon to 10 years to see the effect of these temporary valuation extremes. Suppose, for example, that valuations begin a 10-year period at a level that has generally been associated with actual subsequent market returns of about 10% annually. But over the following decade, valuations move to the most extreme point in history. Clearly, the actual market returns looking back over that decade are likely to be much greater than 10%. But rather than extrapolating their good luck at that point, investors should actually be braced for trouble, in two forms. One is the potential for a vertical collapse in valuations over the completion of the market cycle at hand, and the other is the likelihood of poor future long-term returns, as measured from the point of overvaluation. Conversely, suppose that valuations at the end of a given 10-year horizon happen to represent a panic low in the market. In that case, market returns looking back across the recent 10-year period will be much lower than investors would have projected a decade earlier. But rather than extrapolating their bad luck at that point, investors should be prepared for two benefits; one is a rebound in valuations over the completion of the market cycle at hand, and the other is the likelihood of strong future long-term returns, as measured from the point of undervaluation. The result of all of this is a pattern of “mesas” in the chart of actual market returns, which are associated with points where valuations were offensively elevated at the end of a 10-year horizon; and “valleys” in the chart of actual market returns, which are associated with points where valuations reached panic lows at the end of a 10-year horizon. These deviations are brought back into line by dramatic market collapses or advances. The chart below illustrates this regularity. We are at the far edge of a monumental mesa here, but speculators are ignoring the cliff, assuming that they are on a permanently high plateau. The unfortunate aspect of these mesas and valleys is that they encourage backward-looking investors to believe that projected returns based on “old valuation measures” are no longer relevant, precisely when valuations are most informative about future returns.
By the way, one should not imagine that the red line will simply run into the blue line in a couple of years without the need for a market loss. Rather, both lines will retain the same profile, and can only be expected to meet (as they regularly have in market cycles across history) following a market collapse on the order of 50-60%. As the chart implies, we do expect S&P 500 total returns to average a loss of just over -2% annually over the coming decade, or about -4% excluding dividends, which would place the S&P 500 about 35% below current levels in 10 years (the decade following 1999 was worse). Assuming roughly 5% nominal economic growth over the coming decade, that’s also where historical valuation norms are likely to stand at that point. Remember that while valuations are the main determinant of market returns over a 10-12 year horizon, and of prospective downside risk over the completion of any market cycle, valuations often have very little to do with market returns over shorter segments of the market cycle. Over shorter horizons, the inclination of investors toward speculation or risk-aversion is more important, which we gauge by the uniformity or divergence of market internals across thousands of individual securities and security-types, and based on measures of market overextension (e.g. overvalued, overbought, overbullish syndromes). I’ve openly addressed my own stumble in the advancing half-cycle since 2009, following my insistence on stress-testing our methods against Depression-era data after a market collapse that we fully anticipated. See Being Wrong in an Interesting Way for that narrative, which describes how that stress-testing effort bared an Achilles Heel to a deranged Federal Reserve, and how we later addressed that issue. It may take a more meaningful portion of a market cycle than an extended, hypervalued top-formation to demonstrate the impact of the adaptations we introduced in 2014 (which strengthen our emphasis on measures of market internals in certain environments), but our challenges in this half-cycle were not due to any shortcoming in our measures of valuation. Indeed, I observed in late-2008 that the market had become undervalued on our measures. The problem during the Depression was that valuations similar to those observed at the 2009 low were followed by a further loss of two-thirds of the market's value. Measures of market internals and other factors were critical in order to prevent deep losses and breakneck whipsaws (hence my stress-testing decision once economic losses moved outside of post-war experience and policy makers abandoned Bagehot's Rule in favor of buying toxic assets outright). Those who believe that our challenges in the recent half-cycle are a license to ignore obscene valuations here are likely to regret their failure to study that narrative more closely. Investors should understand that unlike much of the advancing period since 2009, our measures of market internals have deteriorated considerably, which now creates vulnerability that extreme valuations will collapse. The immediacy of our concerns would be deferred if these measures were to improve, but we’ll take that evidence as it arrives. In any event, there is ultimately little way to mitigate the obscene valuations we observe at present without a 50-60% collapse in the S&P 500 Index over the completion of the current cycle. Every deferral of this consequence enables further issuance of low-grade securities to yield-starved investors, at risk-premiums that are unlikely to compensate for likely cumulative default risk. Indeed, companies are issuing junk-rated debt more aggressively than at any point in history, including the years just before the global financial crisis.
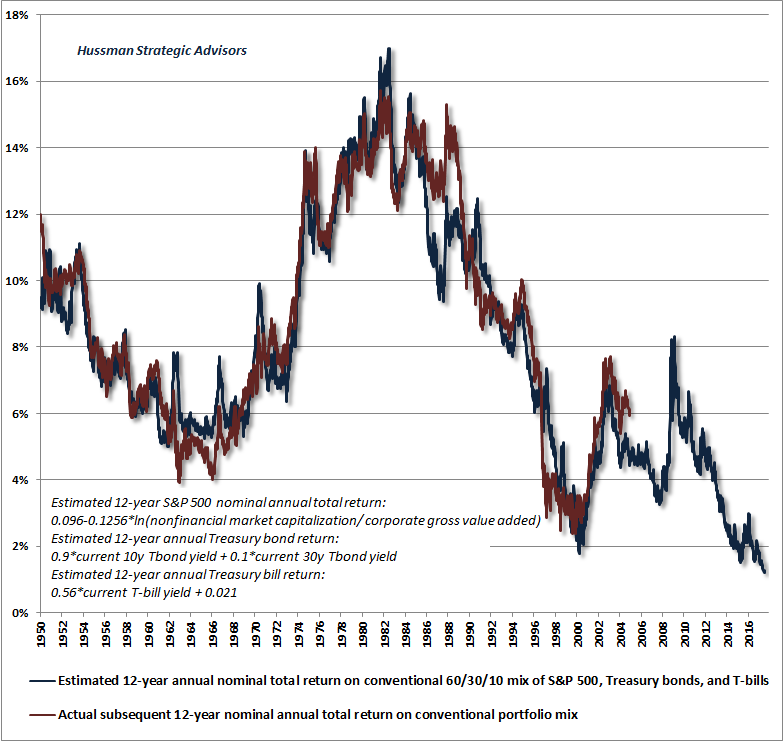
With every attempted stick-save to avoid near-term market risk, long-term systemic risk will only become more damaging. The active rush to be passive A few final notes on what I continue to view as a generational speculative peak. I’ve often described what I call the Iron Law of Valuation: the higher the price investors pay for a given set of expected future cash flows, the lower the long-term investment returns they should expect. As a result, it’s precisely when past investment returns look most glorious that future investment returns are likely to be most dismal, and vice-versa. A week ago, our estimate of prospective 12-year nominal total returns on a conventional portfolio mix of 60% S&P 500, 30% Treasury bonds, and 10% Treasury bills fell to just 1.2% annually, the lowest level in history (blue line). The red line in the chart below shows the actual 12-year annual total return realized on that portfolio mix.
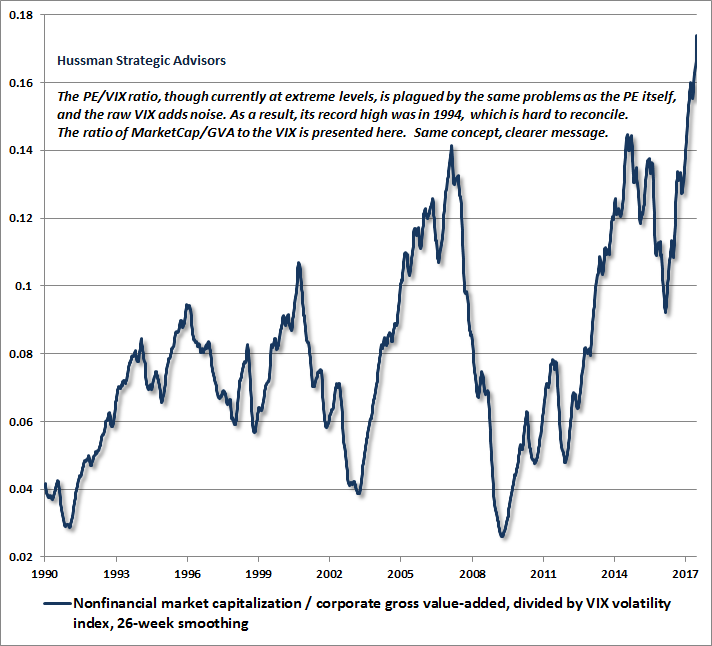
Compressing prospective returns to these depths, and driving prices and market valuations to these extremes, has created a glorious picture in the rear-view mirror. As a result, the level of performance-chasing into passive all-in investment strategies has reached a fever pitch. In the first quarter of this year, Schwab reported a 44% spike in the number of new investment accounts; the highest pace since the 2000 market peak. Given that Schwab serves a large base of financial planners and investment advisors, who in turn manage assets for individual clients, my impression is that this spike is directly related to surging demand for passively managed index funds and low brokerage fees. As I’ve often emphasized, I have no objection to passive investment strategies, provided that those strategies are appropriate to the actual risk-tolerance, temperament, and investment horizon of each investor. Every share of stock that has been issued must be held by someone at every point in time until it is retired, and the most appropriate holders in the next few years will be those who have the risk-tolerance, temperament, and investment horizon to do so. What concerns me is that many investors who are now “discovering” the merits of passive investment, as they did in 2000 and 2007, appear to dramatically overestimate prospective long-term returns that are likely to follow current valuations, and also appear to wholly rule out the downside risks that have historically come hand-in-hand with extreme valuations over the completion of the market cycle. If one limits exposure to market risk here, when does one expand that exposure? From our perspective, the strongest market return/risk profiles we identify emerge at the point where a material retreat in valuations is joined by an early improvement in our measures of market action. My label as a permabear is the inadvertent result of my 2009 insistence on stress-testing our methods against Depression-era data, which truncated our late-October 2008 shift to a constructive outlook (after the market had collapsed by more than 40%), and introduced a particular vulnerability in the face of the Federal Reserve's deranged zero-interest rate policies. Having addressed that vulnerability in 2014, it may be useful to recall that I've encouraged a constructive or aggressive market outlook after every bear market decline in over three decades as a professional investor. For example, in October 1990, I wrote "With the market nearly 20% off its highs, it is rather easy to say that stocks are in a 'bear market.' However, this type of label is simply a snapshot, and says nothing about future prospects for the market... Investors wishing to wait until the Gulf crisis and budget problems are resolved will have to buy at significantly higher prices. Reestablish a 100%, fully invested position." Several months later, I encouraged a leveraged investment outlook. Similar, though less aggressive shifts followed the 2000-2002 collapse and the market plunge in 2008. As value-conscious investors, bubble valuations have often been challenging for us, and there's no question that the difficult narrative following my 2009 insistence on stress-testing derailed the reputation I had established in previous complete market cycles up to that point. But speculators who insist on dismissing concerns about valuations and market risk because of my own challenges in this half-cycle are likely to learn some very hard lessons of their own in the coming years. Those lessons are freely available here and now. In my view, investors are kidding themselves if they dismiss the prospect of near-zero 12-year total returns on a diversified mix of stocks, bonds, and cash, or the prospect of a 50-60% interim loss in the S&P 500 over the completion of the current market cycle. A century of evidence suggests that these outcomes do not represent worst-case scenarios, but are instead fairly run-of-the-mill expectations from current valuation extremes. As I’ve detailed before, even an extended period of suppressed interest rates is unlikely to change this arithmetic, not least because sustained low interest rates are only likely to endure if nominal economic growth persists well below historical norms. Last week, Bob Rodriguez, formerly of FPA Capital, observed “When the markets finally do break, as they always have historically, ETFs and index funds will be destabilizing influences, because fear will enter the marketplace. A higher percentage of assets will be in indexed funds and ETFs. Investors will hit the ‘sell’ button. All you have to ask is two words, ‘To whom?’ To whom do I sell? Index funds and ETFs don’t carry any cash reserves. The active managers have been diminished in size, and most of them aren’t carrying high levels of liquidity for fear of business risk. We are witnessing the development of a ‘perfect storm.’” Meanwhile, the increasing popularity of naked put-writing strategies among retail investors is quietly increasing the implicit volume of selling that could accelerate a downturn. These investors typically have no intent to actually purchase the underlying indices in an amount anything close to the notional value of those short put options. So a growing amount of notional value will tend to add to selling pressure during market declines that send those short put options in-the-money. The current popularity of naked put writing strategies relies on the faith that every dip will be bought. Things can get ugly very fast when that faith proves to be unfounded. In his 1955 book, The Great Crash, economist John Kenneth Galbraith wrote: “Of all the mysteries of the stock exchange there is none so impenetrable as why there should be a buyer for everyone who seeks to sell. October 24, 1929 showed that what is mysterious is not inevitable. Often there were no buyers, and only after wide vertical declines could anyone be induced to bid... Repeatedly and in many issues there was a plethora of selling and no buyers at all.” While we find the ratio of MarketCap/GVA, without any modification, to be powerfully correlated with subsequent long-term S&P 500 total returns, it’s interesting that current valuation extremes are joined by extraordinary complacency among investors, as measured by the CBOE volatility index (VIX, which gauges expected market volatility based on index option prices). Indeed, the willingness of investors to write naked put options is one of the factors that has crushed the VIX below 10% in recent months. One indicator we’ve seen to capture this dangerous setup is based on the ratio of the S&P 500 P/E to the VIX. The problem is that this indicator is plagued by the same problems as the P/E itself, namely that it is heavily affected by swings in profit margins over time. The chart below shows the ratio of MarketCap/GVA to the VIX. Again, this modification doesn’t improve the correlation with long-term returns, but it does illustrate the breathtaking extent to which current valuation extremes have been joined by investor complacency.
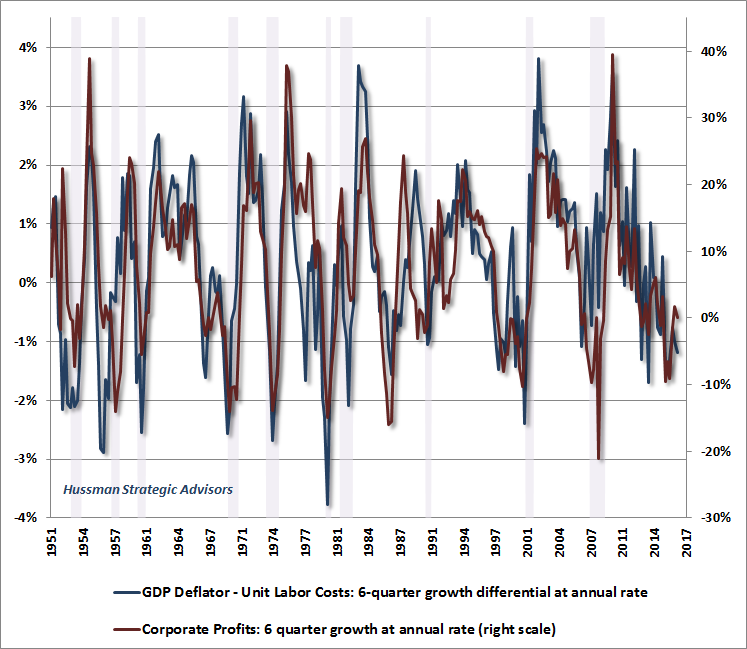
As for profit margins, I’ll reiterate that the record high margins we’ve observed in the recent market cycle have been directly related to the combination of a recovering economy along with wage inflation that fell short of output price inflation due to labor market slack. Put simply, when companies can sell each unit of output at a higher price, relative to the cost of labor embedded in that output, profit margins expand. The chart below illustrates one of our findings in this regard, which is that actual growth in U.S. corporate profits is largely driven by the difference between the growth in economy-wide output prices (measured by the GDP deflator) and unit labor costs (which rise when wage inflation exceeds productivity growth).
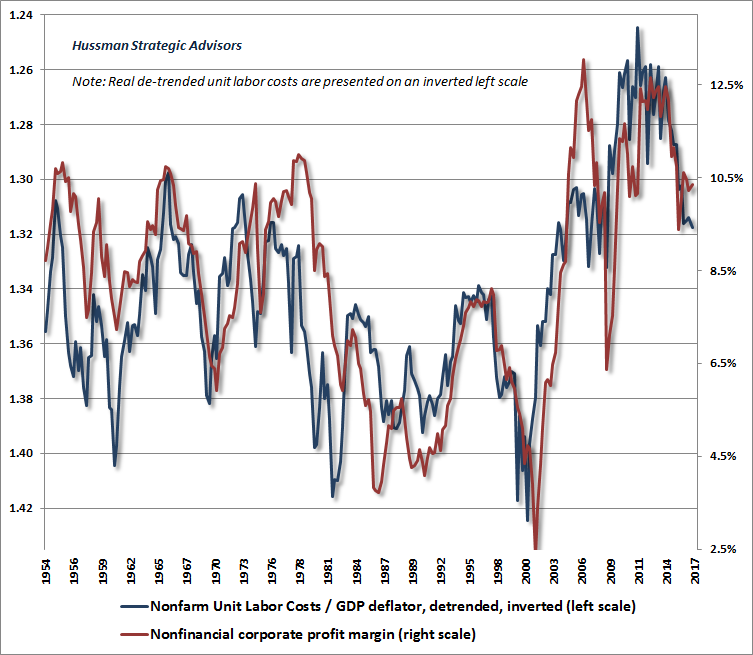
The chart below shows de-trended real unit labor costs versus the level of economy-wide profit margins (for more discussion, see This Time is Not Different, Because This Time is Always Different). The trend has already reversed, yet that reality seems to be entirely overlooked.
The foregoing comments represent the general investment analysis and economic views of the Advisor, and are provided solely for the purpose of information, instruction and discourse. Please see periodic remarks on the Fund Notes and Commentary page for discussion relating specifically to the Hussman Funds and the investment positions of the Funds. --- The foregoing comments represent the general investment analysis and economic views of the Advisor, and are provided solely for the purpose of information, instruction and discourse. Prospectuses for the Hussman Strategic Growth Fund, the Hussman Strategic Total Return Fund, the Hussman Strategic International Fund, and the Hussman Strategic Dividend Value Fund, as well as Fund reports and other information, are available by clicking "The Funds" menu button from any page of this website. |
|||||||||||||||||||||||||
|
For more information about investing in the Hussman Funds, please call us at
1-800-HUSSMAN (1-800-487-7626) 513-326-3551 outside the United States Site and site contents © copyright Hussman Funds. Brief quotations including attribution and a direct link to this site (www.hussmanfunds.com) are authorized. All other rights reserved and actively enforced. Extensive or unattributed reproduction of text or research findings are violations of copyright law. Site design by 1WebsiteDesigners. |