|
|
||||||
|
|

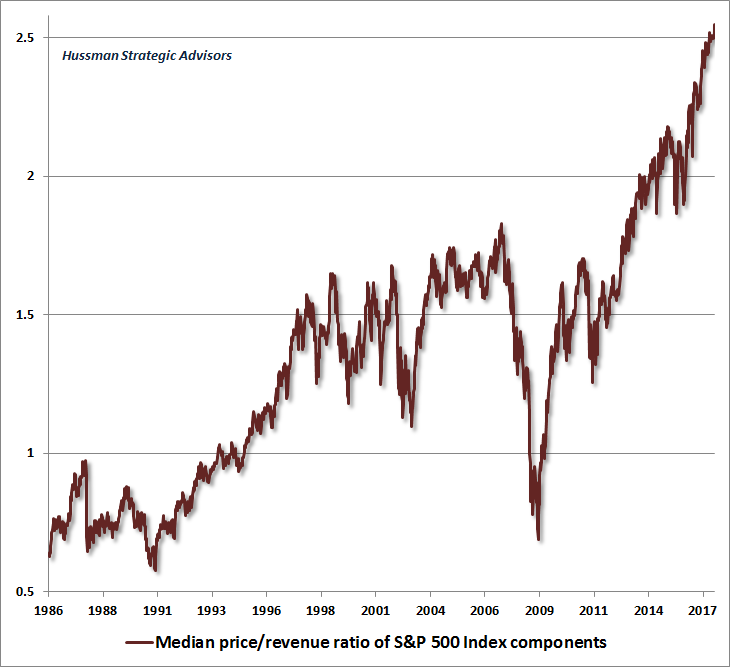
August 7, 2017 Estimating Market Losses at a Speculative Extreme “Investors have turned the market into a carnival, where everybody ‘knows’ that the new rides are the good rides, and the old rides just don’t work. Where the carnival barkers seem to hand out free money for just showing up. Unfortunately, this business is not that kind - it has always been true that in every pyramid, in every easy-money sure-thing, the first ones to get out are the only ones to get out... One of the things that you may have noticed is that our downside targets for the market don’t simply slide up in parallel with the market. Most analysts have an ingrained ‘15% correction’ mentality, such that no matter how high prices advance, the probable maximum downside risk is just 15% or so (and that would be considered bad). Factually speaking, however, that’s not the way it works... The inconvenient fact is that valuation ultimately matters. That has led to the rather peculiar risk projections that have appeared in this letter in recent months. Trend uniformity helps to postpone that reality, but in the end, there it is... Over time, price/revenue ratios come back into line. Currently, that would require an 83% plunge in tech stocks (recall the 1969-70 tech massacre). The plunge may be muted to about 65% given several years of revenue growth. If you understand values and market history, you know we’re not joking.” - John P. Hussman, Ph.D., Hussman Econometrics, March 7, 2000 The S&P 500 followed by losing half of its value by October 2002, while the tech-heavy Nasdaq 100 lost an oddly precise 83%. Last week, the median price/revenue ratio of S&P 500 component stocks reached the highest level in history, advancing far beyond the levels reached at both the 2000 and 2007 market peaks.
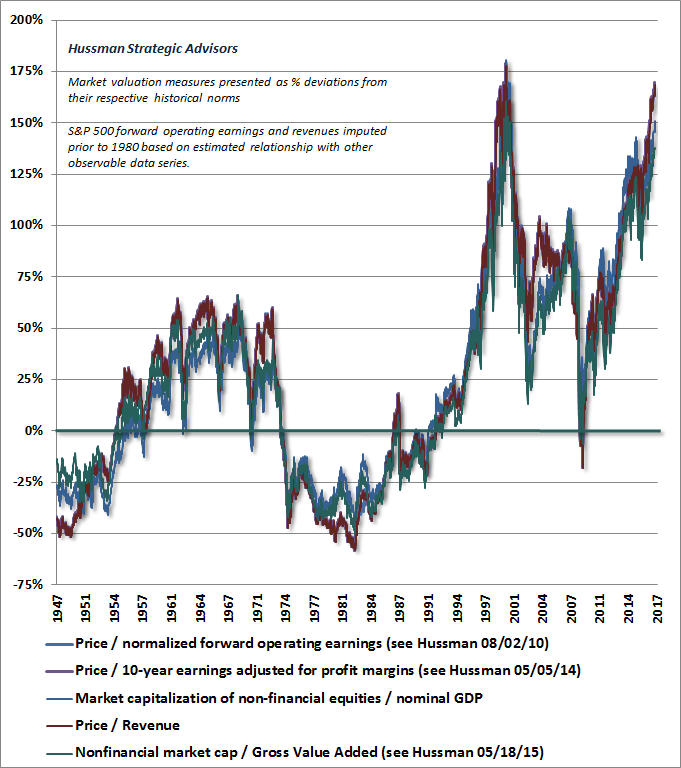
This extreme in median valuations may seem strange. The most reliable market valuation measures we identify (those most strongly correlated with actual subsequent S&P 500 10-12 year total returns) now exceed every point in history except the extreme reached in the single week of the final high March 24, 2000. But it's clear from the chart below that these measures are not beyond 2000 levels like median valuations are.
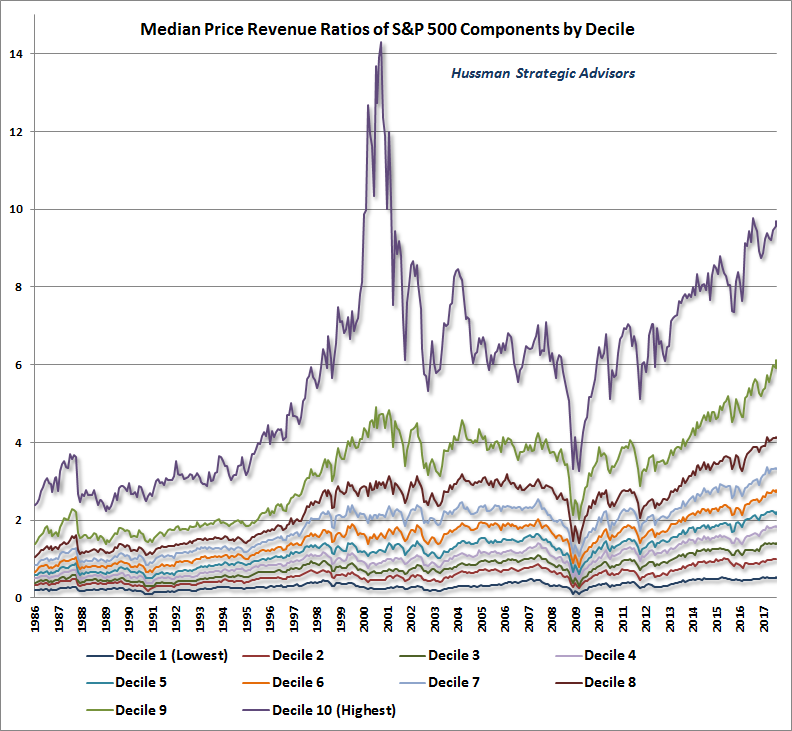
What's going on? We can understand the difference between these valuation measures by breaking the component stocks of the S&P 500 into deciles based on their price/revenue ratios. Importantly, being in a high decile doesn’t necessarily imply that a given stock is overvalued, and being in a low decile doesn’t necessarily imply that a given stock is undervalued. For example, technology and medical companies will often dominate high price/revenue deciles, while retail and industrial stocks will often dominate the lower deciles, and it’s not necessarily true that lower deciles perform better than higher deciles, taken as a group. Rather, what matters most for the likely subsequent returns and downside risks of each decile is its level of valuation relative to its own respective history. Below is an update of the chart I presented late last year in Sizing Up the Bubble. A note of thanks to Russell Jackson, our resident math guru, for compiling all of this data.
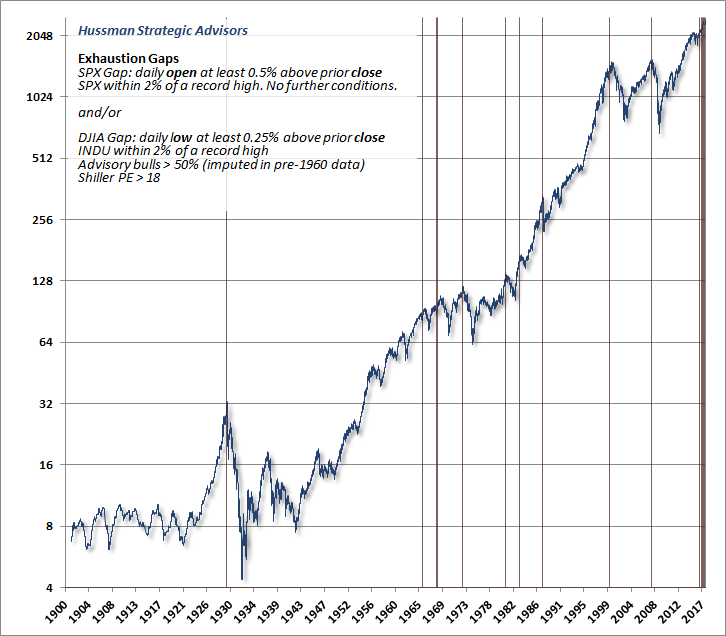
Notice that the distinction between today and the 2000 peak is in the breadth of overvaluation across individual stocks. Back in 2000, the most extreme speculation was centered on a fraction of all stocks, largely representing technology, and accounting for a large proportion of the total market capitalization of the S&P 500 Index. Look at the valuation of each decile relative to its own history. As of last week, with the exception of the richest decile of stocks, where median valuations were higher only during the January 2000-March 2001 period (followed by median losses exceeding -80% for those stocks), every decile of S&P 500 components is currently at or within 2% of its most extreme valuation in history. At the March 2000 bubble peak, an understanding of market history (including the outcomes of prior speculative episodes) enabled my seemingly preposterous but accurate estimate that large-cap technology stocks faced potential losses of approximately -83% over the completion of the market cycle. At the same time, however, the prospective loss for the least expensive half of S&P 500 component stocks was only about -25%. That difference allowed investors to avoid much of the damage from the 2000-2002 market collapse, provided they were not heavily invested in technology stocks, and were willing to deviate considerably from a capitalization-weighted portfolio. At the 2007 market peak, by contrast, stocks were generally overvalued enough to indicate prospective losses of about -55% for all but the very lowest price/revenue decile. That risk was realized in the form of widespread and indiscriminate losses across all sectors during the market collapse that followed, even though financial stocks were hardest hit. By the 2009 market low, all ten price/revenue deciles ended the cycle at multiples below their respective historical norms. In my view (supported by a century of market cycles across history), investors are vastly underestimating the prospects for market losses over the completion of this cycle, are overestimating the availability of “safe” stocks or sectors that might avoid the damage, and are overestimating both the likelihood and the need for some recognizable “catalyst” to emerge before severe market losses unfold. We presently estimate median losses of about -63% in S&P 500 component stocks over the completion of the current market cycle. There is not a single decile of stocks for which we expect market losses of less than about -54% over the completion of the current market cycle, and we estimate that the richest deciles could lose about -67% to -69% of their market capitalization. As in 2000 and 2007, investors are mistaking a wildly reckless world for a permanently changed one, and their reeducation in the concept that valuations matter is likely to be predictably brutal. Unwinding the excess An important caveat here - as I noted back at the 2000 peak, our downside targets for the market don’t simply slide up in parallel with the market. We know that even in market cycles that have featured quite low interest rates, valuations regularly normalize and often substantially breach historical norms over the completion of the cycle. The most incomplete reversion was at the October 2002 low, where our most reliable measures ended the cycle between 25% and 40% above their norms, though all of them later broke below those norms by the March 2009 low. Given present valuations, even a cycle completion ending with valuations in the same elevated range as the 2002 low would imply a market loss between -48% and -54%. It’s important to recognize that the current combination of offensive valuations, divergent market internals, lopsided sentiment, overbought conditions and other factors are jointly consistent with a fairly immediate onset of severe market losses over the completion of the current cycle. Still, short-term outcomes are always dependent on the psychological inclination of investors toward speculation or risk-aversion, and a shift back to uniform market internals and indiscriminate risk-seeking can never be ruled out. The negative full-cycle and 10-12 year implications of these offensive valuations would not be relieved in that event. A more extended period of speculation would instead magnify prospective losses over the completion of this cycle, while temporarily reinforcing the belief that stocks are the permanent beneficiaries of some brave new world where, as one analyst on CNBC actually suggested last week, “the bull market could continue to forever.” Because “this time is different!” Look. The models that central bankers use are not somehow classified or hidden from the economics profession, nor has the discipline been deprived of the ability to examine the often weak empirical evidence behind them (see for example Failed Transmission: On the Futility of Activist Fed Policy and How To Wind Down a $4 Trillion Balance Sheet). Central banks possess no concealed, mysterious knowledge that is somehow obscure to mortals. If anything, one might question whether some FOMC governors have ever carefully examined historical data at all, given that many of their propositions can be refuted by even the most basic scatterplot. Among the most persistent misconceptions are 1) that unemployment is closely related to inflation in general prices, when the true relationship is with real wage inflation; 2) that activist policy deviations, away from levels that can be systematically determined using available non-monetary data, have any economically meaningful correlation at all with subsequent economic improvements; 3) that “wealth” is embodied in the paper price of a security rather than the stream of future cash flows that are actually generated and delivered to investors over time as the result of productive activities, and; 4) that episodes of yield-seeking speculation, and the systemic collapses that follow, can be dismissed as the result of outside forces, for which the Fed bears no responsibility. One thing should be clear: policy makers have not become “smarter.” What they have become, with each bubble-crash cycle, is more reckless and arrogant in their willingness to extend speculative financial conditions by encouraging yield-seeking, compressing prospective future investment returns, amplifying the destructive consequences that inevitably result, and ironically, using those same consequences to justify fresh intervention. I certainly accept my own responsibility for underestimating 1) the jaw-dropping lengths of central bank recklessness in this half-cycle; 2) the ability of yield-seeking speculation to defer the implications of even the most extreme “overvalued, overbought, overbullish” conditions, and; 3) the importance of prioritizing the uniformity of market internals in a zero-interest rate environment (see Being Wrong in An Interesting Way to understand the reason for our challenges in the recent advancing half-cycle, and how we addressed them). Still, no amount of criticism of my inadvertent stumble in this advancing half-cycle will actually help investors to avoid a market collapse as this cycle is completed, which a century of market history suggests is now baked-in-the-cake. It’s equally clear that investors have forgotten just how useless the Federal Reserve’s persistent and aggressive easing was through the entire course of the 2000-2002 and 2007-2009 market collapses. Somehow, they will be shocked when the identical outcome unfolds yet again. Learn this now: when investors become risk-averse, safe liquidity is viewed as a desirable asset, not an inferior one, so creating more of the stuff doesn’t encourage yield-seeking speculation. The unwinding of the accompanying excesses in the credit cycle may also be profound. Nonfinancial debt as a fraction of corporate revenues is now easily at the highest level in history. As of June, a record 72.5% of the U.S. leveraged loan market (loans to already highly indebted borrowers) was comprised of “covenant lite” loans, offering little protection to creditors in the event of bankruptcy. In 2016, a record $875 billion of these loans were issued. The situation in Europe is even worse, where 72.8% of loan volume is now covenant lite. As a side note, I’ll add that investors’ “fear of missing out” is becoming increasingly evident in the tendency for “gap” movements in the major indices, particularly the Dow Industrials over the past few weeks. Most of the gaps this year have emerged within 5% of current levels (with the earliest one in this half-cycle within about 10%). That’s the typical distance between these gaps and the final highs, though that regularity should not be taken as a forecast. The chart below updates the one presented in our May 1, 2017 comment, Exhaustion Gaps and the Fear of Missing Out.
For our part, despite all of these conditions, a fresh shift toward uniformity across market internals would be a signal of increased and indiscriminate risk-seeking, and could defer the immediacy of our own downside expectations, though not the extent of expected market losses over the completion of the cycle. Presently, I can’t get the Boz Scaggs song “Breakdown Dead Ahead” out of my mind (take a minute to appreciate the scorching, watertight drum and guitar tracks by Rick Marotta and Steve Luthaker). I should also observe that while we’re sympathetic to the view that valuations across international stocks are less extreme than those of the U.S., investors can demonstrate to themselves that in periods where the U.S. markets lose value, international stocks generally amplify those losses instead of acting as a source of diversification. Adhering to a historically-informed, value-conscious, full-cycle discipline remains essential. Aside from limited-duration bond market exposure and perhaps modest exposure to precious metals shares, my impression is that the appropriate strategy is not to seek investment vehicles that are exposed to some specific or arcane type of market risk. Rather, the appropriate strategy is to recognize that the exposure to risk is treated much better in some periods and market conditions than in others, and that leaning to a very low-risk position can be quite acceptable, particularly when extreme valuations are joined with deteriorating market internals. Notably, our measures of market internals deteriorated further last week, and the divergences are becoming evident in fairly obvious ways, as about 40% of U.S. equities have now declined below their respective 200-day moving averages Not surprisingly, I believe that investors should lean toward disciplines that are presently tightly hedged or defensive, but also have the ability to substantially increase their market exposure in response to a material retreat in valuations (particularly when that retreat is joined by early improvement in the uniformity of market action across a broad range of securities and asset classes). I fully recognize that during a period of reckless speculation, substantial but temporary rewards are often available to those that embrace the most reckless behavior. Still, I’ve correctly anticipated the collapses of prior speculative episodes, and the likely extent of the accompanying market losses. Our discipline has adapted in ways that will better tolerate extreme valuations in future periods where market internals remain generally favorable. Meanwhile, despite our challenges in the advancing portion of this bubble, the cycle isn’t over till it’s over. I’ve learned that the criticism of “being defensive too early” has little bite by the time a collapse wipes out 7-14 years of market returns (in excess of Treasury bill returns), as the 2000-2002 and 2007-2009 declines did. I have every expectation that the completion of the current cycle will do the same. Having established a constructive or leveraged market outlook after every bear market decline in over three decades as a professional investor, I am equally convinced that there will be strong investment opportunities on the other side.The foregoing comments represent the general investment analysis and economic views of the Advisor, and are provided solely for the purpose of information, instruction and discourse. Please see periodic remarks on the Fund Notes and Commentary page for discussion relating specifically to the Hussman Funds and the investment positions of the Funds. --- The foregoing comments represent the general investment analysis and economic views of the Advisor, and are provided solely for the purpose of information, instruction and discourse. Prospectuses for the Hussman Strategic Growth Fund, the Hussman Strategic Total Return Fund, the Hussman Strategic International Fund, and the Hussman Strategic Dividend Value Fund, as well as Fund reports and other information, are available by clicking "The Funds" menu button from any page of this website. |
|||||||||||||||||||||||||
|
For more information about investing in the Hussman Funds, please call us at
1-800-HUSSMAN (1-800-487-7626) 513-326-3551 outside the United States Site and site contents © copyright Hussman Funds. Brief quotations including attribution and a direct link to this site (www.hussmanfunds.com) are authorized. All other rights reserved and actively enforced. Extensive or unattributed reproduction of text or research findings are violations of copyright law. Site design by 1WebsiteDesigners. |