|
|
||||||
|
|

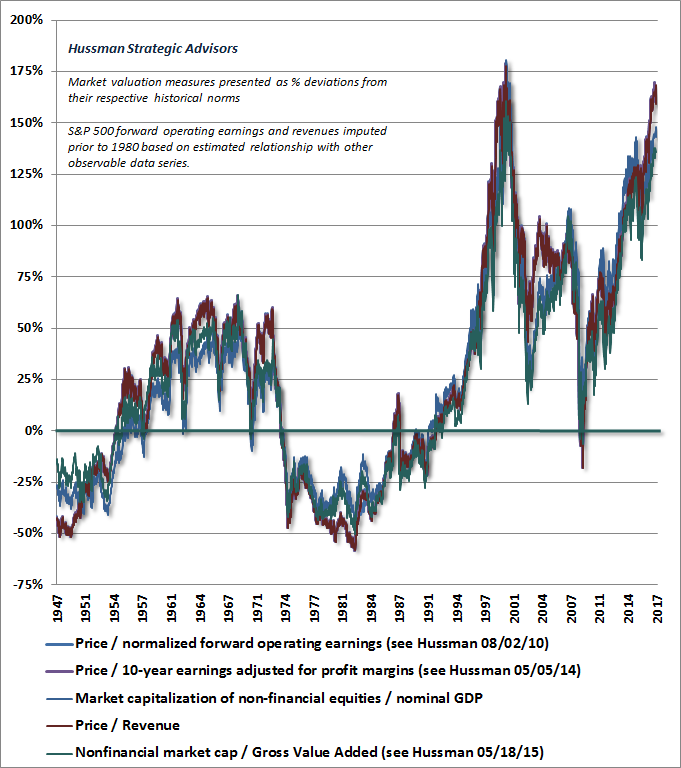
September 11, 2017 Behind the Potemkin Village There’s an apocryphal story that in 1787, during the journey of Empress Catherine II to Crimea, Prince Grigory Potemkin, the governor of the region, erected fabricated villages along the Dnieper River, which would be disassembled after she passed by, and rebuilt again downstream overnight. When one examines the collapses of the tech bubble and the housing bubble, it’s evident that one of the central elements of those collapses was the gradual recognition by investors that the overvalued pieces of paper they were holding were actually little Potemkin Villages; temporarily glorious and impressive on the surface, but backed by much less than investors had imagined was there. What sort of “catalyst” is needed for a Potemkin Village or a Ponzi scheme to disappoint? Only the gradual or sudden discovery of the reality behind it: the recognition that there is no “there” there. Investors presently appear to be taking past investment returns and economic growth at face value, without considering their underlying drivers at all. My impression is that while the U.S. may very well encounter credit strains or other economic dislocations in the coming years, nothing is actually required for yet another equity market collapse except the gradual recognition by investors of a reality that already exists. Strip away the effects of short-term cyclical factors that have now been largely exhausted, and it becomes clear that the financial markets have again become a Potemkin Village. I’ve previously detailed the argument that if interest rates are low because growth is also low, no increase in market valuation is “justified” at all by the lower interest rates, and yet future returns on stocks will be commensurately lower anyway (see the Geek’s Note in Valuations, Sufficient Statistics, and Breathtaking Risks to understand this from the standpoint of discounted cash flows). In that situation, elevating market valuations results in a reduction of prospective stock market returns by a far greater amount than interest rates have been reduced. Market returns don’t just emerge from nowhere. They are driven by the sum of three factors: growth in fundamentals, income from cash distributions, and changes in valuations (the ratio of prices to fundamentals). Since 1960, for example, the S&P 500 has enjoyed an average rate of return of about 10% annually, which derives from three main components: growth in earnings (and the overall economy) averaging about 6.3% annually, dividend income averaging about 3.0% annually, and a gradual increase in price/earnings multiples that has contributed about 0.7% annually to total returns. One can also make a similar attribution using other fundamentals. For example, the 10% annual total return of the S&P 500 since 1960 also derives from growth in S&P 500 revenues averaging 5.7% annually since the 2000 peak, dividend income averaging about 3.0% annually, and a much steeper increase in the S&P 500 price/revenue ratio contributing 1.3% annually (taking the current price/revenue multiple to the same level observed at the 2000 market peak). Consider these drivers today. Combining depressed growth prospects with an S&P 500 dividend yield of just 2.0%, the likelihood is that over the coming 10-12 years, even a run-of-the-mill reversion of valuations will wipe out the entire contribution of growth and dividend income, resulting in zero or negative total returns in the S&P 500 Index on that horizon, with an estimated interim market loss on the order of -60%. Here are the facts: over the past several decades, due to a combination of demographic factors and persistently slowing productivity growth, the core drivers of real U.S. GDP growth have declined toward just 1% annually, with a likely decline below that level in the coming 10-12 years. Indeed, in the absence of any recession, U.S. nonfarm productivity growth has averaged just 0.8% annually since 2010 and 0.6% over the past 5 years, while the U.S. Bureau of Labor Statistics estimates labor force growth of just 0.3% annually in the coming years (which would be matched by similar growth in employment only if the unemployment rate does not rise from the current level of 4.3%). Add 0.6% to 0.3%, and the baseline expectation for real GDP growth is just 0.9%. Nominal growth is likely to be similarly weak. While S&P 500 earnings growth has slightly outpaced revenue growth over the past two decades because of rising profit margins, recent record profit margins have now stagnated and have begun to retreat, resulting in the likelihood that earnings growth will match (at best) or even lag, overall economic growth in the years ahead. At the same time, the valuation measures we find most reliably correlated with actual subsequent S&P 500 total returns now average between 150-170% above historical norms that they have approached or breached by the completion of every market cycle in history. For a review of the historical reliability of these measures and popular alternatives, see the table in Exhaustion Gaps and the Fear of Missing Out.
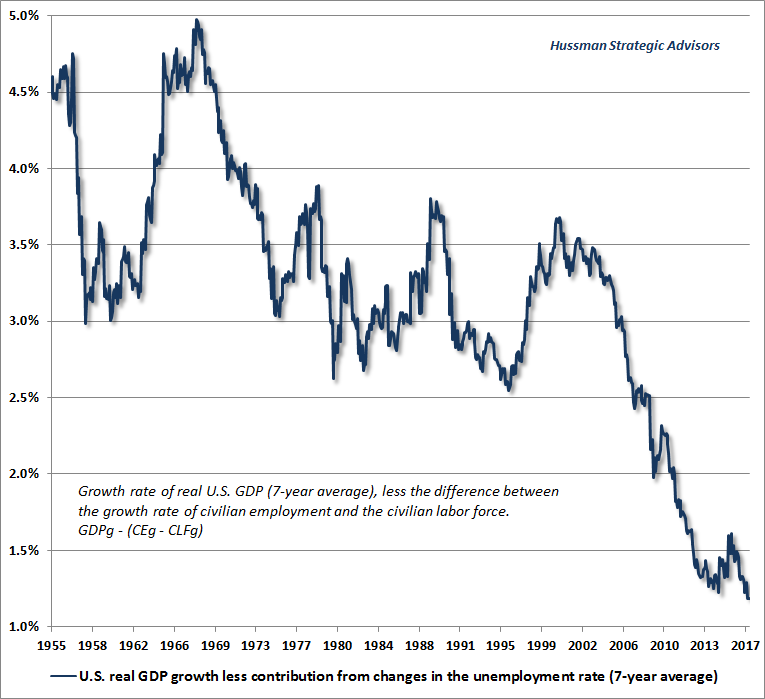
What if inflation bursts durably higher? Wouldn’t one expect higher future nominal returns over the long-term? The answer is yes, but the present valuation premium would still not be justified. Rather, as we observed in the mid-1970’s, the likely first response of the market would be for valuation multiples to surrender their premium, and possibly move to a substantial discount, after which higher long-term returns would emerge. So inflation or no inflation, I don’t expect that any plausible economic outcome will prevent a wholesale market collapse over the completion of the current cycle. Keep in mind that even if the most reliable valuation measures we identify were to move from 170% above their historical norms to still 35% above those norms, the move would imply a -50% market loss (as we observed in both the 2000-2002 and 2007-2009 cycle completions). The longer-term effect of that normalization would be to subtract about -6.7% from 10-year S&P 500 total returns, and about -5.6% from 12-year total returns (subtracting -9.5% and -7.9%, respectively, if valuations were actually to visit their historical norms 10-12 years from now, even if they never move below those historical norms again). Add in about 2% of dividend income, and a few percent in nominal growth, and the market would still be struggling to claw out 10-12 year total returns of zero. Behind the Potemkin Village It’s tempting to imagine that the market returns of recent years, in the face of already extreme valuations, are somehow evidence that valuations no longer matter, and that underlying drivers are no longer necessary. But investment returns can be broken down into components. The reason that investors don’t recognize the dismal condition of core economic drivers, or the drivers of long-term investment returns, is that they remain dazzled by shorter-term cyclical factors, including the effects of their own speculation. Make no mistake: the main contributors to the illusion of permanent prosperity have been decidedly cyclical factors. These include 1) a decline in the U.S. unemployment rate from 10.0% in 2009 to a low of 4.3% in July of this year; 2) an expansion in equity market valuations from levels easily below their historical norms in 2009 to levels that, on the most reliable measures we identify, now stand 150-170% above their historical norms, and are rivaled only by the final extremes of the 2000 bubble peak; and 3) a widening of profit margins, driven by weak growth in labor costs in the face of high unemployment after the global financial crisis, and which is already reversing in the face of much lower unemployment today. Let’s take a look at the data, and the barren fields behind this Potemkin Village may be more apparent. Recall that real U.S. GDP growth is driven by two factors: growth in the number of employed workers, plus growth in output per worker (productivity). Of course, growth in the number of employed workers itself has two drivers: the underlying growth rate of the labor force (largely determined by population growth and demographic factors), and cyclical changes in the fraction of the labor force that is actually employed (the remaining fraction is measured by the unemployment rate). The first chart is one I presented last week. To illustrate the underlying drivers of economic growth, the chart below shows the 7-year average growth rate of real GDP, excluding the impact of fluctuations in the unemployment rate. I’ve chosen a 7-year lookback, specifically to exclude the impact of the global financial crisis from the latest data point. At a 4.4% unemployment rate, future economic growth is unlikely to benefit from substantial further retreat in unemployment. Without that contribution, it should be clear that the underlying drivers of U.S. economic growth, even during the recent economic recovery, have never been weaker.
The chart below shows the trajectory of nominal growth from the standpoint of nonfinancial corporate revenues, including estimated foreign revenues. The fundamental drivers of U.S. corporate revenues have declined progressively in recent decades and have never been weaker. This fact may not be evident to investors, but as it becomes clear, it will contribute to a psychology of “growth despair” that will ultimately form the basis for the next bear market low. I’ve previously discussed economic policies that could improve long-term outcomes over a period of decades, but for the completion of the present market cycle, there is no fix. Extraordinarily negative outcomes are baked in the cake.
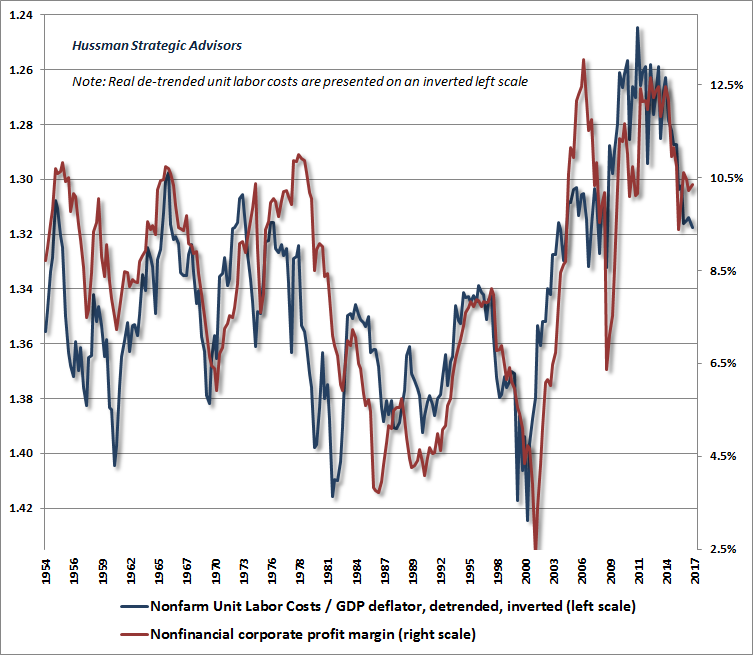
Again, when interest rates are low because growth is also low, no valuation premium is “justified” at all. In the present environment, investors are inviting disastrous losses by paying the highest S&P 500 price/revenue ratio in history (outside of the single week of the 2000 market high) and the highest median price/revenue ratio in history across S&P 500 component stocks (more than 50% beyond the 2000 peak, because extreme valuations in that episode were focused on much narrower subset of stocks than at present). Glorious past returns and record valuations are a Potemkin Village with a barren field behind it. From an earnings standpoint, growth in earnings requires some combination of growth in revenues and expansion in profit margins. Presently, profit margins are near the highest levels in history, but have begun to contract, reflecting a gradual increase in labor costs relative to productivity growth. There will undoubtedly be fluctuations in these components from quarter to quarter, but at a 4.4% unemployment rate, the absence of labor cost pressures should not be assumed to persist, as if unemployment was still above 10%.
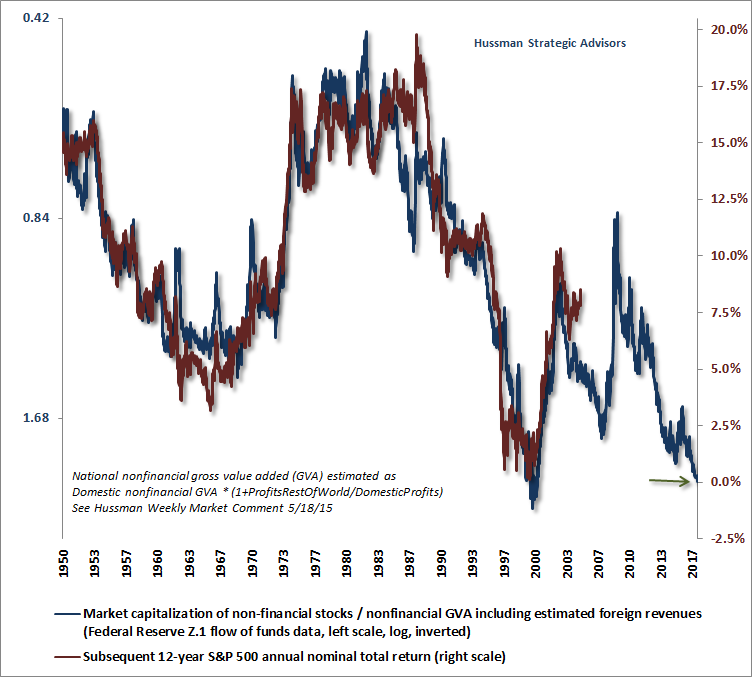
The bottom line is that we presently observe some of the most offensive equity market valuations in history, coupled with deterioration in the underlying drivers of long-term growth. The chart below shows the most historically reliable valuation measure we identify (nonfinancial market capitalization to corporate gross value-added, including estimated foreign revenues) on an inverted log scale, along with the actual subsequent S&P 500 average annual nominal total return over the following 12-year period (red line, right scale). Even if we were to assume historically normal future economic growth rates, we would still anticipate zero total returns for the S&P 500 over the coming 12-years, with a likely interim loss on the order of -60%. Frankly, my concern is that a zero total return over the coming 12-years may be optimistic, because even if both interest rates and growth rates remain several percent historical norms, a zero total return would require investors to maintain a valuation premium that is actually unwarranted.
Let’s be clear. It has taken the third financial bubble in 17 years to bring the total return of the S&P 500 since the 2000 peak to just 4.8% annually, all of which we expect to be wiped out over the completion of the current market cycle. Even if investors are lucky, and valuations reach yet another bubble extreme 10-12 years from today, the annual total return of the S&P 500 between now and then is likely to be even lower than the 4.8% return since 2000, because the underlying economic drivers have deteriorated further. In my view, it’s substantially more probable that investors 10-12 years from now will find the S&P 500 Index at a lower level than it is today, with the average portfolio struggling to get back to zero from deeply negative interim losses. A note on unemployment and inflation From the standpoint of unemployment and general price inflation, it’s useful to emphasize once again that the so-called “tradeoff” between the two is a wholesale misinterpretation of both economic theory and historical data. There is no such tradeoff. Recall that the title of the famous 1958 paper by A.W. Phillips was “The relation between unemployment and the rate of change of money wage rates in the United Kingdom, 1861-1957.” Recall also that during most of that period, the United Kingdom was on the gold standard, and the rate of general price inflation was very well-behaved. Finally, recall that Phillips explicitly excluded periods from his analysis that included what he described as large “cost of living adjustments” in the general price level. Given those observations, I’ve regularly argued over the years that the true “Phillips Curve” that A.W. Phillips originally identified is actually a scarcity relationship between unemployment and real wages, not general prices. Put simply, when labor is scarce, the price of labor rises relative to the prices of other things, and when labor is plentiful, its price falls relative to the prices of other things. From my perspective, the main reason to normalize the Federal Reserve’s balance sheet is not because low unemployment creates inflation risk. Rather, the main reason for normalization is to limit further distortion and ultimate economic fallout from yet another round of Fed-encouraged yield-seeking speculation (even broader than the preceding episode, which ended in the worst economic crisis since the Great Depression). Given the weak fundamental drivers of long-term economic growth, it’s quite reasonable for interest rates to be lower now than in the past (though there is no reason, given that interest rates and growth prospects are both depressed, that stocks deserve a valuation premium as a result). But even allowing for weak expected economic growth, the Fed’s balance sheet is still double the size that would actually be required to sustain short-term interest rates of just 2% (without the need to pay interest on reserves). The Fed has done nothing but to maintain a pool of low-interest hot potatoes that has now encouraged one of the three most extreme episodes of financial speculation in U.S. history. As for unemployment and inflation, the charts below show the relationship between the two from the standpoint of joint correlation. The first chart below shows the correlation between unemployment and the rate of CPI inflation. You’ll notice that unemployment does not reliably produce opposite movements in general price inflation at all. Indeed, the correlation between the two is uniformly positive: higher unemployment is associated with higher inflation. The relationship is also a lagging relationship, where high unemployment tends to follow periods of high inflation, and low unemployment tends to follow periods of low inflation. In my view, this relationship doesn’t reflect cause-and-effect, but rather the lagging behavior of unemployment in the business cycle. The general tendency here is that periods of elevated inflation are often followed by recessions, and recessions are often followed by lower inflation. Since unemployment is one of the most lagging economic series available, the result is that high unemployment appears to follow elevated inflation with a substantial lag (typically peaking more than two years later), and low unemployment appears to follow low inflation with a substantial lag.
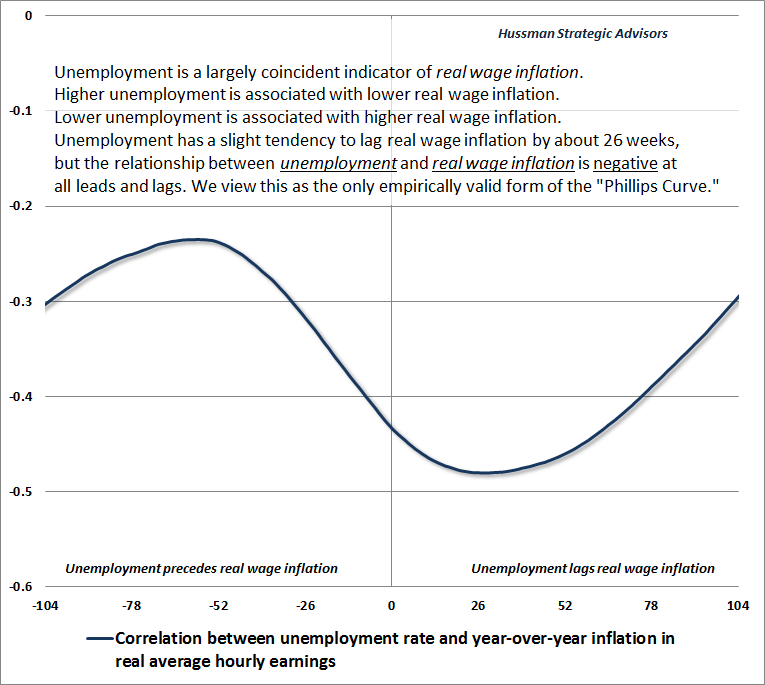
You certainly won’t get much benefit from trying to predict inflation using the unemployment rate. Better leading indicators of inflation include year-over-year nominal GDP growth, and the year-over-year percentage change in gold prices, both which lead inflation by about 52 weeks. Short-term interest rates have a fairly coincident relationship with inflation, and once short-term yields are taken into account, long-term interest rates come in with a negative sign, since yield curve inversion also often precedes inflation. In any event, the notion of an “inflation-unemployment tradeoff” rests on a misunderstanding of Phillips’ work, and a disregard for historical evidence. By contrast, here’s the basis for what I view as the “true” Phillips Curve. The relationship between real wage inflation and unemployment is negative at all leads and lags (which creates a downward sloping relationship when the two are plotted together). Here too, unemployment is a somewhat lagging economic variable, but the main feature of the chart below is the consistently negative correlation, which means that high unemployment is associated with low real wage inflation, and low unemployment is associated with high real wage inflation. There’s your scarcity relationship. At a 4.4% unemployment rate currently, it’s this feature that has recently been putting gradual pressure on corporate profit margins. Despite quarter-to-quarter variability, the likelihood is that the period of persistently rising margins is behind us, and a period of gradually normalizing margins is ahead of us. Even if margins remain permanently high, weak structural growth drivers and extreme valuations are likely to be problematic for stocks in the years ahead. Downward pressure on profit margins would simply amplify these risks.
--- The foregoing comments represent the general investment analysis and economic views of the Advisor, and are provided solely for the purpose of information, instruction and discourse. Prospectuses for the Hussman Strategic Growth Fund, the Hussman Strategic Total Return Fund, the Hussman Strategic International Fund, and the Hussman Strategic Dividend Value Fund, as well as Fund reports and other information, are available by clicking "The Funds" menu button from any page of this website. |
|||||||||||||||||||||||||
|
For more information about investing in the Hussman Funds, please call us at
1-800-HUSSMAN (1-800-487-7626) 513-326-3551 outside the United States Site and site contents © copyright Hussman Funds. Brief quotations including attribution and a direct link to this site (www.hussmanfunds.com) are authorized. All other rights reserved and actively enforced. Extensive or unattributed reproduction of text or research findings are violations of copyright law. Site design by 1WebsiteDesigners. |