
Vulnerable Windows and Swinging Trap Doors

John P. Hussman, Ph.D.
President, Hussman Investment Trust
June 2019
The received wisdom is mistaken on how recessions are made. They are not simply caused by shocks. They are caused by a window of vulnerability in the economic cycle where the cyclical drivers of the economy have weakened to the point where it’s susceptible to a negative shock. Within that window of vulnerability, virtually any reasonable shock becomes a recessionary shock. That’s how you get a recession.
– Lakshman Achuthan, Economic Cycle Research Institute
Why do economies collapse into recession in ways that seem so difficult to predict? Why do financial markets collapse into free-fall with timing that’s so loosely related to market valuations? Much of the reason is that complex systems usually aren’t linear. In a linear system, a given change in some variable X always has the same expected effect on variable Y. In the economy, and in the financial markets, the same event can have zero effect in some conditions, and profound effect in another, often depending on much broader conditions that make the system vulnerable or resilient to shocks.
As a rule, long-term results in the economy tend to be predictably related to underlying long-term drivers. So for example, long-term economic growth is usually tightly related to the sum of labor force growth and trend productivity growth. Likewise, long-term stock market returns are usually tightly related to the initial level of market valuations and the long-term structural growth rate of the economy.
In contrast, shorter-term outcomes can be dominated by psychology and what Keynes described as “animal spirits.” Over shorter segments of the economic cycle, GDP growth may have a very weak relationship with structural factors like labor force growth and trend productivity, and economic fluctuations can instead be driven by cyclical fluctuations in the unemployment rate. Likewise, over shorter segments of the market cycle, market returns can have little or no relationship to valuations, and returns can instead be driven by the psychological inclination of investors toward speculation or risk-aversion.
If those episodes of “animal spirits” persist long enough to become over-extended, naïve observers may come to believe that “fundamentals don’t matter.” Instead, they extrapolate recent trends, blind to the fact that risk becomes most profound exactly when it has remained unexpressed the longest.
Even when surreal distortions in the economy and the financial markets make crisis and speculative collapse inevitable, it’s not enough to know that those outcomes are baked-in-the-cake. Imbalances aren’t resolved sooner just because the imbalances are larger. The fact that I fully expect the S&P 500 to lose 60-65% of its value over the completion of this cycle doesn’t mean that intervening periods of speculation and uniform market internals can’t periodically defer that outcome. Instead, crises emerge seemingly out of nowhere, when a vulnerable window or a trap door swings open. That makes it essential to monitor those hinges. Decades ago, the late MIT economist Rudiger Dornbusch put it this way: “The crisis takes a much longer time coming than you think, and then it happens much faster than you would have thought.”
Fortunately, this doesn’t mean that we have to abandon the hope of anticipating recessions, market collapses, recoveries, or favorable market periods. What it does require, however, is the willingness to abandon the idea of “prediction” and to replace it with a more flexible approach that’s focused on identifying a) underlying drivers of economic growth and market returns, and b) the factors that create “windows” during which those underlying drivers are most likely to be expressed or ignored.
Imbalances aren’t resolved sooner just because the imbalances are larger. Instead, crises emerge seemingly out of nowhere, when a vulnerable window or a trap door swings open. That makes it essential to monitor those hinges.
Throwing stones at the window of vulnerability
Let’s begin by discussing the current economic situation. My friend Lakshman Achuthan at the Economic Cycle Research Institute (ECRI) recently offered a great discussion on RealVision (https://www.realvision.com/cycling-into-slowdown) describing how he thinks about recessions and recoveries. Though we were among the only observers to anticipate both the 2000-2002 and 2007-2009 downturns, we’ve each made premature recession calls during the recent expansion, largely because growth cycle downturns that have historically resolved into recessions were met with fresh speculative psychology. The lesson there, at least on my part, was to impose somewhat more conservative thresholds on our Recession Warning Composite, and also to leave more room for doubt in periods where our measures of market internals suggest that speculators still have the bit in their teeth.
Still, the basic framework we share – extracting a joint signal from multiple indicators, monitoring evidence from prevailing conditions rather than relying on linear models to predict future outcomes – is not only consistent with what we know about economic fluctuations, but is also one that has been highly effective identifying recessions in real-time, where few economists or even central banks have been successful.
Lakshman’s mentor was Geoffrey Moore, who co-founded ECRI, and as a senior member of the National Bureau of Economic Research, provided the official dates for most U.S. post-war recessions. Moore was succeeded by Robert Hall, who headed the NBER committee that subsequently dated U.S. recessions, and was one of the members of my dissertation committee at Stanford. I earned my keep at Stanford, in part, as Dr. Hall’s teaching assistant in his macroeconomics core course for incoming Ph.D. candidates. So when either of us talk about how a recession is identified, we’re talking about how the body that authoritatively determines recessions defines them.
I strongly encourage watching Lakshman’s whole RealVision interview, but a few quotes will suffice to emphasize the importance of thinking not in terms of “forecasting,” but instead in terms of underlying conditions, and windows of vulnerability:
“What we’re doing is monitoring ‘buckets’ of indicators. The cycle is not defined by GDP, but by the bucket of indicators, which includes GDP and measures of output, measures of employment, income, and sales, and they’re all very broad aggregate measures, which collectively define the economy outside your window. There’s actually two cycles you’re watching. One of them is business cycles – recessions and recoveries – defined by when the level of that bucket of indicators falls in a pronounced, pervasive, and persistent manner. Even two negative quarters of GDP is not a necessary or sufficient condition for a recession.
“More important may be growth rate cycles, because this is what markets key off of – accelerations and decelerations in growth. Since the last recession, we’ve actually had three full growth rate cycles: 2010-11, 2012-13 and then 2015-16, with accelerations in between. We peaked [in 2018] and we’re in a new deceleration. The moment you go into a deceleration, especially if your growth rate isn’t that high to begin with, recession is on the table. I look at the leading indicators and they are still going down.
“The received wisdom is mistaken on how recessions are made. They are not simply caused by shocks. They are caused by a window of vulnerability in the economic cycle where the cyclical drivers of the economy have weakened to the point where it’s susceptible to a negative shock. Within that window of vulnerability, virtually any reasonable shock becomes a recessionary shock. That’s how you get a recession.
“3% trend growth is just not in the cards. What’s your population growth? What’s your productivity growth? That constrains and defines your long-term potential for growth. When you add it up, population growth is running at about 0.5%, and then your productivity growth is at best 1%. That’s 1.5%. That’s not 3%. It’s just not going to happen. If you have low trend growth and cycles, and every growth rate cycle downturn brings recession onto the table, you’re setting yourself up – even though we’ve had a long expansion – for a period of more frequent recessions.”
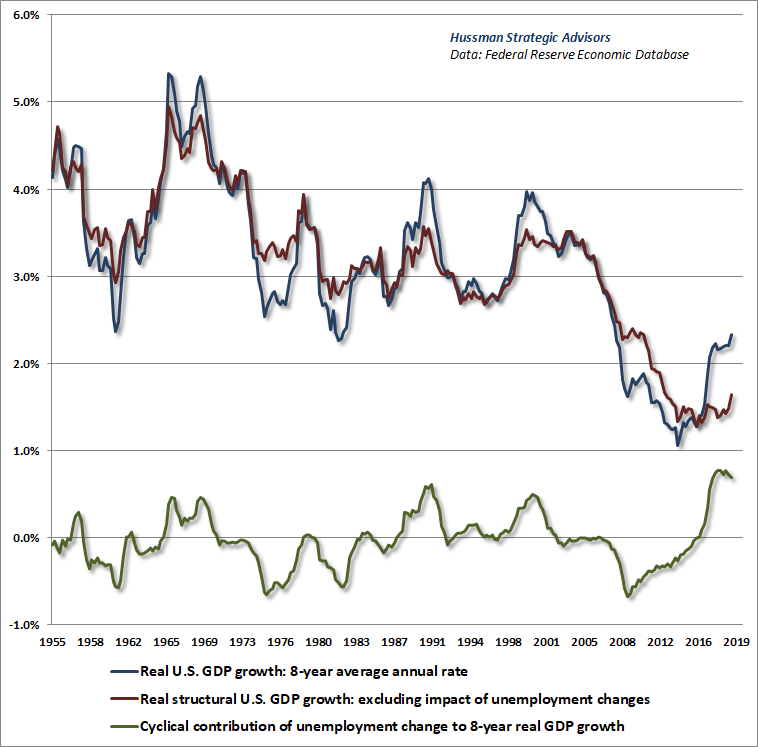
A couple of charts will help to underscore what Lakshman is saying. The first chart below offers a distinction between what I often call “structural” and “cyclical” components of economic growth. The blue line is actual 8-year average real U.S. GDP growth. The red line is “structural” real GDP growth, which is driven by labor force growth plus trend productivity. As Lakshman observed, the current level of structural real U.S. GDP growth is only about 1.5%. That’s the average level of growth that we would observe if the rate of unemployment was simply held constant. The green line shows the “cyclical” component of real GDP growth, which is driven by changes in the unemployment rate.
Notice that much of the growth that we’ve observed in recent years has been driven by a decline in the unemployment rate from 10% in 2009 to just 3.6% recently. It would be a mistake to extrapolate that component. Even if the U.S. avoids a recession in the coming years, we’re looking at likely real GDP growth of scarcely 1.5%. Any uptick in the unemployment rate will quickly be associated with outright recession.
Understand what low structural growth implies for the U.S. stock market. First, while Wall Street mechanically recites the aphorism that “lower interest rates justify higher valuation multiples,” that proposition actually holds only if the trajectory of future cash flows is held constant. So yes, if the trajectory of future cash flows is held constant, it’s fine to believe that lower interest rates justify higher valuation multiples. Even then, if you understand what those higher valuation multiples are actually doing, the proposition is identical to saying that that lower interest rates justify lower future stock market returns.
The problem is that if interest rates are low because growth is also low, lower interest rates don’t justify any increase in valuation multiples at all. Normal valuation multiples would already be enough to produce lower future equity returns, via the slower growth of future fundamentals. If investors instead bid valuation multiples up anyway, subsequent returns are penalized twice, and can be driven to negative levels for years to come. That’s what investors have done here.
Think of it this way. If inflation stays around 2%, the result will be corporate revenue growth of only about 3.5%. Without persistent expansion in profit margins (which are already eroding as a tighter labor market puts upward pressure on unit labor costs), corporate earnings growth will also likely top out at just 3.5% annually in the coming years, with steep risk to the downside. Even the mildest retreat in valuation multiples will then likely produce a multi-year period of negative S&P 500 total returns. All of this is just basic arithmetic.
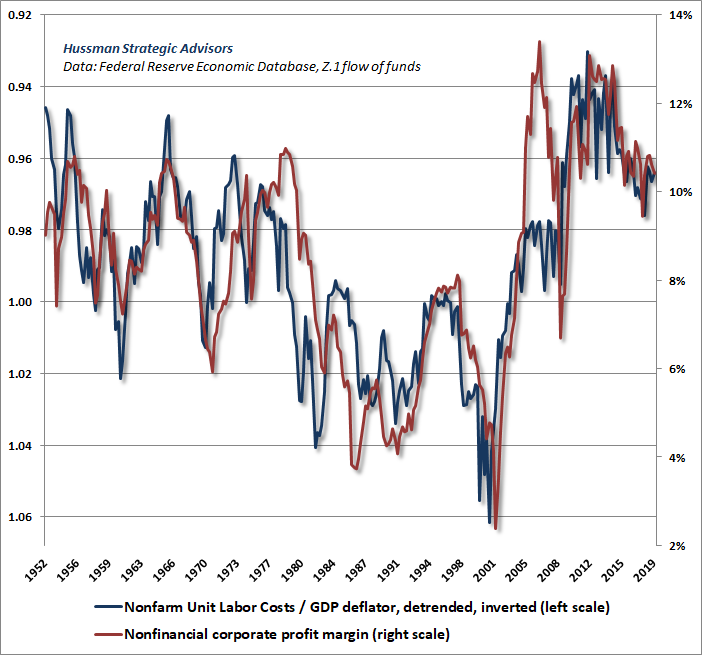
For investors who imagine that higher profit margins are some mystical consequence of vaguely defined forces like “technology,” “innovation,” “oligopoly,” “globalization” or whatever chewy words make them feel like we’re all just smarter now, buckle up. The surge in profit margins we’ve seen in recent years is a direct reflection of depressed unit labor costs, largely the result of years of high unemployment and job market distress that followed the global financial crisis. As labor slack has been taken up, labor costs have begun to rise at a faster rate than overall price inflation (the only durable and intellectually tenable interpretation of A.W. Phillips’ 1958 paper). Margins are already under pressure, S&P 500 margins always lag economy-wide shifts in nonfinancial margins, and we haven’t even hit a recession yet.
The problem is that if interest rates are low because growth is also low, lower interest rates don’t justify any increase in valuation multiples at all. Normal valuation multiples would already be enough to produce lower future equity returns, via the slower growth of future fundamentals. If investors instead bid valuation multiples up anyway, subsequent returns are penalized twice, and can be driven to negative levels for years to come. That’s what investors have done here.
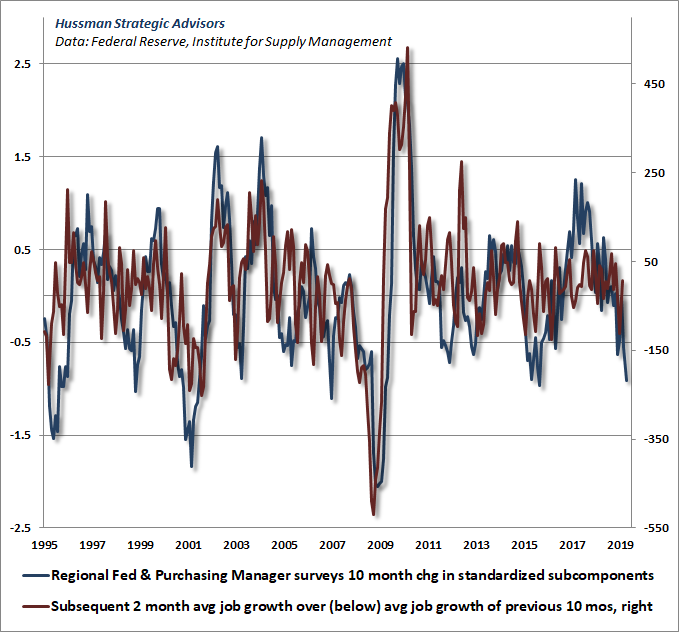
The next chart shows another of the immediate risks already on our radar. In recent months, the composite signal we derive from broad regional Fed and purchasing managers surveys has turned down sharply. We also know that employment is among the most lagging measures of economic activity. The combination of those two observations is presented in the chart below.
Specifically, the 10-month change in our broad economic composite has a reasonably strong relationship to the amount by which non-farm payrolls grow over the following 2-months, above or below the average job growth during the same 10-month period. To put some numbers on this, over the past 10 months, U.S. nonfarm payrolls have grown an average of 216,000 per month. Given the rapid deterioration in our economic composite, it would not be surprising to see job growth in the next couple of months average about 180,000 jobs less than that, implying that we may be about to observe a collapse in monthly job growth to an average of only about 36,000 jobs per month in the next couple of reports.
I can’t speak for Lakshman with respect to where his own measures are in defining a potential “window of vulnerability”, but I can say that our own Recession Warning Composite is not far from that determination. Even being fairly conservative about a recession call, we would become vocal about oncoming recession provided simply: a) a further decline in the ISM Purchasing Manager’s Index to a level of 50 or below, and; b) an increase in the rate of U.S. unemployment to 4% or a slowing in year-over-year payroll growth to less than 1.4%.
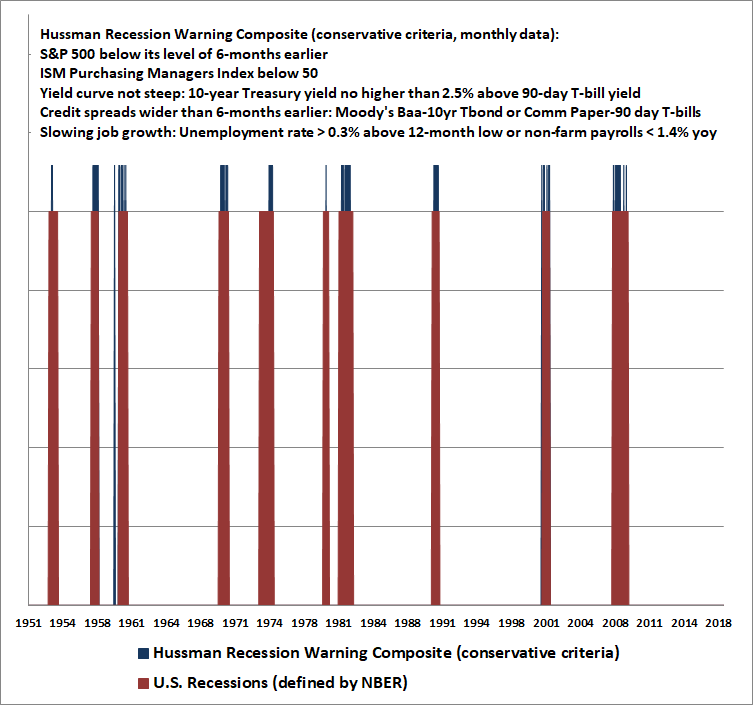
As always, evidence is most compelling when it is most broad. Some of the features that typically accompany the onset of a recession include a drop in Consumer Confidence of roughly 20 points below its preceding 12-month average; a 3-month decline in aggregate hours worked. Raising the criteria on the ISM PMI to 54 and eliminating the requirement of rising credit-spreads has historically produced more timely warnings, but also allowed false signals during the recent expansion.
Given the rapid deterioration in our economic composite, it would not be surprising to see job growth in the next couple of months average about 180,000 jobs less than that, implying that we may be about to observe a collapse in monthly job growth to an average of only about 36,000 jobs per month in the next couple of reports.
What’s clear is that the U.S. economy is quite close to a window of recessionary vulnerability, and rocks, such as arbitrary tariff announcements, are being carelessly thrown against that window. Given that the kind of employment slowdown already implied by our broad economic composite would be enough to trigger the employment component of our Recession Warning Composite, my sense is that the likelihood of an oncoming recession is accelerating rapidly. Yet given that market conditions already hold us to a defensive position, we have the luxury of not rushing an explicit recession warning just yet.
The trap-door reopens
In the equity market, we also see a “conditional” effect of valuations. Specifically, when investors are inclined toward speculation, even the most obscene overvaluation may have no effect on market returns. But once psychology shifts from speculation to risk-aversion, market conditions become permissive of extraordinary market collapses. When investors are inclined to speculate, they tend to be indiscriminate about it, so we find that the most reliable measure of speculative or risk-averse psychology is the uniformity or divergence of market action across thousands of individual securities, industries, sectors, and security-types, including debt securities of varying creditworthiness.
I developed this approach in 1998, with minor adaptations since, and discussed the importance of our measures of internals in real time when we adopted a hard-negative outlook in 2000 and 2007. While I don’t disclose specific methods, the central principle is that risk-aversion reveals itself through divergence, dispersion, ragged leadership, and lack of participation in financial market behavior.
As I’ve regularly observed, our difficulty in the recent market cycle had nothing to do with valuations or internals, but instead on my premature bearish response to historically useful “overvalued, overbought, overbullish” syndromes. In late-2017, I abandoned my belief that extreme speculation still had reliable “limits,” and we have since required explicit deterioration in market internals in order to adopt or amplify a bearish market outlook.
The chart below presents the cumulative total return of the S&P 500 in periods where our measures of market internals were favorable, and accruing Treasury bill interest otherwise. The chart is historical, does not represent any investment portfolio, does not reflect valuations or other features of our investment approach, and is not an assurance of future outcomes.
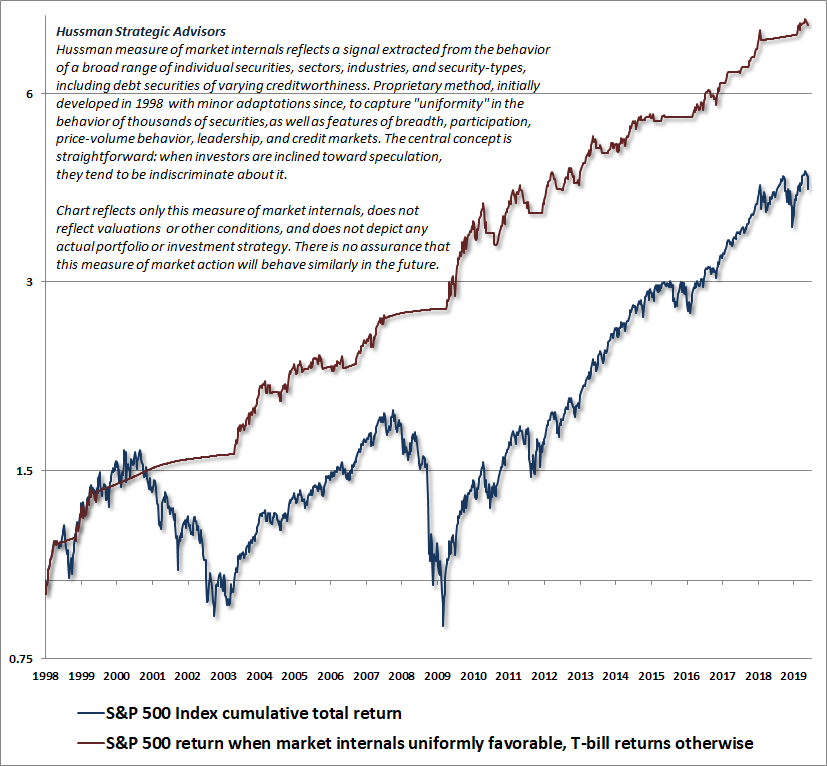
Two weeks ago, after a brief positive whipsaw, those measures of market internals again shifted negative. We don’t know how long the most recent shift will persist. On average, shifts last about 30 weeks, with 25% of shifts extending 40 weeks or longer, and 25% of shifts extending 8 weeks or shorter. The feature of importance here is that the condition of market internals (and by extension, the inclination of investors toward speculation or risk-aversion) has been extremely useful in this cycle, as in prior ones. Indeed, the entire total return of the S&P 500 from the 2007 peak to the recent market peak has occurred in periods where internals were favorable, while nearly the entire 2000-2002 and 2007-2009 collapses occurred when they were not.
Now, from a long-term, full-cycle perspective, valuations are also extremely informative about likely market returns. Extreme valuations are regularly followed by depressed subsequent returns, while depressed valuations are regularly followed by satisfying market returns. Still, keep in mind that if overvaluation was enough to drive the market lower, it would be impossible for valuations to reach the kind of extremes they did in 1929, 2000 and at the recent market peak. So at the end of every market bubble, there is usually a period of time where stocks have done much better than one would have expected on the basis of valuations alone. These transitory “excess returns” are routinely beat out of the market over the completion of the cycle.
Emphatically, major market collapses do not simply emerge because the market is overvalued. They emerge because extreme valuations are joined by a shift in investor psychology from speculation to risk-aversion. It is not necessary to predict those shifts – only to align one’s outlook with them.
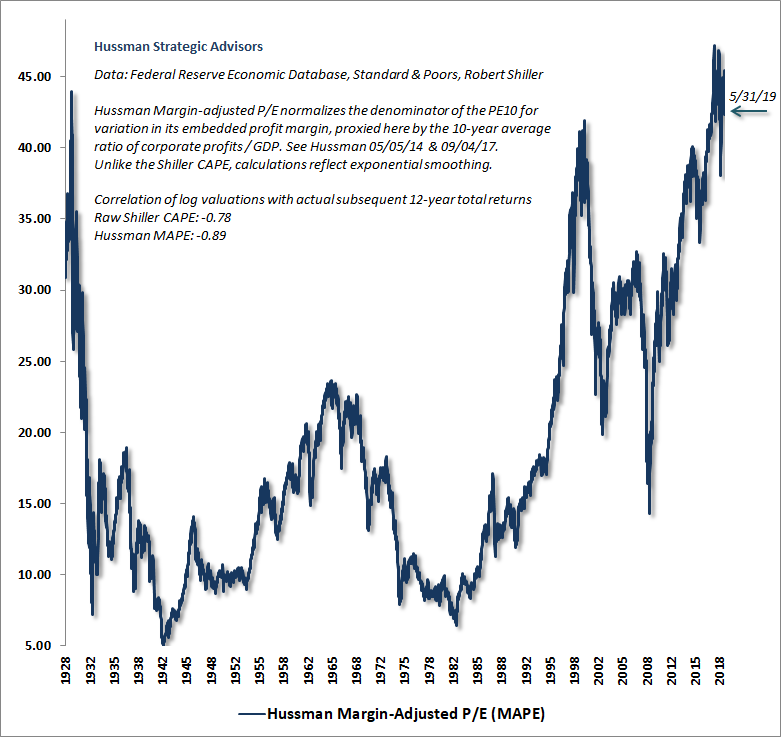
The chart below updates our Margin-Adjusted P/E, which is more reliable across history than a score of competing alternatives, including price/forward operating earnings, the Fed Model, or the Shiller CAPE.
In late-October 2008, when our best valuation measures fell below their historical norms, I could comfortably write “The best way to begin this comment is to reiterate that U.S. stocks are now undervalued.” Presently, the S&P 500 would have to lose about 60-65% simply to reach historically run-of-the-mill valuations. Those valuations are not worst-case possibilities, but outcomes that have been observed over the completion of every market cycle in history, except the 2002 low (which was later breached in the 2007-2009 collapse).
The next chart puts the Margin-Adjusted P/E on an inverted log-scale, along with actual subsequent 12-year S&P 500 average annual total returns. Note that current valuations are fully consistent with the expectation of 12-year losses in the S&P 500.
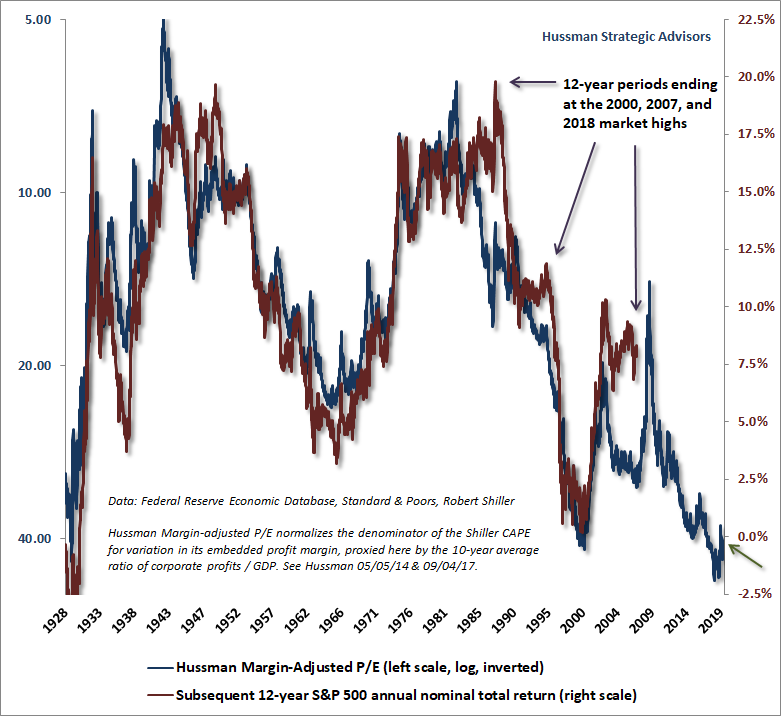
The important thing to recognize is that valuations are extremely informative about long-term returns and full-cycle market risks, but they are not particularly useful as timing tools in themselves. Emphatically, major market collapses do not simply emerge because the market is overvalued. They emerge because extreme valuations are joined by a shift in investor psychology from speculation to risk-aversion.
It is not necessary to predict those shifts – only to align one’s outlook with them. I remain entirely open to adopting a neutral or constructive outlook even at current valuation extremes, but here and now, a roughly 60-65% trap door has opened below this hypervalued market, and until the evidence shifts, our outlook is now hard-negative.
An imminent shift to easy money
Given the accelerating prospects for economic recession, consistent with the recent drop in leading measures, Treasury yields, and industrial commodity prices, it’s natural to expect that the Federal Reserve will cut interest rates in response. That’s a prospect that I wouldn’t entirely rule out even at the upcoming June meeting. The question is whether that would do any good. The answer is no – at least under the set of conditions we presently observe – and the reason goes back to the “nonlinear” and “conditional” response of the economy and the markets to various events.
See, the way Fed easing “works” to support stock prices is straightforward. Provided that investors are inclined toward speculation and risk-seeking, Fed easing tends to be very favorable for the market, because safe, low-interest liquidity is a hot-potato to risk-seeking speculators. Each successive holder wants to get rid of it, yet somebody has to hold it at each point in time. The resulting effort to exchange it for something else has the effect of driving up stocks, bonds, and anything else that offers a “pickup” to low short-term rates.
In contrast, when investors are inclined toward risk-aversion, safe low-interest liquidity is a preferred asset rather than an inferior one. So creating more of the stuff does nothing to encourage more speculation. When one recalls that the Federal Reserve eased persistently and aggressively throughout the 2000-2002 and 2007-2009 collapses, it should be clear that a recessionary collapse in stocks would not be interrupted by a sudden shift toward rate cuts, aside for very short-lived knee-jerk reactions.
While we believe that the Federal Reserve will shift toward an easing monetary policy in the near future, the likely effect of Fed policy on the stock market will be best gauged by monitoring market internals directly. If internals remain ragged and divergent, then even persistent and aggressive easing should not be expected to support stocks. In contrast, during periods when market internals shift to a uniformly favorable condition, Fed easing will tend to amplify the speculative tendencies of investors, and it will be appropriate to adopt a constructive outlook in response.
To illustrate the conditional response of the equity market to monetary policy, the chart below shows four lines. The green line shows the cumulative total return of the S&P 500 during periods when the Fed was easing (based on policy rates or reserve creation) and our measures of market internals were favorable. Clearly, Fed easing tends to have a robust and positive impact on the market when investors are inclined toward speculation. Yet look at the orange line. Those are periods where the Fed was easing yet investors were inclined toward risk-aversion, as inferred from ragged or deteriorating market internals. On average, Fed easing had no effect. Indeed, most of the market losses during the 2000-2002 and 2007-2009 period occurred in exactly those conditions.
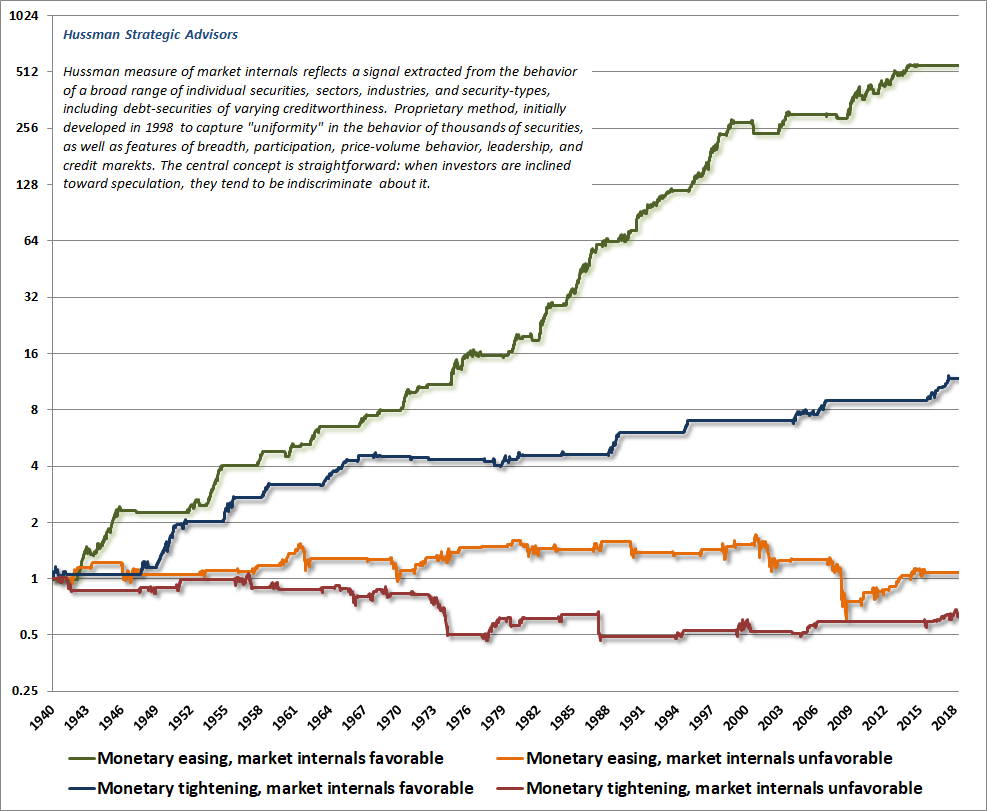
Note also that the market tends to do quite well during periods of Federal Reserve tightening, provided that investors are inclined to speculate, as those tightening phases tend to overlap late-stage economic expansions when the news is good and investors are happy. Not surprisingly, the worst average outcomes occur during periods when the Fed is tightening yet investors are also inclined toward risk aversion. This tends to be associated with inflationary periods like 1972-1974, when the Fed did not have the luxury of easing despite a collapsing stock market.
While it’s possible that Fed easing could help to shift investor psychology back toward speculation, that prospect is best gauged by monitoring market internals directly, rather than keying one’s actions off of Federal Reserve behavior.
Remember, for example, that during the global financial crisis, it wasn’t Fed easing that put the bottom in. The crisis ended, and ended precisely, in the second week of March 2009, when the Financial Accounting Standards Board, under Congressional pressure, abandoned FAS157 “mark-to-market” accounting rules. Banks were immediately allowed to use “significant judgment” in valuing their toxic assets, which removed the specter of widespread bank insolvencies with the stroke of a pen. Once investor psychology shifted toward speculation, Fed easing suddenly became highly effective in amplifying that speculation, where it had been totally impotent before.
While we believe that the Federal Reserve will shift toward an easing monetary policy in the near future, the likely effect of Fed policy on the stock market will be best gauged by monitoring market internals directly. If internals remain ragged and divergent, then even persistent and aggressive easing should not be expected to support stocks. That’s precisely what occurred during the 2000-2002 and 2007-2009 collapses. In contrast, during periods when market internals shift to a uniformly favorable condition, Fed easing will tend to amplify the speculative tendencies of investors, and it will be appropriate to adopt a constructive outlook in response.
The bottom line is that economic recessions and market collapses tend to occur not just because imbalances have gone “too far,” but because some window or trap door has opened. In economic data, the windows of vulnerability emerge as a combination of weakness in leading indicators, often including additional features like a flat or inverted yield curve, widening credit spreads, and equity market weakness. In the financial markets, the trap doors typically present themselves in the form of weak or divergent market internals. In both cases, it’s advisable to mind the hinges of those windows and doors. If those windows and doors close, based on improvements in leading indicators and a shift to uniformly favorable internals, our immediate outlook will become decidedly more constructive.
As I observed in January 2008, in a piece titled “Minding the Hinges of Pandoras Box”, I wrote, “I am emphatic that investors should evaluate their risk exposures and tolerances now, in order to allow for substantial further market weakness. Market conditions presently feature a Pandora’s Box of rich valuations, vulnerable profit margins, rising default risk, rapidly deteriorating market internals, failing support levels, and accumulating evidence of oncoming recession.” Until we observe an improvement in leading economic measures and a shift toward uniformly favorable market internals, my advice today is exactly the same.
Keep Me Informed
Please enter your email address to be notified of new content, including market commentary and special updates.
Thank you for your interest in the Hussman Funds.
100% Spam-free. No list sharing. No solicitations. Opt-out anytime with one click.
By submitting this form, you consent to receive news and commentary, at no cost, from Hussman Strategic Advisors, News & Commentary, Cincinnati OH, 45246. https://www.hussmanfunds.com. You can revoke your consent to receive emails at any time by clicking the unsubscribe link at the bottom of every email. Emails are serviced by Constant Contact.
The foregoing comments represent the general investment analysis and economic views of the Advisor, and are provided solely for the purpose of information, instruction and discourse.
Prospectuses for the Hussman Strategic Growth Fund, the Hussman Strategic Total Return Fund, the Hussman Strategic International Fund, and the Hussman Strategic Dividend Value Fund, as well as Fund reports and other information, are available by clicking “The Funds” menu button from any page of this website.
Estimates of prospective return and risk for equities, bonds, and other financial markets are forward-looking statements based the analysis and reasonable beliefs of Hussman Strategic Advisors. They are not a guarantee of future performance, and are not indicative of the prospective returns of any of the Hussman Funds. Actual returns may differ substantially from the estimates provided. Estimates of prospective long-term returns for the S&P 500 reflect our standard valuation methodology, focusing on the relationship between current market prices and earnings, dividends and other fundamentals, adjusted for variability over the economic cycle.

