

Subsets and Sensibility


John P. Hussman, Ph.D.
President, Hussman Investment Trust
October 2024
When analyzing risks, it’s crucial to consider the underlying structure of the data. By partitioning it into meaningful subgroups, we reveal differing conditional probabilities that provide a more accurate picture of risk across various scenarios.
– David Spiegelhalter, The Art of Statistics
One of most dangerous habits of a speculative crowd is the tendency to use unconditional averages and unconditional probabilities regardless of how extreme market conditions have become. This is like stepping into a house with two rooms, one with the temperature at 0 degrees and one at 140 degrees, and expecting a temperature of 70 either way.
The fact is that market outcomes differ based on varying market conditions. If one thinks of positive and negative market outcomes as being distributed across a “bell curve,” the position and shape of that bell can differ substantially depending on a wide range of factors, including the level of market valuations, the stance of monetary policy, the psychology of investors toward speculation or risk-aversion (which we infer based on the uniformity and divergence of thousands of individual stocks, sectors, industries and security-types), and shorter-term overextension and compression of market action.
It’s difficult to find subsets of market conditions that are historically associated only with market advances or only market declines, and it’s impossible, I think, to identify conditions of this sort that apply to any significant portion of market history. Rather, nearly all of the market conditions we identify are associated with a distribution of both positive and negative outcomes. It’s just that the features of the distribution – its average returns, the frequency of extreme gains or losses, and the time-horizon of the most reliable outcomes, can vary enormously across various conditions.
Graham and Dodd emphasized the danger of “unconditional” investment behavior in their 1934 discussion of the market collapse of the Great Depression – which I could still reprint in every market comment here, and be satisfied that my readers had been served well.
The ‘new era’ doctrine – that ‘good’ stocks were sound investments regardless of how high the price paid for them – was at bottom only a means of rationalizing under the title of ‘investment’ the well-nigh universal capitulation to the gambling fever. The notion that the desirability of a common stock was entirely independent of its price seems incredibly absurd. Yet the new-era theory led directly to this thesis… An alluring corollary of this principle was that making money in the stock market was now the easiest thing in the world. It was only necessary to buy ‘good’ stocks, regardless of price, and then to let nature take her upward course. The results of such a doctrine could not fail to be tragic.
– Benjamin Graham & David L. Dodd, Security Analysis, 1934
Having admirably navigated decades of market cycles, bubbles and collapses through the global financial crisis (GFC), yet struggling in the face of unprecedented zero interest rate policies, there’s no question that certain features of market behavior have changed since then. My own error was embedded in the “ensemble methods” that I introduced after the GFC, as a stress-testing response to better incorporate Depression-era data into our approach.
The Achilles Heel of the ensemble approach was simple, but only obvious in hindsight: across a century of market cycles, certain extreme conditions – mainly featuring a combination of overvaluation, overbought market action, and overbullish sentiment – were regularly followed by air-pockets, panics, or market crashes, in fairly short order. As interest rates fell to zero and the Fed expanded those zero-interest liabilities from 6% of GDP in 2008 to an unprecedented 36% of GDP by 2022, investors lost their minds to get rid of the stuff. Unfortunately, the moment a buyer puts their cash “into” the stock market, a seller takes it right back “out.” Somebody has to hold the stuff at every moment in time, and holding 36% of GDP in zero-rate cash was too much to bear. Every historically reliable “limit” to speculation became useless.
Meanwhile, in our ensemble methods, once those “limits” emerged and you took that branch down nearly every decision tree, there was almost no turning back. Following a progression of modifications, we finally abandoned the ensemble implementation in 2021, shifting the focus of our investment discipline more directly on the key factors that were responsible for our success across decades of cycles before and through the GFC — valuations and market internals.
We also take account of a broad range of monetary, economic, credit-related, and technical factors, as well as overextended and compressed market conditions, but there’s never a case when overextended conditions can place us in a bearish investment stance when market internals are favorable on our measures, nor a case when compressed market conditions can place us in a fully-unhedged or leveraged investment stance when market internals are unfavorable.
Present conditions
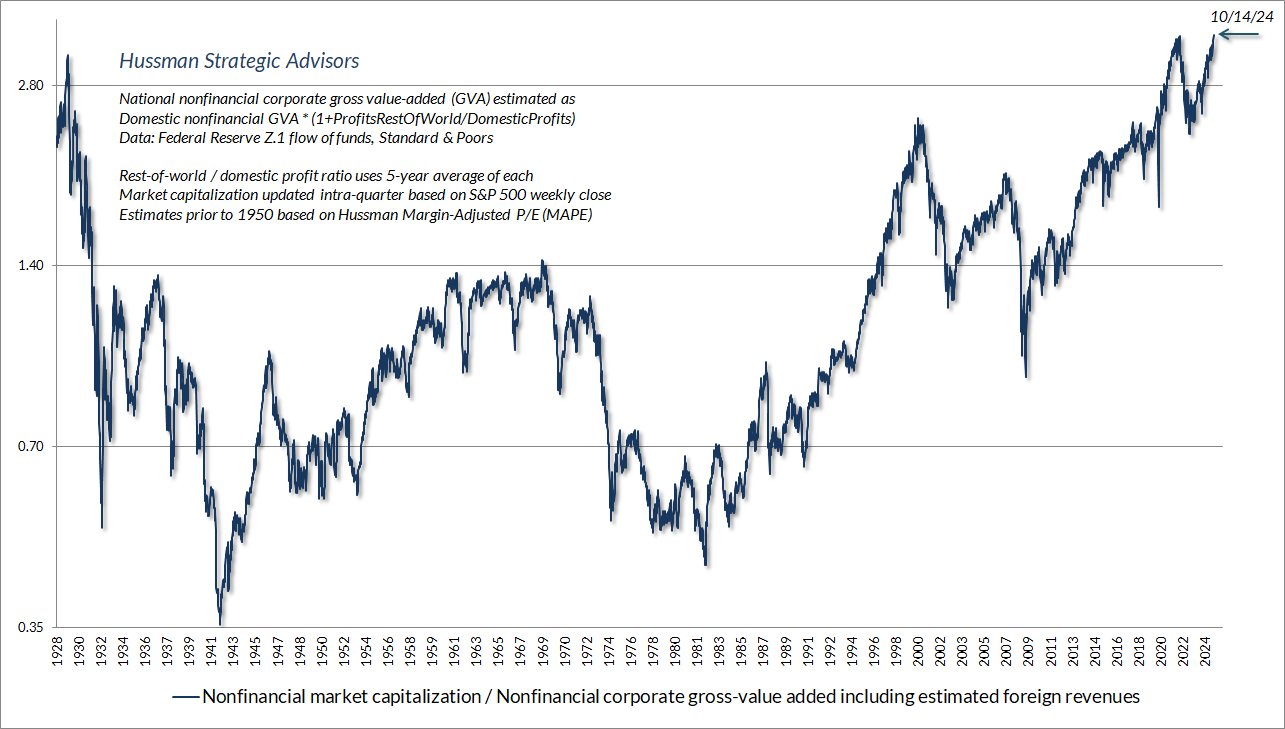
On October 14, 2024, the U.S. equity market reached the most extreme level of valuation in history, based on the measures we find best-correlated with actual, subsequent 10-12 year returns across a century of market cycles. Below, MarketCap/GVA is the market capitalization of U.S. nonfinancial corporations divided by their gross value-added, including our estimate of foreign revenues. The recent level of 3.40 exceeds every previous extreme, including 1929, 2000 and 2022.
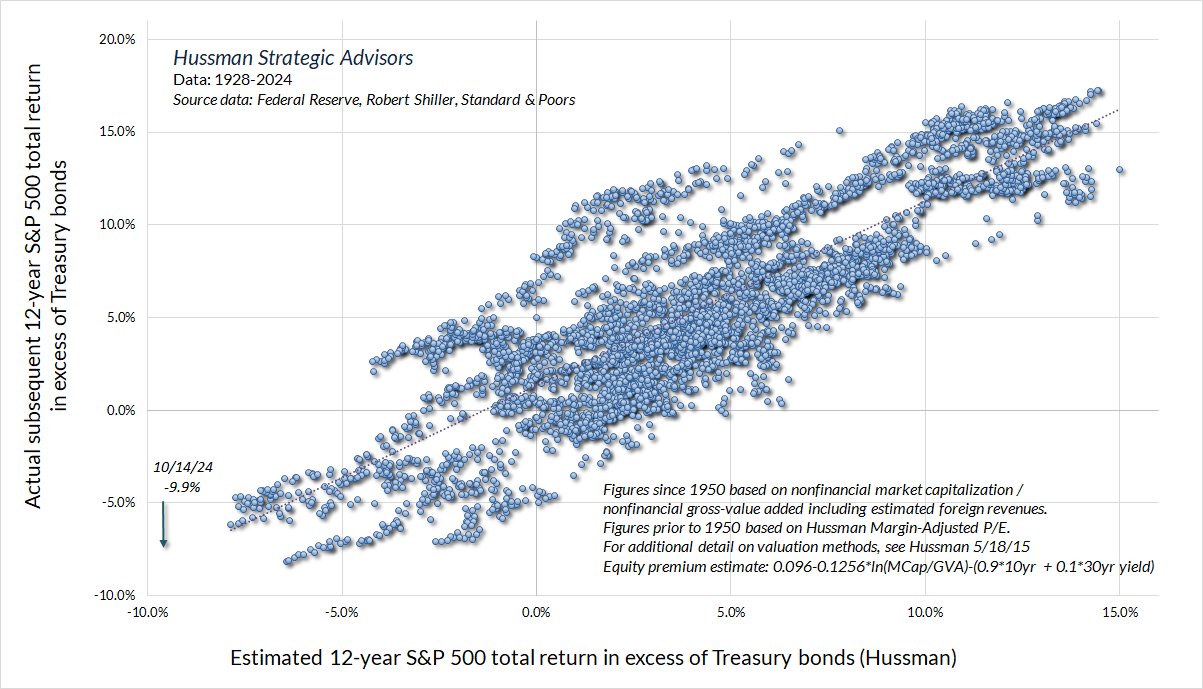
The chart below shows our estimate of the 12-year “equity risk premium” of the S&P 500, defined as the expected 12-year average annual total return of the S&P 500 over and above Treasury bond returns. The current estimate is -9.9% annually.
I know you don’t believe that. The beautiful thing is that you don’t need to. We don’t need to.
I can’t emphasize enough that a key element of our 2021 adaptation was to remove the “wall” that we were pressed against as the result of extreme valuations and overextended conditions. In data since 1940, the adapted methods we now use in practice are constructive or aggressive in well over 90% of periods when market internals are constructive. Amid current valuation extremes, such a position would certainly involve position limits and safety nets, and in a small fraction of instances we might be neutral instead of constructive.
It’s critical to remember that the role of valuations is to inform our expectations about long-term market returns and full-cycle downside risk. Nothing in our investment discipline requires the market to collapse. Valuations provide essential information about where we are in the market cycle. But other conditions, particularly the status of market internals, dominate over shorter segments of the market cycle.
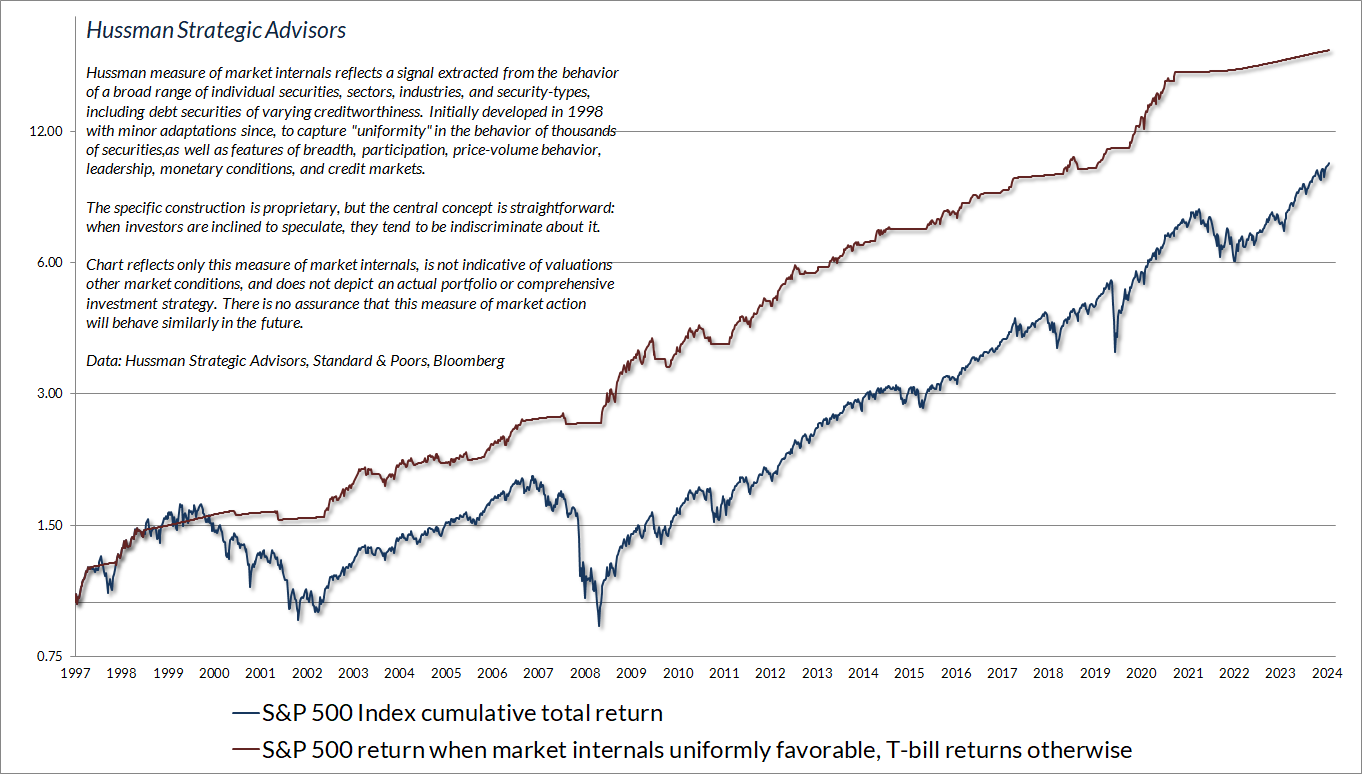
The chart below presents the cumulative total return of the S&P 500 in periods where our main gauge of market internals has been favorable, accruing Treasury bill interest otherwise. The chart is historical, does not represent any investment portfolio, does not reflect valuations or other features of our investment approach, and is not an assurance of future outcomes.
It’s notable that measured from the previous S&P 500 market peak in January 2022, nearly all of the return of the S&P 500 over-and-above Treasury bills has emerged during the past 10 weeks. Meanwhile, the equal-weighted S&P 500 and Nasdaq 100, as well as the S&P Midcap 400 and small-cap Russell 2000 indices remain close to or behind Treasury bill returns.
Over the past year, one of the persistent questions we’ve been asked, and a central focus of our research efforts, has been whether we could find some set of market features – monetary considerations, passive flows, large-cap dominance, profit margin behavior – something! that could push market internals to be positive here, without destroying the historical reliability of internals. That effort was futile, in the same way that it’s futile to climb a ladder that leans against the wrong wall. You don’t get where you want to go by continuing the climb. You get there by choosing a different wall.
Good news and good news
We have some good news, and some good news. The first piece of good news is that, by all evidence, internals are measuring precisely what they are intended to measure. It’s the wrong question to ask, ‘How can we somehow force internals to look like trend-following measures that aren’t as reliable across history?’ Happily, abandoning that question frees us to ask a better question.
If the average outcome of bearish conditions is a market decline, and it’s not possible to find observable conditions that distill a subset that has positive average returns, then it’s not helpful to ‘force’ a valid, unfavorable market assessment to be favorable. Once one accepts that internals are, in fact, behaving as intended, the question becomes: How can we benefit during bearish conditions when valuations and internals validly hold us to a defensive outlook, yet obvious but less reliable trend-following measures remain favorable?
Instead of trying to force our response to shift from bearish to constructive, the appropriate response is to modify the intensity of the bearish outlook itself. So, the second piece of good news is this. We’ve enhanced the component of our hedging discipline that informs our choice of put option strike prices in periods that are classified as bearish. The underlying hedging mathematics essentially integrate the consensus of dozens of technical gauges that measure a wide range of shorter-term factors such as trend, channel, compression, overextension, breakout, and reversal. The result is a better ability to distill bearish periods when the market loses value, on average, but only at a moderate average rate, versus bearish periods when the market also loses value, on average, but at a wicked average rate.
– John P. Hussman, Ph.D., Asking a Better Question, September 23, 2024
I’m fairly certain that nobody fully appreciates what we accomplished last month, which dramatically reduces the risk of “fighting” market advances even in market conditions that are quite hostile from a historical perspective. I thought it might be helpful to discuss it further.
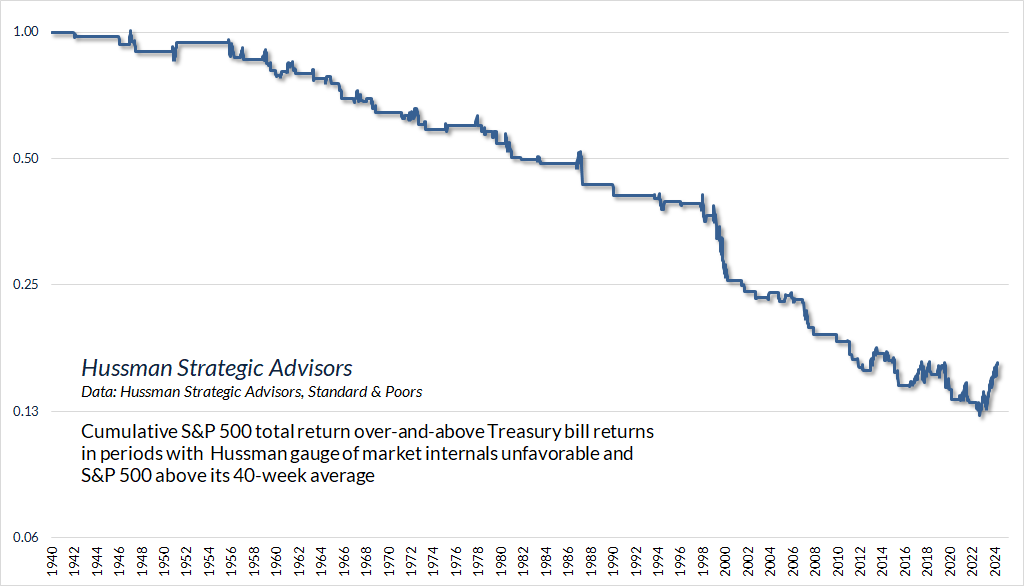
As our longer-term followers know, the central aspect of our 2021 adaptation was to abandon the “ensemble methods” we adopted after the GFC, and to shift our main focus to the status of market internals. During much of the past year, even this adaptation has been frustrating, because the S&P 500, in particular, has advanced despite the unfavorable condition of market internals. That’s not unprecedented, but it’s not typical, and the recent run has been more extended than past ones. The chart below shows the cumulative total return of the S&P 500 over-and-above Treasury bill returns in periods when our key gauge of market internals has been unfavorable, yet the S&P 500 has also been above its 40-week moving average (a popular “trend following” measure).
Many of my research efforts over the past year have focused on identifying factors that might somehow help internals “pick up” the recent advance, without destroying the historical reliability of internals. Having tested countless possible approaches, along with a deep dive into the signal extraction that I’ve used since 1998 to infer the status of internals, I’m convinced that this was the wrong question. Internals are measuring precisely what they are designed to capture. My impression is that underlying dispersion across internals reflects greater economic and credit vulnerabilities than investors imagine. In any event, abandoning the wrong question freed us to ask the right one.
See, once we accept that internals are telling us something valid about market risk, we can turn our attention to the intensity of the hedge itself – in particular, whether we use tight hedges in anticipation of clear market losses, or fairly inexpensive “safety nets” that provide insurance against lower-probability tail-risks. Identifying those subsets in data that’s full of randomness and competing information is basically a noise-reduction exercise.
I’ve often noted that in every noise-reduction problem, uniformity matters. There’s vastly more information in the common signal drawn from multiple sensors than there is in any single measure by itself. That proved to be true for our hedging problem. As I noted last month, “the underlying hedging mathematics essentially integrate the consensus of dozens of technical gauges that measure a wide range of shorter-term factors such as trend, channel, compression, overextension, breakout, and reversal.”
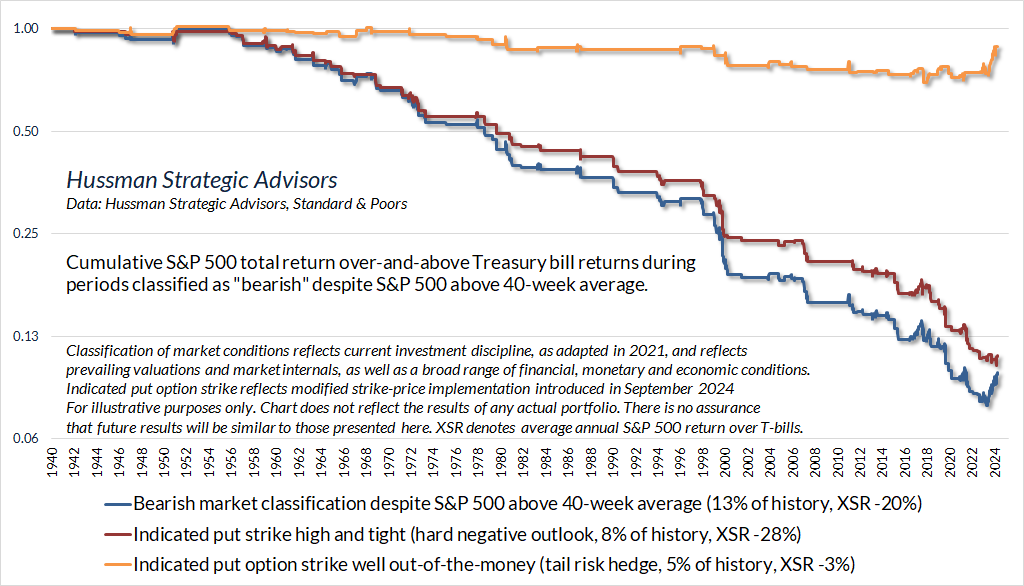
The chart below offers a sense of what this looks like in practice. The blue line shows the cumulative total return of the S&P 500 over and above Treasury bill returns during periods when our current investment discipline (as adapted in 2021) classifies market conditions as “bearish” despite the S&P 500 being above its 40-week average. The strike-price implementation I discussed last month essentially breaks that blue line, representing about 13% of market history, into two subsets: An orange line, representing about 5% of market history – but unfortunately the part of history that we’ve been living in for much of the past year – and a red line, representing about 8% of market history.
The orange line shows periods when our adapted strike-price implementation indicates put option hedges of the inexpensive “tail risk” variety. Notice that the market has indeed historically lagged T-bills even in this environment (which is part of the reason “forcing” internals to be favorable would improve recent results only by damaging historical reliability). As I observed last month, the greatest benefit of the new implementation occurs when bearish outlook, in hindsight, turns out to be wrong. The “pain trades” – maintaining a tightly bearish market outlook during an uncharacteristic advance, as we’ve experienced in recent months – become far less frequent. Not by “forcing” a constructive outlook despite “trap door” combinations of extreme valuations and unfavorable internals, but by refining the sensitivity of the hedge so we no longer “bleed” time premium.
In contrast, the red line shows periods when our adapted strike-price implementation indicates a preference for a tight hedge. In our present implementation, that sort of hedge would have applied in only about 30% of the year-to-date period (including the past few weeks), and about 35% of the period since January 2021. Clearly those hard-negative periods have been quite hostile for the S&P 500.
Again, the market has historically lagged T-bills in both the orange and red subsets, but as I noted last month, “the result is a better ability to distill bearish periods when the market loses value, on average, but only at a moderate average rate, versus bearish periods when the market also loses value, on average, but at a wicked average rate.”
The upshot is this. Our 2021 adaptations already lean into a constructive or aggressive investment outlook in about two-thirds of periods in data since 1940, and well over 90% of periods when our key gauge of market internals has been favorable. In contrast, only about a quarter of periods since 1940 are classified as bearish. When “obvious” trend-following measures are also unfavorable, a bearish outlook tends to be associated with steeply negative market returns.
What about periods when our market outlook is bearish despite seemingly “obvious” uptrends (based on measures like the S&P 500 versus its 40-week average)? As I’ve noted above, those periods comprise about 13% of data since 1940. On average, the S&P 500 has lost value in those periods as well. Still, the hedging adaptation we implemented last month better classifies those periods into a subset that tends to experience wicked losses, and a small but sometimes uncomfortable subset when the market still loses value on average, but at a much lower average rate. In those periods (shown above in orange), we can avoid much of the risk of “pain trades” – the sense that one is “fighting” an advance – not by “forcing” a constructive outlook despite trap-door combinations of extreme valuations and unfavorable internals, but by refining the sensitivity of the hedge.
My hope is that this discussion gives our long-term followers a better understanding of my enthusiasm here. We don’t need a market collapse, we don’t fear Fed easing, and we don’t require a recession. In my view, what we need most is just discipline and time. Our market outlook will change as measurable, observable conditions change. The approach I’ve discussed above gives us an additional way to vary our investment stance even when valuations are extreme, market internals are unfavorable, and the S&P 500 is uncharacteristically advancing anyway.
Looking ahead, I have little doubt that the financial markets will give us an adequate amount of fluctuation to exercise our discipline over time, whether those fluctuations maintain a “permanently high plateau” in valuations that exceed 1929 and 2000, or whether they bring the market back to historical norms, or even the depths we observed in 1942, 1974, or 1982. I certainly believe that long-term return prospects are weak, and that full-cycle market risk is profound, but in practice, no forecasts or scenarios are required.
Ring my bell
I may as well just say it. Based on the present combination of extreme valuations, unfavorable and deteriorating market internals, and a rare preponderance of warning syndromes in weekly and now daily data, my impression is that the speculative market advance since 2009 ended last week. Barring a wholesale shift in the quality of market internals, which are quickly going the wrong way, any further highs from these levels are likely to be minimal. In contrast, current valuation extremes imply potential downside risk for the S&P 500 on the order of 50-70% over the completion of this cycle.
– John P. Hussman, Ph.D., You Can Ring My Bell, July 20, 2024
Since its previous high on July 16, the S&P 500 has outperformed Treasury bills by just 1.6%, but the fear-of-missing-out among investors seems nearly frantic. One can’t share any sort of historical evidence suggesting potential market risk without a barrage of replies ranging from disdain, to long-debunked arguments, to plain apathy – “nothing matters.” This is a sure sign that unconditional thinking and passive, price-insensitive investment dogma has taken hold of investors. I suspect that Graham & Dodd’s words will prove as accurate in this bubble as they have been in speculative bubbles across history – “the results of such a doctrine could not fail to be tragic.”
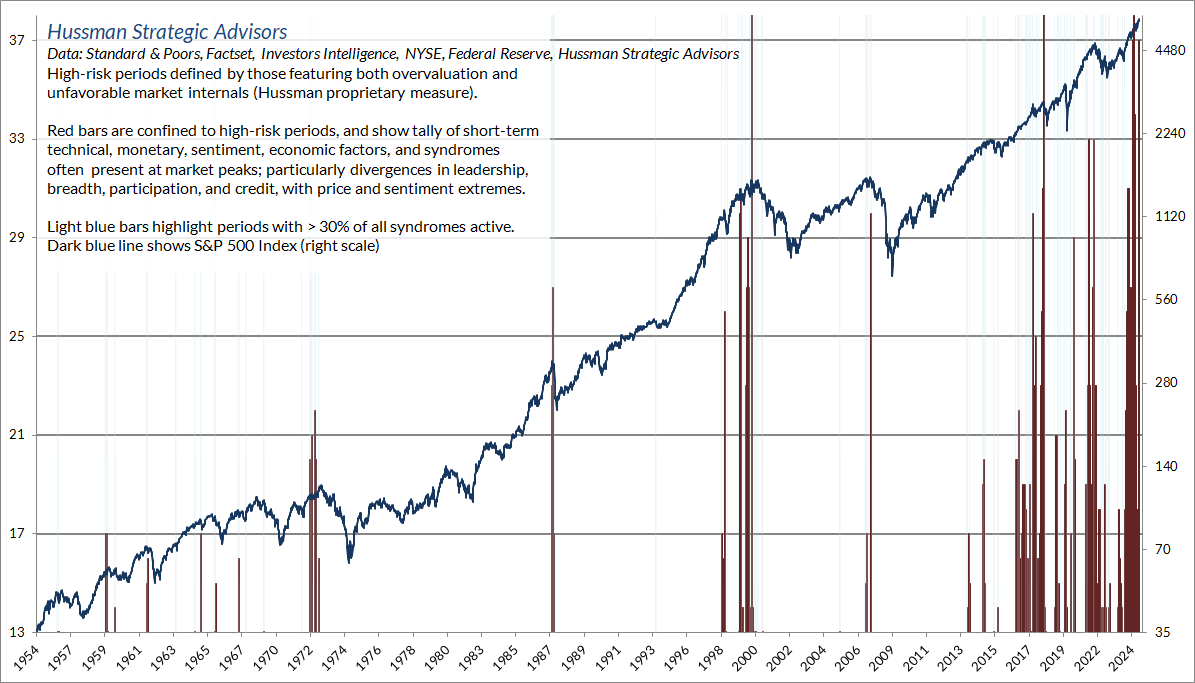
Amid the optimism, it’s worth noting that we’re again seeing a preponderance of various warning syndromes I’ve described over time. Across 40 years in the financial markets, I’ve developed scores of warning syndromes – typically reflecting various combinations of rich valuations, divergent market internals, lopsided sentiment, overextended price action, and similar features – that often emerge near market peaks. I view them as “weak classifiers” in the sense that none of them should be taken as forecasts. Rather, a high tally of these syndromes is typically associated with intermediate or longer-term market peaks, and quite often with stiff near-term declines. I usually accompany them with phrases like “Not a forecast. Just FYI.”
So just FYI, here is the tally of overextension syndromes we observe in weekly data.
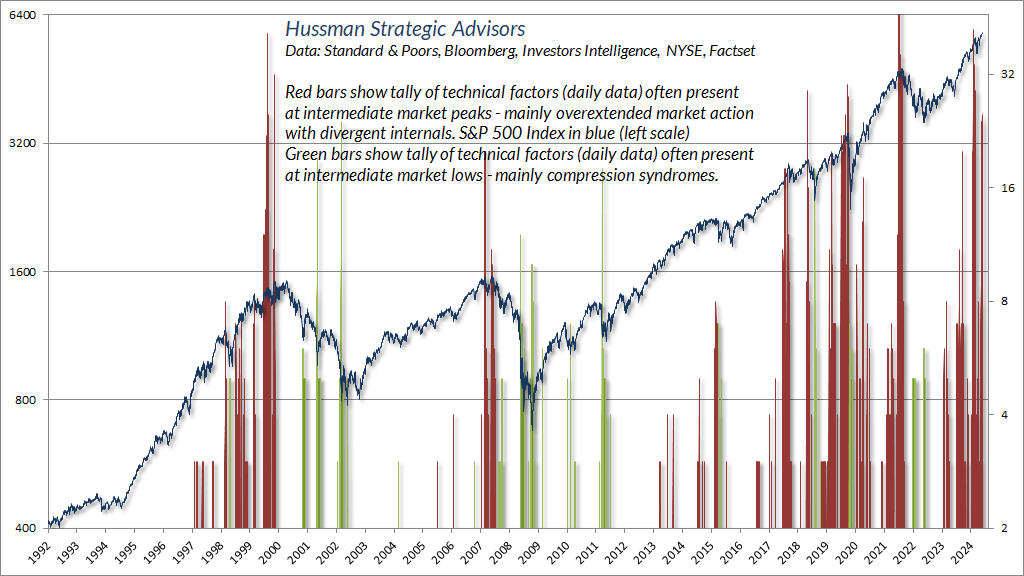
We see a similar surge in different, but related syndromes in daily data
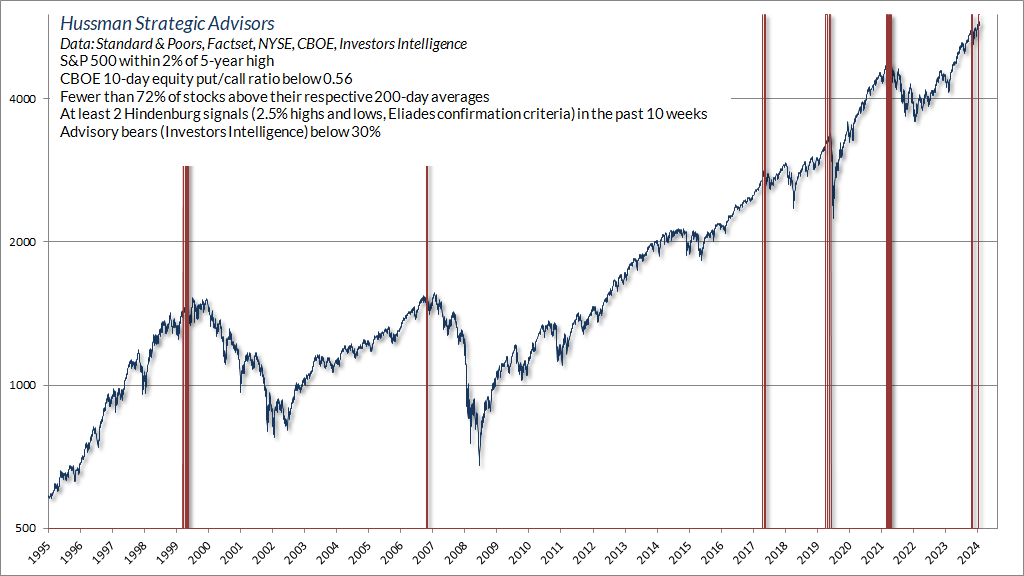
Below, for example, is one of the syndromes we’ve seen persistently over the past two weeks, basically suggesting a lack of downside concerns among investors.
Overall then, present market conditions reflect the most extreme valuations in the history of the U.S. financial markets, based on the measures that we find best-correlated with actual subsequent 10-12 year market returns and full-cycle market losses. Meanwhile, our key gauge of market internals also remains unfavorable.
As our own dedicated team knows, I’ve found it difficult to suppress my enthusiasm about last month’s adaptation to our hedging implementation – particularly relating to strike-price selection – to partition unfavorable periods that are associated with modest average losses versus those associated with wicked average losses. It solves a problem I’ve struggled with for much of the period since 2021, without forcing changes in our gauge of market internals that would deteriorate its historical reliability. Hopefully some of the discussion here conveys the reason for my enthusiasm. Given that our 2021 adaptation already drives us to a neutral or constructive outlook when market internals are favorable, I expect the greatest benefit of this hedging implementation will be a reduction in the “pain trades” that can emerge when the market advances uncharacteristically despite unfavorable internals.
In any event, I can’t emphasize enough that nothing in our investment discipline requires severe market losses, or an end to Fed interventions, to passive investing, or to glamour tech enthusiasm. We certainly have pointed expectations about various risks, but we don’t rely on any of them. Our investment stance will shift as measurable, observable conditions do.
Hussman Strategic Market Cycle
In recent months, the Securities and Exchange Commission has finalized its “names rule” for mutual funds, which is intended align various fund names with the specific investment securities they hold. In particular, “the primary types of names that the amended rule is anticipated to cover include fund names with terms such as ‘growth’ or ‘value’ or certain terms that reference a thematic investment focus, including terms indicating that the fund’s investment decisions incorporate one or more ESG factors.”
For us, the Strategic Growth Fund owes its name more to our long-term investment objective than to a specific goal of holding 80% of its investments in securities classified as “growth stocks.” The names rule also requires funds that hold options, for example, to use the notional amount of the options, rather than their market value, as part of the 80% calculation. From our standpoint, maintaining our investment discipline is much more important than maintaining the word “growth” in the fund name.
We’ve always described our approach as a value-conscious, historically-informed, full-cycle investment discipline. So we chose a new name that best reflects that discipline, and that also emerged as the clear preference from various discussions with shareholders and among our own staff. The new name – Hussman Strategic Market Cycle – will help investors to immediately understand our objective and should also help to distinguish us from the sea of benchmark-hugging passive funds available to investors. The new name will be effective on November 1, 2024, and the ticker will continue to be HSGFX.
Keep Me Informed
Please enter your email address to be notified of new content, including market commentary and special updates.
Thank you for your interest in the Hussman Funds.
100% Spam-free. No list sharing. No solicitations. Opt-out anytime with one click.
By submitting this form, you consent to receive news and commentary, at no cost, from Hussman Strategic Advisors, News & Commentary, Cincinnati OH, 45246. https://www.hussmanfunds.com. You can revoke your consent to receive emails at any time by clicking the unsubscribe link at the bottom of every email. Emails are serviced by Constant Contact.
The foregoing comments represent the general investment analysis and economic views of the Advisor, and are provided solely for the purpose of information, instruction and discourse.
Prospectuses for the Hussman Strategic Growth Fund, the Hussman Strategic Total Return Fund, and the Hussman Strategic Allocation Fund, as well as Fund reports and other information, are available by clicking Prospectus & Reports under “The Funds” menu button on any page of this website.
The S&P 500 Index is a commonly recognized, capitalization-weighted index of 500 widely-held equity securities, designed to measure broad U.S. equity performance. The Bloomberg U.S. Aggregate Bond Index is made up of the Bloomberg U.S. Government/Corporate Bond Index, Mortgage-Backed Securities Index, and Asset-Backed Securities Index, including securities that are of investment grade quality or better, have at least one year to maturity, and have an outstanding par value of at least $100 million. The Bloomberg US EQ:FI 60:40 Index is designed to measure cross-asset market performance in the U.S. The index rebalances monthly to 60% equities and 40% fixed income. The equity and fixed income allocation is represented by Bloomberg U.S. Large Cap Index and Bloomberg U.S. Aggregate Index. You cannot invest directly in an index.
Estimates of prospective return and risk for equities, bonds, and other financial markets are forward-looking statements based the analysis and reasonable beliefs of Hussman Strategic Advisors. They are not a guarantee of future performance, and are not indicative of the prospective returns of any of the Hussman Funds. Actual returns may differ substantially from the estimates provided. Estimates of prospective long-term returns for the S&P 500 reflect our standard valuation methodology, focusing on the relationship between current market prices and earnings, dividends and other fundamentals, adjusted for variability over the economic cycle. Further details relating to MarketCap/GVA (the ratio of nonfinancial market capitalization to gross-value added, including estimated foreign revenues) and our Margin-Adjusted P/E (MAPE) can be found in the Market Comment Archive under the Knowledge Center tab of this website. MarketCap/GVA: Hussman 05/18/15. MAPE: Hussman 05/05/14, Hussman 09/04/17.