
Going Nowhere in an Interesting Way

John P. Hussman, Ph.D.
President, Hussman Investment Trust
September 2019
It’s useful to remember that long-term returns represent not only trough-to-peak advances, but peak-to-trough resolutions as well. Buy-and-hold investors don’t get the trough-to-peak return. They get the full cycle return. Not surprisingly, the higher the valuation at the bull market peak, the longer the subsequent period of disappointing returns, in several instances extending more than a decade, though not without intermittent failure-prone bull market rallies to add excitement. This is what I often call ‘going nowhere in an interesting way.’
– John P. Hussman, Ph.D.
Risk Management is Generous, December 2004
Find a point in market history where reliable valuation measures were somewhere near their historical norms, and another similar point decades later, and you’ll generally find that the S&P 500 posted a fairly run-of-the-mill total return on the order of roughly 10% in the interim. But choose a start-date where the market was at historically elevated valuations, and an end-date featuring normal or depressed valuations, even a decade or more later, and you’ll typically find that the market went “nowhere in an interesting way” in the interim. Given current valuation extremes, that observation matters.
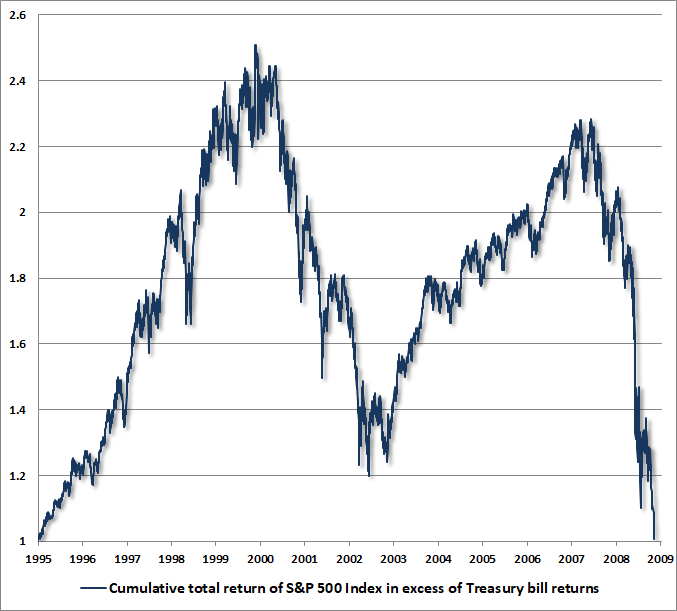
At extreme valuations, it’s important to remember that the completion of a hypervalued market cycle can wipe out every bit of the stock market’s total return over-and-above T-bills, going back not just a few years, but for over a decade. Despite all the gains that the stock market enjoyed during the “tech bubble,” and during the subsequent “mortgage bubble,” the decline to the March 2009 market low erased the entire total return of the S&P 500 over-and-above T-bill returns, all the way back to May 1995. Notably, the 2009 low occurred at valuations that were only moderately below their historical norms, and still nearly twice the levels observed at deep secular lows like 1949 and 1982.
The chart below shows the cumulative total return of the S&P 500, in excess of Treasury bill returns, from May 1995 to the March 2009 low. Once market valuations stand well above their historical norms, additional market returns have invariably been transient. As Kenny Rogers sang, “You never count your money when you’re sittin’ at the table.”
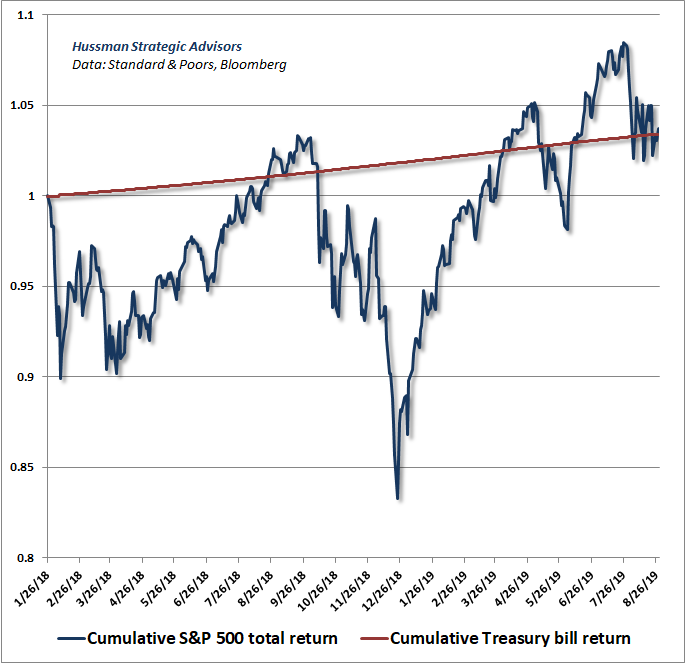
Indeed, while broad market internals have lagged the backward-looking exodus by investors into passive, large-cap indexing in recent quarters (especially among small-capitalization and value stocks), the S&P 500 itself has done no better than T-bills since its January 2018 pre-correction high. Market action has featured increasing dispersion and volatility, but little in the way of net progress.
At extreme valuations, it’s important to remember that the completion of a hypervalued market cycle can wipe out every bit of the stock market’s total return over-and-above T-bills, going back not just a few years, but for over a decade.
In my view, investors are on the cusp of yet another very long period in which the stock market is likely to go “nowhere in an interesting way.” The “interesting” part is more likely to begin with steep losses than a further advance from these levels, but it will remain important to monitor the behavior of market internals, particularly if market behavior becomes uniformly constructive, in contrast to its current ragged condition.
For now, as I observed in 2000 and 2007 based on similar conditions, I believe that the combination of hypervaluation and unfavorable market internals has opened a trap door that is permissive of abrupt and severe market losses.
Key market considerations
As I’ve regularly observed, valuations are the primary driver of market returns over a 10-12 year period, as well as potential downside risk over the completion of any given market cycle. But if valuations alone were enough to produce market losses, we would never observe hypervaluation like 1929, 2000, and today, because the market advance would have been halted at much lesser extremes.
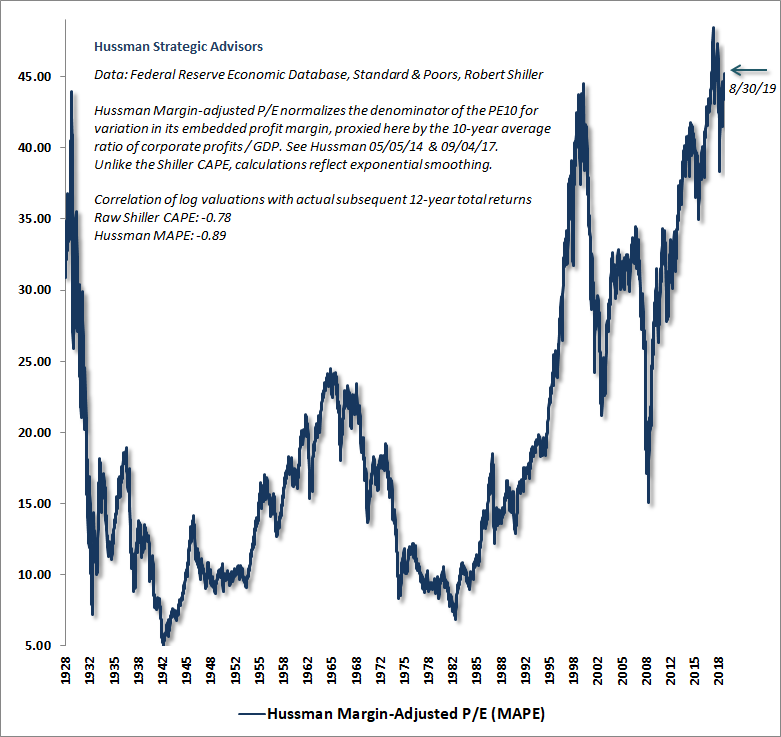
The chart below shows the Hussman Margin-Adjusted P/E (MAPE), which is better correlated with subsequent market returns than numerous popular alternatives such as price/forward earnings, the Shiller CAPE, or the so-called Fed Model. Despite a slight decline since January 2018 due to modest growth in fundamentals, this measure remains above both the 1929 and 2000 extremes.
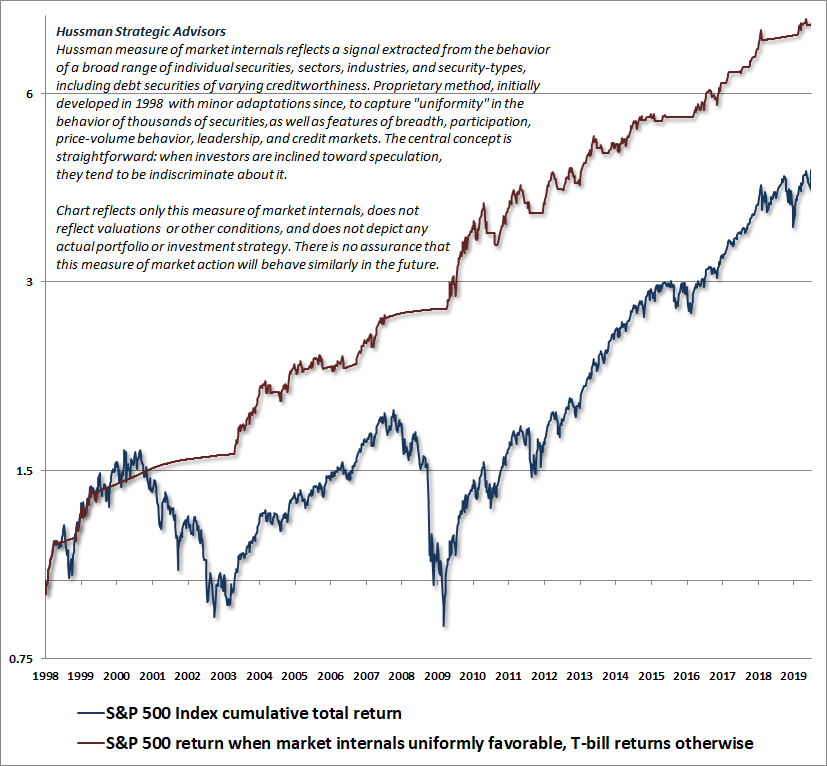
Still, extreme valuations are not necessarily enough to produce market losses. Over shorter segments of the market cycle, the primary driver of market returns is the inclination of investors toward speculation or risk-aversion, which we infer from the uniformity or divergence of market internals. We introduced this concept of “internal uniformity” to our investment discipline in 1998. The combination of unfavorable valuations and deteriorating market internals was exactly what allowed us to anticipate the 2000-2002 and 2007-2009 collapses.
The chart below shows the cumulative total return of the S&P 500 since 1998, along with the cumulative total return of the S&P 500 restricted only to those periods where market internals are favorable on our measures (accumulating Treasury bill returns otherwise). The chart is historical, does not reflect the performance of any portfolio, and there is no assurance that future market returns will be similarly related to these measures.
Emphatically, shifts in valuations and market internals have capably navigated every market cycle in history, including the most recent one. What gave us difficulty in this one was our bearish response to historically reliable “overvalued, overbought, overbullish” syndromes. In late-2017, we abandoned the idea that speculation has any definable “limits” at all, and we now require internals to deteriorate explicitly before adopting a negative market outlook. Sufficiently extreme conditions can warrant a neutral outlook, but we will not adopt or amplify a negative outlook unless we infer growing risk-aversion among investors, based on deterioration in our measures of market internals.
The steep losses of the S&P 500 in 2000-2002 and again in 2007-2009 were consistent with a century of historical experience. Given current market valuations, the prospect of yet another 10-12 year period of zero or negative returns for the S&P 500 would also be wholly consistent with a century of evidence. In contrast, the difficulty we experienced during the advancing half-cycle since 2009 resulted from an extraordinary departure from historical experience, and we’ve adapted our investment discipline to eliminate the key source of that difficulty.
Emphatically, shifts in valuations and market internals have capably navigated every market cycle in history, including the most recent one.
The chart below shows our MAPE on an inverted log scale (left), along with the actual total return of the S&P 500 over the following 12-year period (right). In recent decades, achieving historically normal market returns has required either depressed starting valuations at the beginning of the period or bubble valuations at the end of the period.
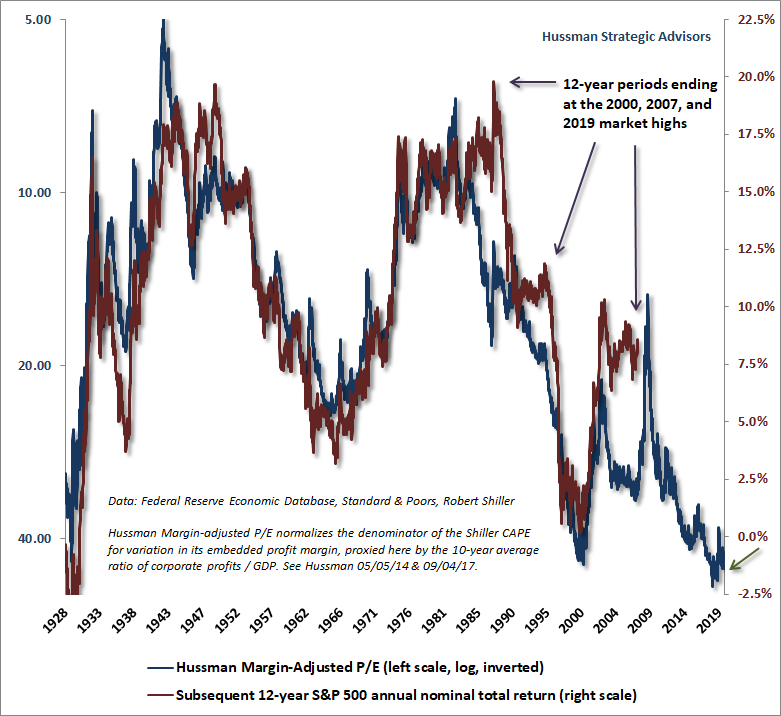
In general, elevated valuations are associated with market returns well below historical norms. It’s worth noting that the total return of the S&P 500 since 2000 has averaged just 5.4% annually, and it has taken a return to the most extreme valuations in U.S. history to produce that outcome. It won’t come as a surprise that I expect the entire total return of the S&P 500 since 2000 to be wiped out over the completion of the current market cycle.
The fortunate aspect of that outlook is that even if the market goes nowhere, it is likely to go nowhere in an interesting way, with both steep market losses and powerful market advances along that journey. I expect that a flexible attention to market conditions, particularly valuations and market internals, will help to identify and respond to changing opportunities and risks along the way.
Strategic Allocation
We are introducing a few new charts to our arsenal this month. These charts, and the methods behind them, are presented in our white paper, Strategic Allocation. The analysis has two main components – a value-focused allocation driven by our projections of risk-adjusted expected returns for stocks, Treasury bonds, and T-bills, and a risk-management component (primarily driven by market internals) to avoid building exposure too early to an undervalued but still risk-averse market, and also to avoid exiting too early from an overvalued but still speculative market.
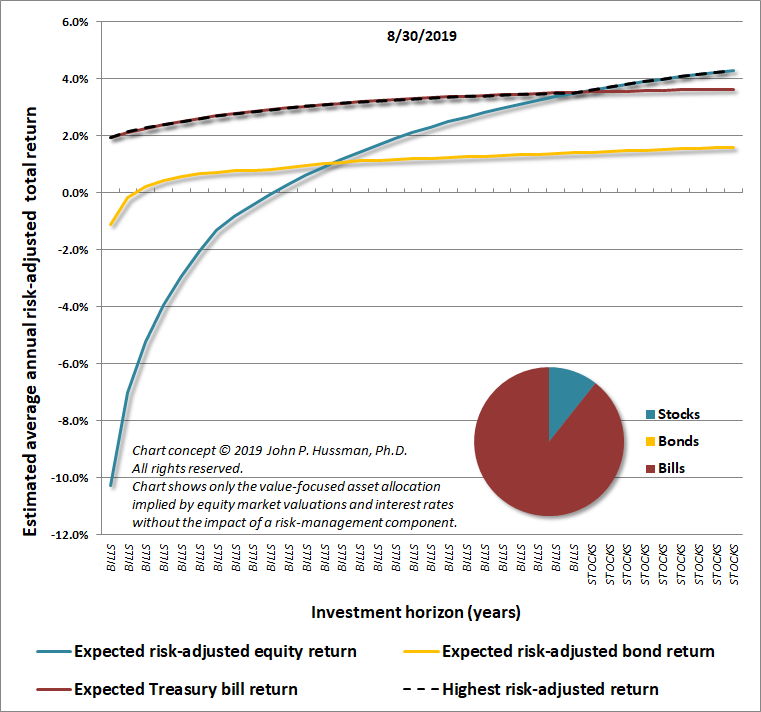
The chart below shows the current value-focused allocation implied by jointly considering both stock market valuations and prevailing interest rates. While there is a modest “speculative” reason to hold Treasury bonds, and a shift to favorable market internals would encourage some amount of constructive exposure to stocks as well, the value-focused allocation is strictly about the joint comparison of risk-adjusted prospective returns across a long investment horizon.
From a pure, value-focused perspective, the only reason to hold equities here is because their risk-adjusted returns appear likely to exceed bond returns and Treasury bill returns at the very longest investment horizons.
Don’t despair. Steep market losses have the capacity to entirely change that sort of market outlook even over the course of a couple of years, as we observed between 2000 and 2002, 2007 and 2009, and other episodes across history.
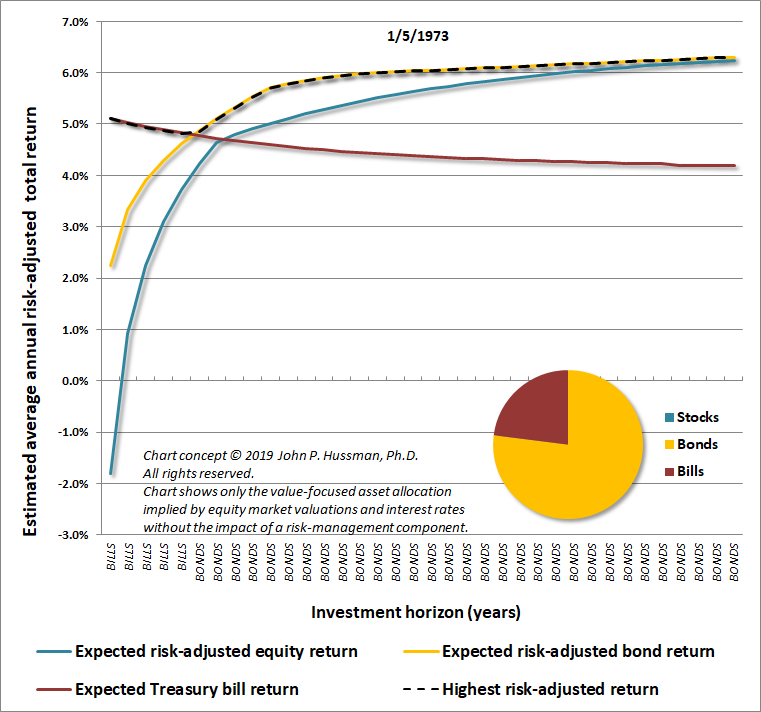
The following charts, for example, show our value-focused asset allocation approach based on data from January 1973 and October 1974. At the 1973 market peak, elevated stock market valuations suggested the likelihood of depressed stock market returns in the years ahead, yet Treasury bond yields were over 6% (as they were at the 2000 market peak). This combination encouraged a bond-centric asset allocation, with a moderate allocation to T-bills to account for the near-term uncertainty of bond returns.
By October 1974, however, the S&P 500 had lost half of its value, and the situation had completely changed. The value-focused allocation favored equities on every horizon, even considering the greater risk of stocks.
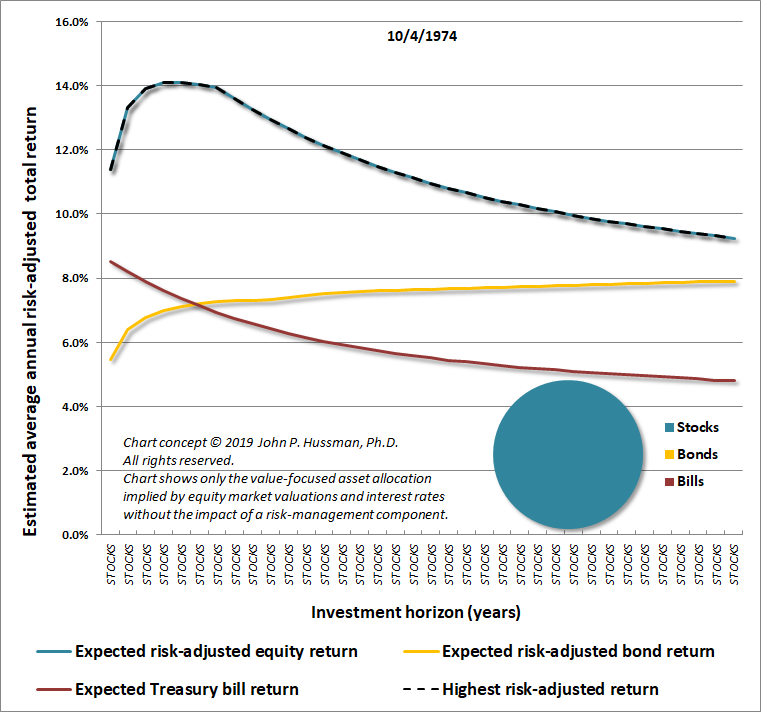
Unlike the 1972 and 2000 stock market peaks, when acceptably high bond yields provided a merciful alternative to overvalued stocks, we presently observe the combination of record-high stock market valuations (on the most reliable measures we identify), and severely depressed interest rates. From a pure, value-focused standpoint, this combination suggests the likelihood of low future returns across the board.
The idea that “low interest rates justify high stock valuations” is really a statement that “low interest rates justify low expected stock returns as well.” Those high stock valuations are still associated with low prospective future stock market returns.
Worse, the notion that “low interest rates justify high stock valuations” assumes that the growth rate of future cash flows is held constant, at historically normal levels. If, as we presently observe, interest rates are low because growth rates are low, no valuation premium is “justified” by low interest rates at all.
Presently, the combination of record low interest rates and record high stock market valuations does nothing but add insult to injury.
From a pure, value-focused perspective, the only reason to hold equities here is because their risk-adjusted returns appear likely to exceed bond returns and Treasury bill returns at the very longest investment horizons.
Remember, however, that valuations are only part of the analysis. Our market outlook continues to be informed by the condition of market internals and other factors. Despite the obscene hypervaluation of the market, our outlook will quickly become less defensive (though with a safety net) if fresh uniformity in market internals suggests that investors have shifted back to a speculative mindset.
Endowment-to-Spending
One of the concepts I introduce in Strategic Allocation is the idea of an “Endowment-to-Spending Multiple.” The estimated E/S Multiple answers the following question:
Suppose an investor has accumulated a lump-sum of savings, and wants to finance a long-term stream of real, inflation-adjusted spending. How large must the initial “endowment” be, as a multiple of annual spending, to finance those future outlays, assuming that it’s passively invested in a conventional portfolio mix (60% S&P 500, 30% Treasury bonds, 10% Treasury bills)?
As a convention, we assume a 36-year horizon, representing a 64-year-old investor hoping to fund spending over a potential 100-year lifespan. There’s nothing special about that horizon, and we obtain similar results using any horizon beyond about two decades, because long-dated distributions have very little impact on the total present value.
The chart below presents our estimate of the Endowment to Spending Multiple going back to 1928. The equity market return estimates are based on the Margin-Adjusted P/E before 1950, and the ratio of nonfinancial market capitalization to corporate gross value-added after 1950. The bond market return estimates use the yield to maturity on long-term Treasury bonds at varying horizons.
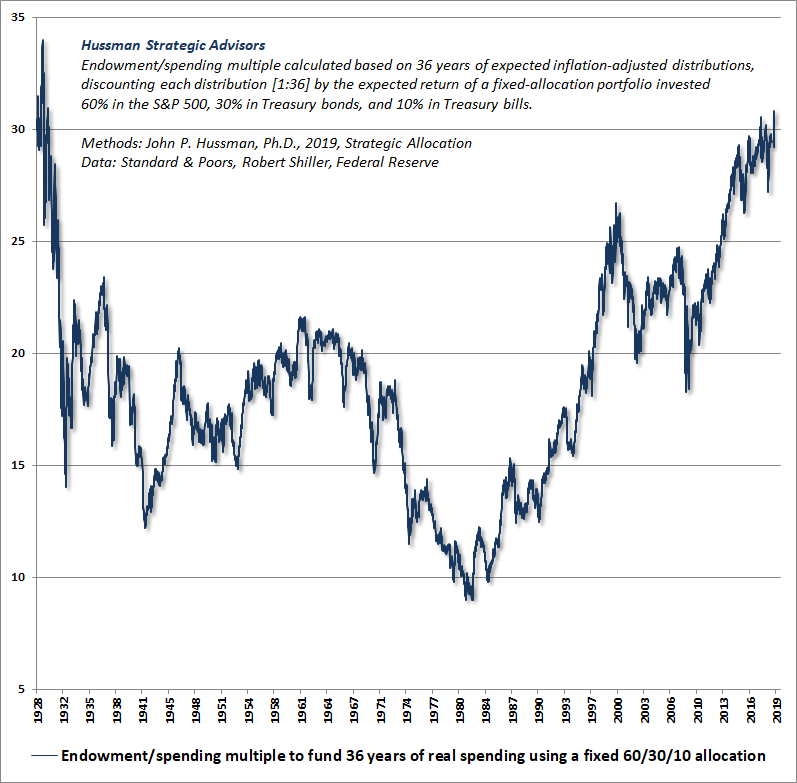
You’ll notice that the current E/S Multiple is over 31, which basically says that if you insist on passively investing a lump-sum in a conventional portfolio mix in order to fund your retirement, you’d better already have nearly all the dollars you hope to spend, because the prospects for significant long-term capital growth from present valuations are dismal. Contrast this with 2009, when the estimated E/S multiple was 18, or with 1982, when the E/S multiple fell to a record low of 9.
To offer a sense of how the E/S Multiple is related to subsequent investment returns, the chart below shows the E/S Multiple on an inverted log scale (left), along with the actual subsequent 12-year total return of a conventional 60/30/10 portfolio mix. You’ll notice, as always, that 12-year periods ending with bubble valuations (e.g. 1998-2000) can temporarily enjoy higher returns than one would have projected 12 years earlier on the basis of valuations alone. But those higher returns are typically surrendered over the completion of the market cycle.
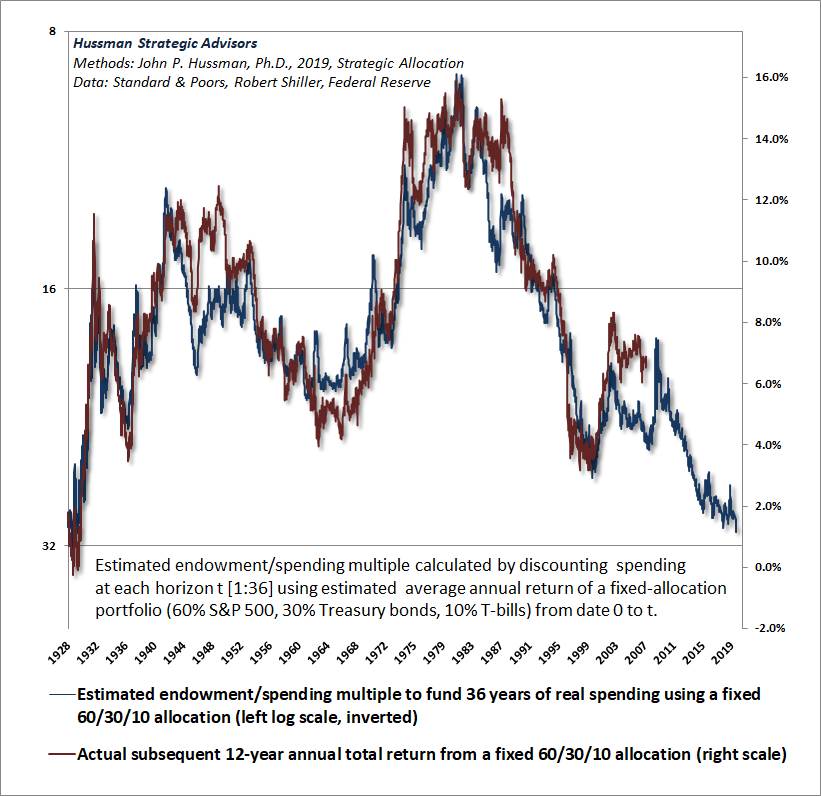
At present, our estimate of the prospective 12-year total return from a conventional passive portfolio mix is lower than at any point in history aside from the 1929 pre-crash market peak.
The reciprocal of the E/S Multiple is the expected annual “withdrawal rate” that a passive, conventional portfolio mix can be reasonably expected to tolerate. Right now, that rate is about 3.2% (based on our assumed 36-year spending horizon). As valuations come down, that withdrawal rate increases. In my view, it’s preferable to have a flexible allocation approach, so there’s some potential for avoiding major cyclical losses, as we have in other market collapses, and redeploy capital in response to a material retreat in valuations combined with an improvement in the uniformity of market internals.
If you insist on passively investing a lump-sum in a conventional portfolio mix in order to fund your retirement, you’d better already have nearly all the dollars you hope to spend, because the prospects for significant long-term capital growth from present valuations are dismal.
In any event, all of these conditions will change over time. For now, the combination of rich valuations and unfavorable market action discourages a material exposure to stocks. There is a modest speculative basis for Treasury bonds, given potential recession risk, but we also view fiscal deficits as “cyclically excessive,” which has ultimately been associated with inflation pressures.
As valuations and market internals change, we expect new opportunities to arrive, and present risks to dissipate. We’ll respond to these changes as they emerge.
Wait. What?!? Over a decade of S&P 500 returns no better than T-bill returns?
Undoubtedly, the idea that the total return of the S&P 500 could underperform Treasury bills for over a decade seems preposterous. Of course, that’s exactly what the S&P 500 did from May 1995 to March 2009.
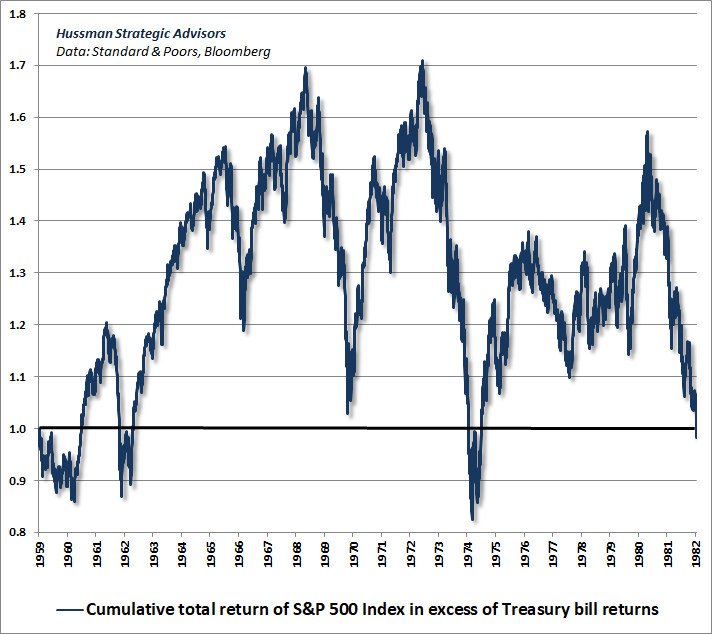
It’s also exactly what the S&P 500 did from August 1959 to August 1982.
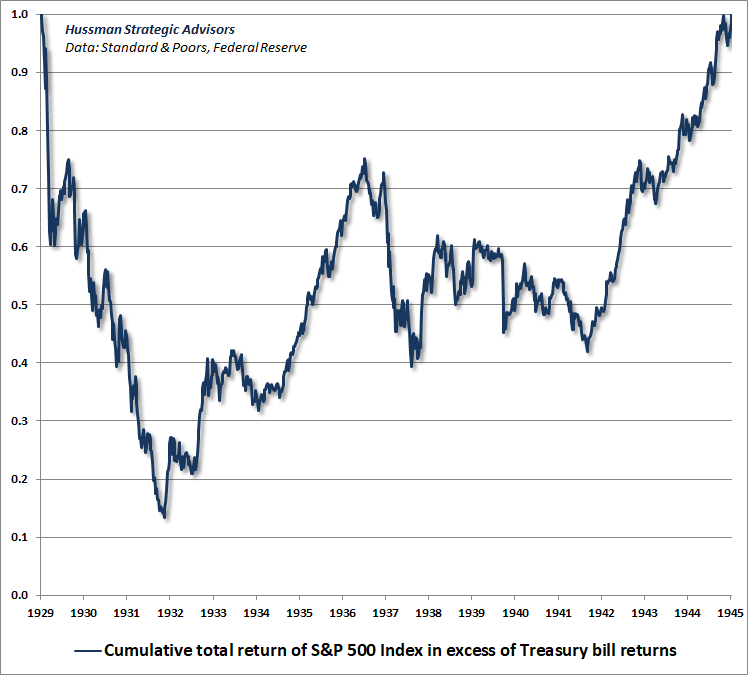
It’s also exactly what the S&P 500 did from August 1929 to August 1945.
There are several ways that outcomes like this can emerge. In the 1995-2009 instance, valuations began only about 30% above historical norms in 1995, and ended only about 10% below historical norms in 2009. Over a 14 year period, that modest shift in valuations works out to an annualized drag on total returns of about -2.6%. Growth in fundamentals brought the average annual capital gain of the S&P 500 to nearly 2%. Adding dividends, which contributed about 2% annually during the period, the total return of the S&P 500 averaged 3.7% annually, just below the annualized return of risk-free Treasury bills over that 14-year period.
That’s how the exuberant returns from two consecutive bubbles were entirely wiped out, relative to risk-free T-bills, over the complete market cycle. That outcome emerged despite the fact that market valuations at the beginning of that period weren’t nearly as extreme as we observe at present, and despite that fact that market valuations at the end of that period where only moderately below historical norms.
In the 1959-1982 instance, valuations began less than 20% above historical norms in 1959, but ended the period at an extreme secular valuation low in 1982, at a level that was less than half of historical norms. Even with nominal growth in fundamentals boosted by inflation during that period, the negative reaction of investors to inflation itself, along with a recession in 1981-82, resulted in a 23-year period during which the S&P 500 did no better than T-bills. That’s something to remember for those who imagine that faster inflation would somehow bail investors out from the consequences of extreme valuations here.
In the 1929-1945 instance, our most reliable valuation measures began about where they stand today – at over 2.7 times their historical norms. By 1945, S&P 500 valuations had declined to the point where they were about 0.6 times those norms. That decline in valuations amounted to a nearly -9% annual drag on total returns over the full 16-year period. Even growth in nominal GDP and corporate revenues of over 4% annually, plus an average S&P 500 dividend yield of over 5%, were insufficient to drive the total return of the S&P 500 above T-bill returns. The kicker is that T-bill yields averaged less than 1% during that period, and stocks still didn’t outperform.
Here’s an unpleasant full-cycle calculation. Within the 80-year period from 1929 to 2009, the S&P 500 took three long, interesting trips to nowhere, accounting for 53 of those years (1929-1945, 1959-1982, and 1995-2009), underperforming risk-free Treasury bills after all was said and done.
The current risk of yet another long, interesting trip to nowhere is easy to understand when one examines the underlying drivers of long-term stock market returns: 1) long-term growth in representative fundamentals; 2) changes in valuations (the ratio of market prices to those representative fundamentals); and 3) dividends received in the interim.
Let’s do this thing.
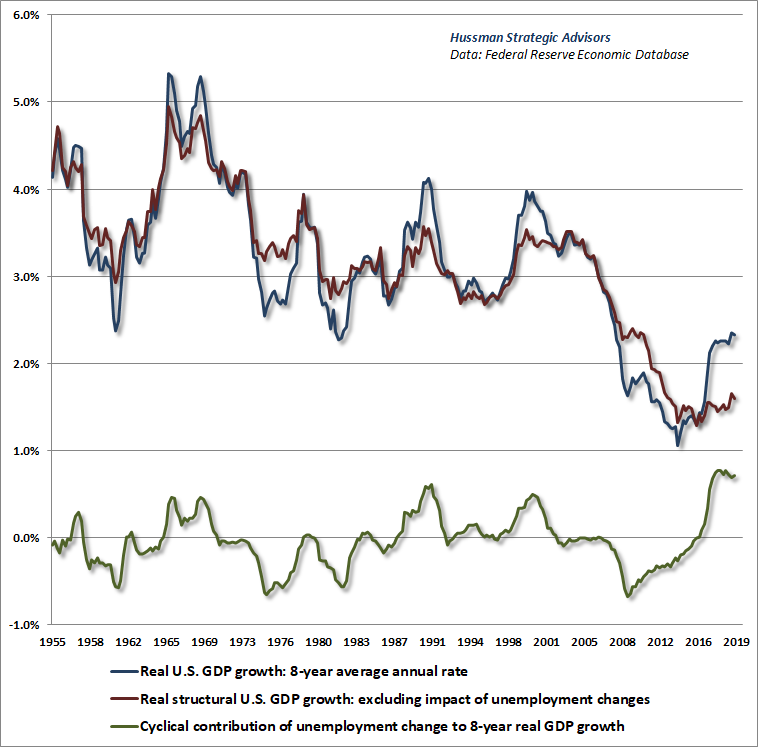
Presently, U.S. real structural economic growth is running at just 1.4% (reflecting the combination of demographic labor force growth and trend productivity growth, without the impact of cyclical changes in the unemployment rate).
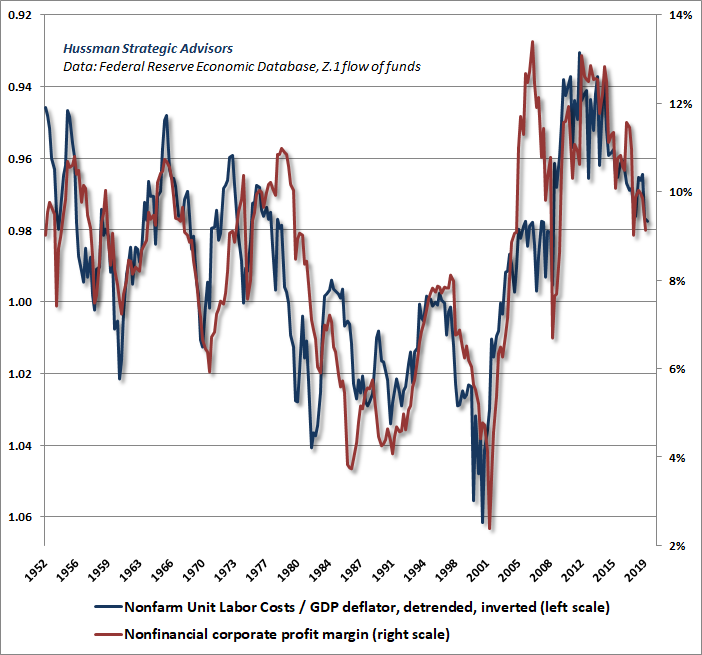
Meanwhile, upward pressure on real unit labor costs is already putting downward pressure on nonfinancial profit margins, so earnings growth is unlikely to outpace nominal growth in GDP and corporate revenues, as it has over the past decade.
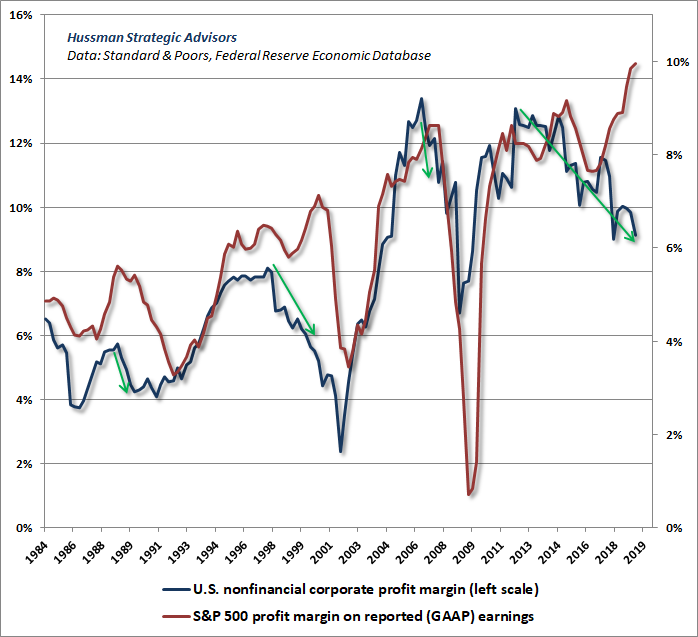
While S&P 500 profit margins remain near record highs here, it’s important to recognize that declines in profit margins for the S&P 500 regularly lag declines in economy-wide profit margins among nonfinancial companies.
Put these factors together, and even assuming slightly higher productivity and an acceleration of inflation to at least 2%, nominal growth in GDP, corporate revenues, and corporate earnings over coming decade is likely to average only about 4% annually. Indeed, S&P 500 revenues have grown at only that rate for nearly two decades now.
Now do some basic arithmetic. The most reliable valuation measures we’ve identified across history are presently an average of 2.7 times their historical norms. Assuming 4% nominal growth in fundamentals, and a future valuation multiple that simply touches its historical norm fully 20 years from today, the resulting average annual capital gain for the S&P 500 would be: (1.04)*(1/2.7)^(1/20)-1 = -1.0%. Add in the S&P 500 dividend yield, currently at just 2%, and we should not be surprised if the S&P 500 performs little better than T-bills over the next couple of decades.
That’s exactly how investors can get these very long interesting trips to nowhere.
The current risk of yet another long, interesting trip to nowhere is easy to understand when one examines the underlying drivers of long-term stock market returns: 1) long-term growth in representative fundamentals; 2) changes in valuations (the ratio of market prices to those representative fundamentals); and 3) dividends received in the interim.
It should come as no surprise that the as long as one uses a reliable valuation measure (we prefer our MAPE or MarketCap/GVA), the same basic arithmetic produces surprisingly accurate projections across a century of market data, especially for 10-12 year returns. In data between 1950 and 2000, you’ll get even closer by assuming slightly higher nominal growth of about 6.5%, reflecting structural real economic growth closer to 3% and inflation closer to 3.5% during that period.
Meanwhile, I can’t stress enough that the prospects for long-term stock market returns can change dramatically even over a period of one or two years. Unfortunately, they change as a result of large downward adjustments in market valuations. In the interim, even if we don’t observe a severe retreat in valuations, we are likely to observe periods where investor psychology leans toward speculation rather than risk-aversion, and it should be enough to align ourselves with those shifts (which we infer from the uniformity or divergence of market internals).
What investors should avoid is embracing a great deal of market exposure in periods where both valuations and market internals are hostile. Those are the conditions from which market collapses like 2000-2002 and 2007-2009 have historically emerged. Those are the conditions we presently observe. Our outlook will change as those conditions change.
How would negative interest rates affect market prospects?
One of the most frequent questions I’ve received recently is whether the prospect of negative interest rates might support elevated market valuations forever, and defer the completion of this market cycle indefinitely.
Leaving aside any political or economic considerations that surround this issue, the most direct answer is this: Across history, emphatically including the most recent market cycle, the response of the stock market to monetary policy has always been conditional on whether investors are inclined toward speculation or toward risk-aversion, and the best measure of that is to monitor the condition of market internals directly.
When investors are inclined toward risk-aversion, risk-free liquidity is a desirable asset, not an inferior one, so as we observed during previous market collapses, even aggressive monetary easing does nothing to support the market. In contrast, when investors are inclined toward speculation, risk-free liquidity is an inferior “hot potato,” and monetary easing amplifies that speculation.
Our key lesson during the recent half-cycle was that zero interest rate policy was able to encourage speculation even in the face of the most extreme “overvalued, overbought, overbullish” syndromes of market conditions. Yet even during this period, market internals continued to be a reliable gauge.
It’s certainly possible for monetary easing to encourage a shift in investor psychology from risk-aversion toward speculation, but that potential should be gauged directly from market internals. To do otherwise, by assuming that monetary easing will necessarily support stock prices, is exactly what investors did in response to Fed easing at the very beginning of the 2000-2002 and 2007-2009 bear markets.
My sense is that the reason this question keeps emerging is that some investors haven’t fully internalized our central lesson from the recent half-cycle, which is that no matter how overvalued over overextended the market may be, we have to defer any expectation of near-term market losses whenever market internals indicate – for whatever reason, negative interest rates included – that investors have taken the speculative bit back in their teeth.
So could negative interest rates, or fresh QE, or something else defer the negative implications of current valuation extremes indefinitely? I doubt it, but it’s entirely unnecessary to rule it out, because the way to gauge that prospect is to monitor market internals directly. That’s what we’re doing. It’s enough to monitor essential factors like valuations and market internals, and to shift our outlook when the evidence shifts. There’s nothing to be gained by imagining or worrying about countless “what if” scenarios about how or when the evidence will change.
That said, a few comments about negative interest rates may be helpful.
Presently, the Federal Reserve pays interest to banks on their excess reserves, which is the only way to keep rates from sitting at zero, given the quantity of reserves it has created. Indeed, the Fed would have to contract the monetary base by about $1.4 trillion in order for Treasury bill rates to stand at 2% without the payment of interest on excess reserves (IOER).
In contrast, the European Central Bank (ECB) and Bank of Japan (BOJ) actually charge banks interest on their excess reserves, at a rate of -0.4% and -0.1%, respectively. Negative interest rates aren’t some “equilibrium” outcome of a weak economy. They’re a product of sheer coercion. That coercion is exerted charging interest on bank reserves that someone has to hold at every moment in time, either until they are retired by the central banks, or until the entire contents of the European and Japanese banking systems are dumped into mattresses and personal safes.
There’s no evidence that these extraordinary policies do anything for the economy, or even to boost inflation (though as I’ve noted before, the fact that we’re beginning to observe what I call “cyclically excessive deficits” in fiscal policy suggests that we may very well see inflation in the years ahead anyway). The fact is that the trajectory of the recent economic expansion has followed the trajectory of nearly every other U.S. economic expansion, whereby the output gap at the recession low contracts at a rate of about 8% per quarter. Quantitative easing and zero interest rates did nothing to perturb that trajectory.
And why should it? If investors have chosen to save for their future spending needs in retirement, driving interest rates lower doesn’t cause them to suddenly throw up their hands and say, oh heck, let me blow it all on a new car. There might be some economic activities on the margin that are so unproductive that they couldn’t survive a hurdle rate of 2%, but become possible at 0%, but most of those activities are financial in nature, where interest expense is the primary cost of doing business. Let’s be clear: the beneficiary of extraordinary monetary policy is not productive real economic activity, but speculative financial activity.
Notably, once a central bank creates base money, someone in the economy must hold that base money at every point in time, until it is retired. In aggregate, there’s no “getting out of it” by buying stocks or anything else. The seller just gets the base money instead. So base money is a hot potato, and the use of it by central banks is the underlying cause of speculative havoc.
We saw this during the housing bubble. Once the Fed dropped interest rates to just 1%, investors began seeking other assets that they believed to be “safe,” and found them in mortgage bonds. The rabid demand for mortgage bonds was satisfied by Wall Street, which dutifully created new “product” by making new mortgage loans to anyone with a pulse. The resulting speculation ended with the global financial crisis.
Of course, these monetary hot potatoes wreak even greater havoc when the speculation bleeds over into increasingly risky assets, as it has in the recent half-cycle. The objects of speculation have included everything from government debt, common stocks, corporate debt, and “covenant-lite” leveraged loans and junk debt offering minimal protection to investors in the event of default.
The thing that enables this sort of speculation is what I’d call the “carry-trade mentality” – the assumption that risky assets cannot decline in price, so any asset yielding more than the risk-free interest rate is worth owning. The hallmark of this kind of speculative mindset is that it is indiscriminate, so we can infer that psychological inclination based on the uniformity of market internals.
Once internals shift from indiscriminate uniformity to deterioration and ragged divergence, we infer that investor psychology has quietly moved away from speculation and toward risk-aversion. A key feature of risk-aversion is that it destroys the carry-trade mentality. At that point, investors consider not only the yield of a given investment, but also the risk of price losses. This is why the S&P 500 was able to lose 50% or more of its value in the 2000-2002 and 2007-2009 collapses despite persistent and aggressive easing by the Federal Reserve.
It’s enough to monitor essential factors like valuations and market internals, and to shift our outlook when the evidence shifts. There’s nothing to be gained by imagining or worrying about countless ‘what if’ scenarios about how or when the evidence will change.
Ok, so imagine that the Fed eliminates interest on excess reserves, and even begins to emulate the ECB and BOJ by charging interest on excess reserves, to the point where U.S. interest rates drop below zero, say, to -0.50%. Imagine that market internals are ragged, as they are at present, indicating that investors are inclined toward risk-aversion, potentially reflecting concern about a U.S. recession or other matters. Finally, imagine that stock market valuations remain far above historical valuation norms, as they are at present, where the measures best-correlated with actual subsequent S&P 500 returns easily rival their 1929 and 2000 peaks, and exceed the 2007 extreme.
The thought experiment is this. What do you think investors would prefer in that environment of hypervalued prices and risk-averse psychology: the predictable loss of half of one percent on the risk-free investment, or the potential loss of fifty percent on the risky one? The answer is simple: lose the speculative “carry-trade mentality,” and you simultaneously lose the ability of extraordinary monetary policy to support overvalued risky assets.
That’s not to say that it’s impossible for extraordinary monetary policy, or other factors, to restore a speculative mentality among investors. The point, and the bottom line, is that it’s essential to ask whether investors are inclined toward speculation or risk-aversion (which we infer from the uniformity or divergence of market internals), rather than responding directly to monetary policy per se.
Keep Me Informed
Please enter your email address to be notified of new content, including market commentary and special updates.
Thank you for your interest in the Hussman Funds.
100% Spam-free. No list sharing. No solicitations. Opt-out anytime with one click.
By submitting this form, you consent to receive news and commentary, at no cost, from Hussman Strategic Advisors, News & Commentary, Cincinnati OH, 45246. https://www.hussmanfunds.com. You can revoke your consent to receive emails at any time by clicking the unsubscribe link at the bottom of every email. Emails are serviced by Constant Contact.
The foregoing comments represent the general investment analysis and economic views of the Advisor, and are provided solely for the purpose of information, instruction and discourse.
Prospectuses for the Hussman Strategic Growth Fund, the Hussman Strategic Total Return Fund, the Hussman Strategic International Fund, and the Hussman Strategic Dividend Value Fund, as well as Fund reports and other information, are available by clicking “The Funds” menu button from any page of this website.
Estimates of prospective return and risk for equities, bonds, and other financial markets are forward-looking statements based the analysis and reasonable beliefs of Hussman Strategic Advisors. They are not a guarantee of future performance, and are not indicative of the prospective returns of any of the Hussman Funds. Actual returns may differ substantially from the estimates provided. Estimates of prospective long-term returns for the S&P 500 reflect our standard valuation methodology, focusing on the relationship between current market prices and earnings, dividends and other fundamentals, adjusted for variability over the economic cycle.

