

Are We There Yet?


John P. Hussman, Ph.D.
President, Hussman Investment Trust
July 2022
For our part, we ultimately adapted to deranged Fed policies by becoming content to gauge the presence or absence of speculative psychology – based on the uniformity or divergence of market internals – without assuming that either speculation or risk-aversion have reliable limits. So yes, this time was different, but in a very dangerous way. Faced with a zero-interest rate world that combined ‘fear of missing out’ with a belief that ‘there is no alternative’ to yield-seeking speculation, investors unwittingly drove the most reliable stock market valuation measures to levels beyond the 1929 and 2000 extremes. Unfortunately, those valuations also imply dismal long-term returns in any world not permanently dominated by FOMO and TINA psychology. Measured from the recent bubble peak, the likely consequence will be a long, interesting, 10-20 year trip to nowhere for the S&P 500. There’s also a strong possibility of an interim loss in the S&P 500 in the range of 50-70% over the completion of this market cycle, or as we observed between 2000-2009, a sequence of cyclical lows punctuated by several extended recoveries.
– John P. Hussman, Ph.D., April 2022, Repricing a Market Priced for Zero
Lao Tzu wrote, “A journey of a thousand miles begins with a single step.” In recent months, the financial markets have taken the first step toward normalization. Unfortunately, having taken one step, the most prominent question we hear is “Are we there yet?!?”
If “there” means valuations anywhere near levels that are consistent with historically run-of-the-mill long-term returns; if “there” means a monetary policy stance anywhere near something that would promote productive capital allocation without speculative distortion; if “there” means financial market capitalizations that can actually be served by the cash flows generated by the economy, providing adequate long-term returns without relying on endless expansion in valuation multiples; then, no. We are not “there.”
The problem is that after a decade of deranged monetary policies that ultimately amplified speculation beyond 1929 and 2000 extremes, we are so far from “normal’ that arriving anywhere near that neighborhood will be a journey. The recent market decline has simply retraced the frothiest portion of the recent bubble, bringing the most reliable market valuation measures back toward their 1929 and 2000 extremes.
For our part, we don’t need to assume, and certainly don’t need to rely, on a return to historically run-of-the-mill valuations, nor would we rule it out. We should allow for periods of market free-fall, as well as “fast, furious, prone-to-failure” advances to clear oversold conditions. Our practice – our discipline – is to remain in the present moment: to align our investment outlook with observable and measurable conditions such as valuations and market internals, and to change our outlook as those conditions change. While the present combination of extreme valuations and ragged market internals creates a “trap door” situation, improvement in the uniformity of market internals could encourage us to lean more constructive even here. No specific forecasts, end-of-year price targets, or scenarios are required.
The chart below shows our estimate of expected 12-year nominal total returns for a conventional passive portfolio mix invested 60% in the S&P 500, 30% in Treasury bonds, and 10% in Treasury bills (blue) along with the actual total return of that portfolio (red) for periods where the full horizon has been completed. Notice that actual returns tend to “lift away” from their corresponding 12-year projections when the end of the investment horizon occurs at extreme valuations. These deviations reflect the accrual of speculative gains, which tend to be surrendered during subsequent market collapses (more in the valuation section below).
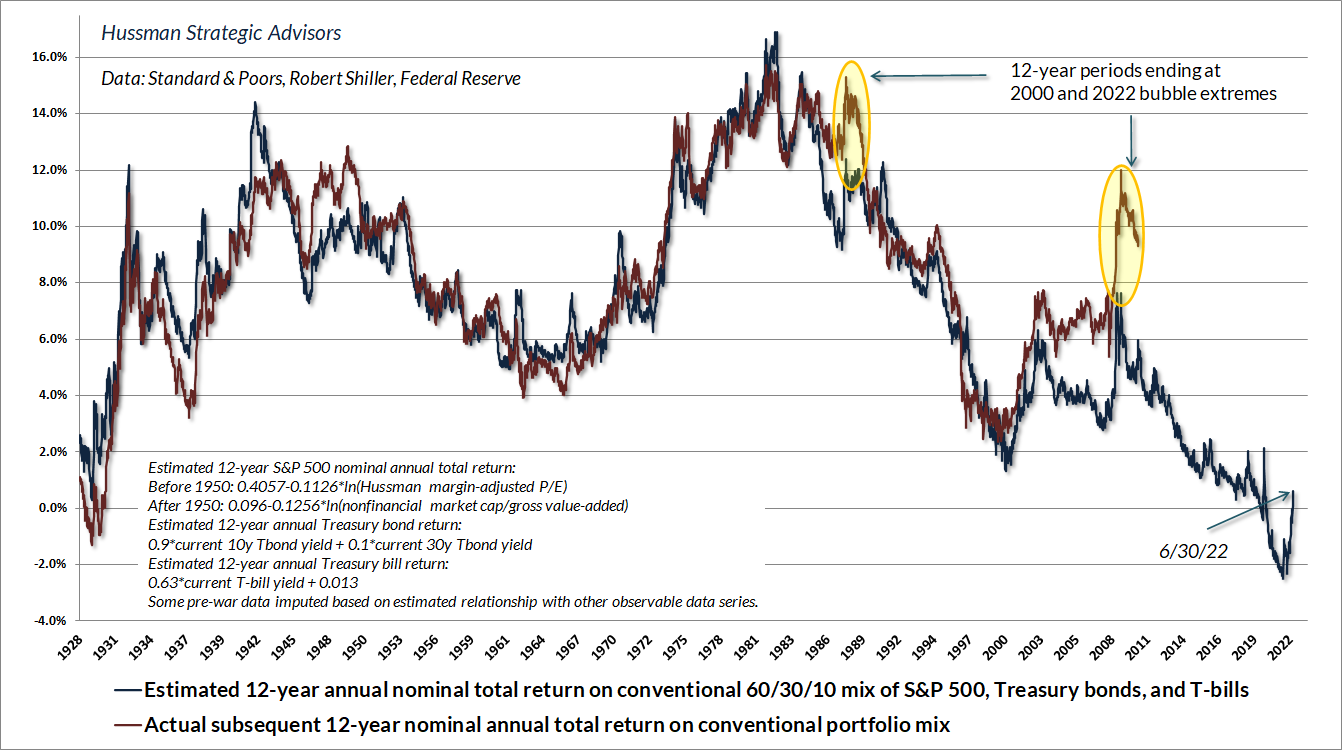
If you’re wondering why a passive investment allocation has experienced severe losses year-to-date, it’s largely because the assets began 2022 at valuations that provided no margin of safety. As stock and bond market valuations have retreated in recent months, our total return estimate for a conventional portfolio mix has improved. Unfortunately, that estimate is only slightly above zero.
Because the return assumptions of pensions and endowments tend to reflect historical averages rather than drawing information from actual market valuations, the likely shortfall of returns in the decade ahead can be expected to result in funding shortfalls for pensions, retirement accounts, charities, and endowments. This is the unfortunate situation that zero interest rate policies have created for investors. Speculation can certainly create the temporary illusion of prosperity, but ultimately, the wealth is in the cash flows.
A bubble’s last words are “It always comes back”
During the latter stage of the bull market culminating in 1929, the public acquired a completely different attitude towards the investment merits of common stocks… Why did the investing public turn its attention from dividends, from asset values, and from average earnings to transfer it almost exclusively to the earnings trend, i.e. to the changes in earnings expected in the future? The answer was, first, that the records of the past were proving an undependable guide to investment; and, second, that the rewards offered by the future had become irresistibly alluring.
Along with this idea as to what constituted the basis for common-stock selection emerged a companion theory that common stocks represented the most profitable and therefore the most desirable media for long-term investment. This gospel was based on a certain amount of research, showing that diversified lists of common stocks had regularly increased in value over stated intervals of time for many years past.
These statements sound innocent and plausible. Yet they concealed two theoretical weaknesses that could and did result in untold mischief. The first of these defects was that they abolished the fundamental distinctions between investment and speculation. The second was that they ignored the price of a stock in determining whether or not it was a desirable purchase.
The notion that the desirability of a common stock was entirely independent of its price seems incredibly absurd. Yet the new-era theory led directly to this thesis… An alluring corollary of this principle was that making money in the stock market was now the easiest thing in the world. It was only necessary to buy ‘good’ stocks, regardless of price, and then to let nature take her upward course. The results of such a doctrine could not fail to be tragic.
– Benjamin Graham & David L. Dodd, Security Analysis, 1934
I could post that quote every single month, and all of us would be better for it. Graham & Dodd’s description of how investors became willing to passively invest in 1929 – without regard for valuations – might well have been written yesterday.
Valuations are the most reliable gauge of long-term market returns, as well as potential losses over the completion of any given market cycle. Our best measures have a correlation of about 0.9 with subsequent 10-12 year S&P 500 total returns. Yet valuations often have little to do with market outcomes over shorter segments of the market cycle. If overvaluation alone was enough to stop a market advance, it would be impossible for the market to reach the obscene levels of hypervaluation we observed in 1929, 2000, and early this year.
Over shorter segments of the market cycle, market fluctuations are heavily affected by investor psychology – which we infer from market action. When investors are inclined to speculate, they tend to be indiscriminate about it. Since 1998, our most reliable gauge of speculation versus risk-aversion has been the uniformity or divergence of market internals across thousands of securities, industries, sectors, and security-types, including debt securities of varying creditworthiness.
The strongest market returns typically emerge when reasonable valuations are joined by speculative investor psychology. The most profound market losses typically emerge when extreme valuations are joined by risk-averse investor psychology. The same is true for bonds. The highest returns emerge when a high yield is being driven lower. The deepest losses emerge when a low yield is being driven higher. That, in a nutshell, is why both valuations and market internals matter.
Our discipline of combining valuations and market internals helped us to admirably navigate decades of market cycles, including multiple bubbles and collapses, prior to the Federal Reserve’s deranged foray into zero-interest rate policies. As value-conscious investors, the persistent speculation encouraged by zero-interest rate policy was a challenge. Our main adaptation to the Fed’s unprecedented distortion was to preserve our focus on valuations and market internals, but to abandon our reliance on previously reliable “limits” to speculation. That adaptation has nicely restored flexibility to our discipline during the generally advancing but volatile period since 2019. With that flexibility, the Fed can do whatever it likes. We’ll be just fine, thanks.
The danger for investors is that they have learned all the wrong lessons from this bubble. They’ve come to believe that valuations can be ignored, and that Fed easing is omnipotent. They’ve come to believe that “it always comes back.” They’ve learned to embrace passive investing, because they look back over their shoulder at prices that have gone nowhere but up, and conclude that attending to valuations would have been costly and useless. They’ve come to imagine that more risk means more return, regardless of the prices they pay to get in. All these misguided beliefs will be their undoing.
Investors “learn” the wrong lessons because they imagine that if valuations are not consistently useful in and of themselves, they’re not useful at all. This requirement is entirely unnecessary. There are effective ways to invest solely on the basis of valuations, but they tend to be excruciating to follow in practice. Yet that doesn’t mean valuations should be ignored. Rather, it emphasizes that valuations and market internals are complementary.
Historically, when trend uniformity has been positive, stocks have generally ignored overvaluation, no matter how extreme. When the market loses that uniformity, valuations often matter suddenly and with a vengeance. This is a lesson best learned before a crash rather than after one. Valuations, trend uniformity, and yield pressures are now uniformly unfavorable, and the market faces extreme risk in this environment.
– John P. Hussman, Ph.D., October 3, 2000
One of the best indications of the speculative willingness of investors is the ‘uniformity’ of positive market action across a broad range of internals. Probably the most important aspect of last week’s decline was the decisive negative shift in these measures. Since early October of last year, I have at least generally been able to say in these weekly comments that ‘market action is favorable on the basis of price trends and other internals.’ Now, it also happens that once the market reaches overvalued, overbought and overbullish conditions, stocks have historically lagged Treasury bills, on average, even when those internals have been positive (a fact which kept us hedged). Still the favorable internals did tell us that investors were willing to speculate, however abruptly that willingness might end. Evidently, it just ended, and the reversal is broad-based.”
– John P. Hussman, July 30, 2007
It will help to learn the right the lesson from the recent bubble. In the face of deranged Fed policy, historically-reliable “limits” to speculation became useless and even detrimental. In previous market cycles, extreme “overvalued, overbought, overbullish” features of market action took priority over other considerations, including market internals. In this cycle, one had to become content to gauge the presence or absence of speculation or risk-aversion, without assuming well-defined “limits” to either.
Emphatically, both valuations and market internals remain indispensable. Reliable valuation measures provide a breathtaking view of long-term returns and potential full-cycle losses, because these measures began 2022 at levels even beyond their 1929 and 2000 extremes. Market internals provide flexibility to navigate the market over intermediate horizons, even if valuations remain elevated. When investors are inclined to speculate, markets can advance simply because the buyers have become more eager and the sellers have backed away.
Given the speculative bubble of recent years, it’s important be two-sided about not relying on “limits.” Once a bubble defies “limits” on the upside, it can also defy them on the downside. As Steven Hochberg and Peter Kendall of EWI recently observed, “The public’s memory for former high prices usually proves to be more of a liability than an asset.”
The danger for investors is that they’ve learned all the wrong lessons from this bubble. They’ve come to believe that valuations can be ignored, and that Fed easing is omnipotent. They’ve come to believe that ‘it always comes back.’ They’ve learned to embrace passive investing, because they look back over their shoulder at prices that have gone nowhere but up, and conclude that attending to valuations would have been costly and useless. They’ve come to imagine that more risk means more return, regardless of the prices they pay to get in. All these misguided beliefs will be their undoing.
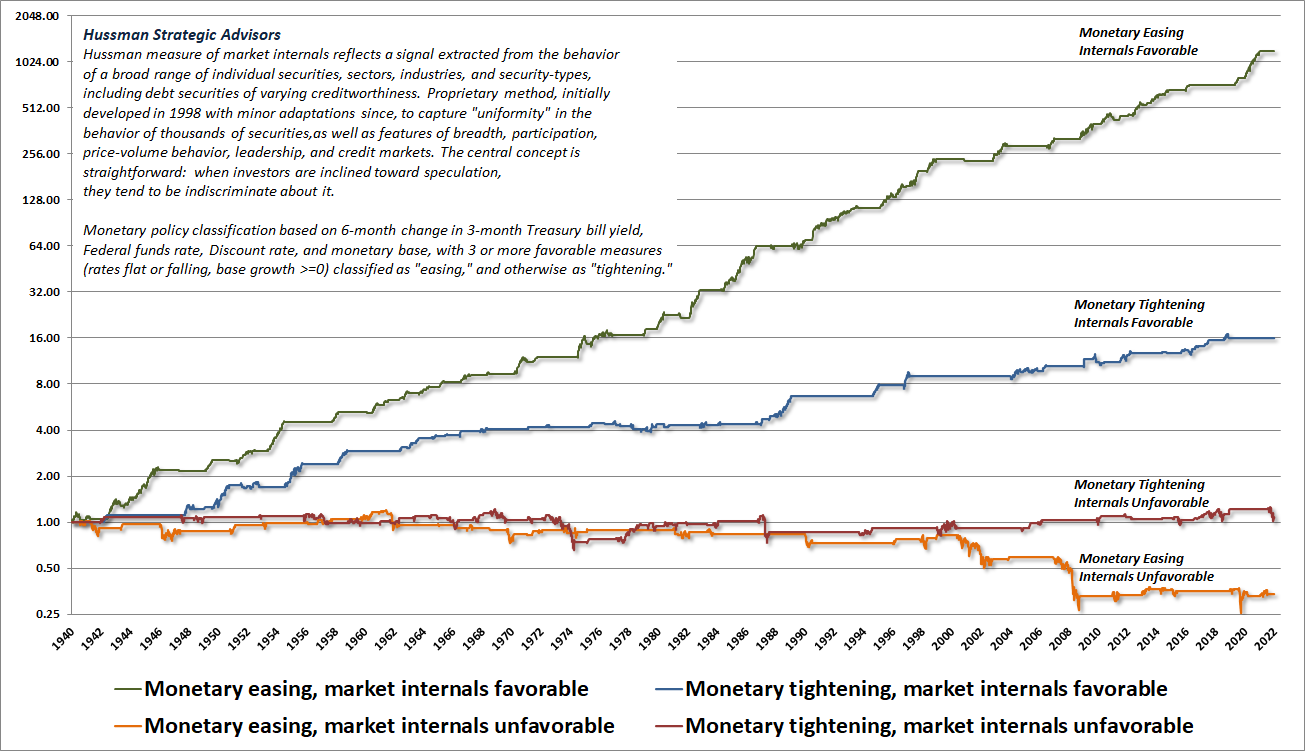
As for the delusion that easy money reliably supports stock prices, what investors seem to forget is that the Fed eased persistently and aggressively throughout the 2000-2002 and 2007-2009 market collapses. The Fed began easing cycles in July 1981, June 1989, January 2001, and September 2007. Those periods of easy money coincided with the 1981-82, 1990, 2000-2002 and 2007-2009 bear markets. When investors are inclined toward risk-aversion, safe liquidity is seen as a desirable asset, not an inferior one, so creating more of the stuff doesn’t support the market. It’s only when investors are inclined to speculate (and thereby rule out capital losses) that risk is preferred to a zero return.
The chart below illustrates this dynamic, showing the cumulative total return of the S&P 500 across four mutually exclusive combinations of monetary policy and market internals. If you’re making investment decisions by “following the Fed,” you’re quietly relying on the assumption that investors are inclined toward speculation rather than risk-aversion. That may or may not be true (presently it is not), so it’s best to gauge that psychology as directly as possible.
Valuations – are we “there” yet?
A financial security is nothing more than a claim on some future stream of cash flows that investors expect to be delivered into their hands over time. The higher the price an investor pays for those future cash flows, the lower the long-term return the investors can expect to enjoy. The relationship between current price, future cash flows, and investment return is just arithmetic.
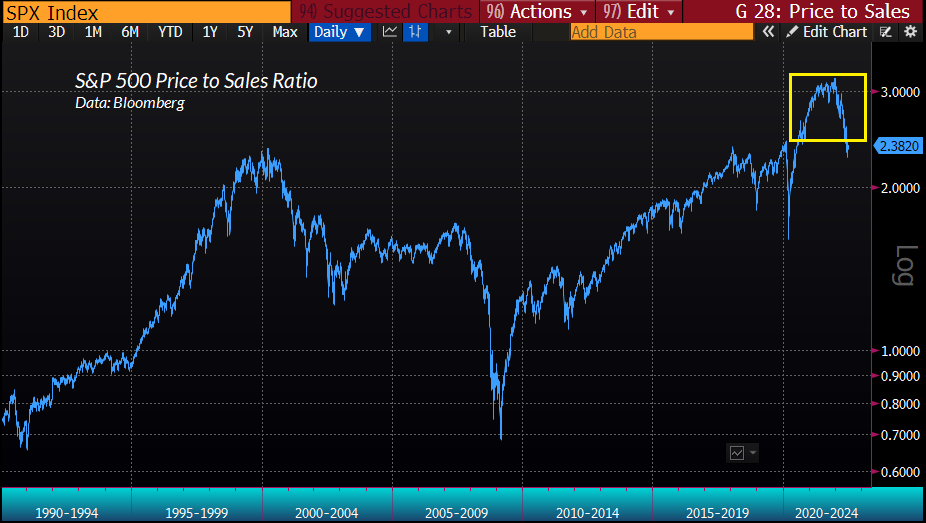
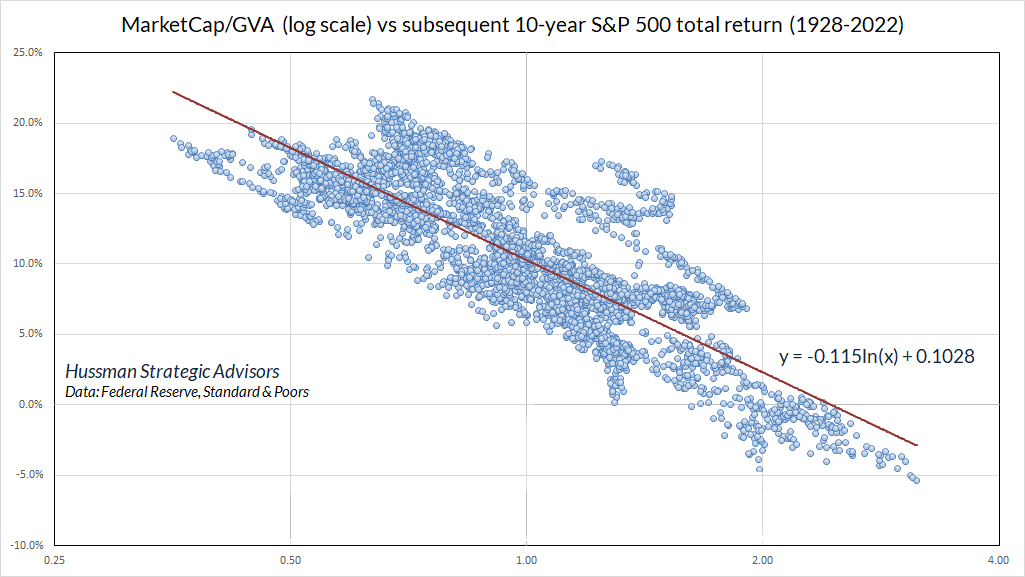
The chart below shows our most reliable valuation measure, based on its correlation with actual subsequent S&P 500 total returns in market cycles across history: the ratio of U.S. nonfinancial market capitalization to gross value-added (MarketCap/GVA). This measure, which I introduced in 2015, basically operates as an economy-wide, apples-to-apples price-to-revenue ratio. At The January 2022 market peak, our most reliable valuations measures exceeded their 1929 and 2000 extremes. While the market decline of recent months has retraced the frothiest portion of the bubble, market valuations remain near those 1929 and 2000 extremes. Indeed, valuations remain at levels that were never observed in history except at those extremes.
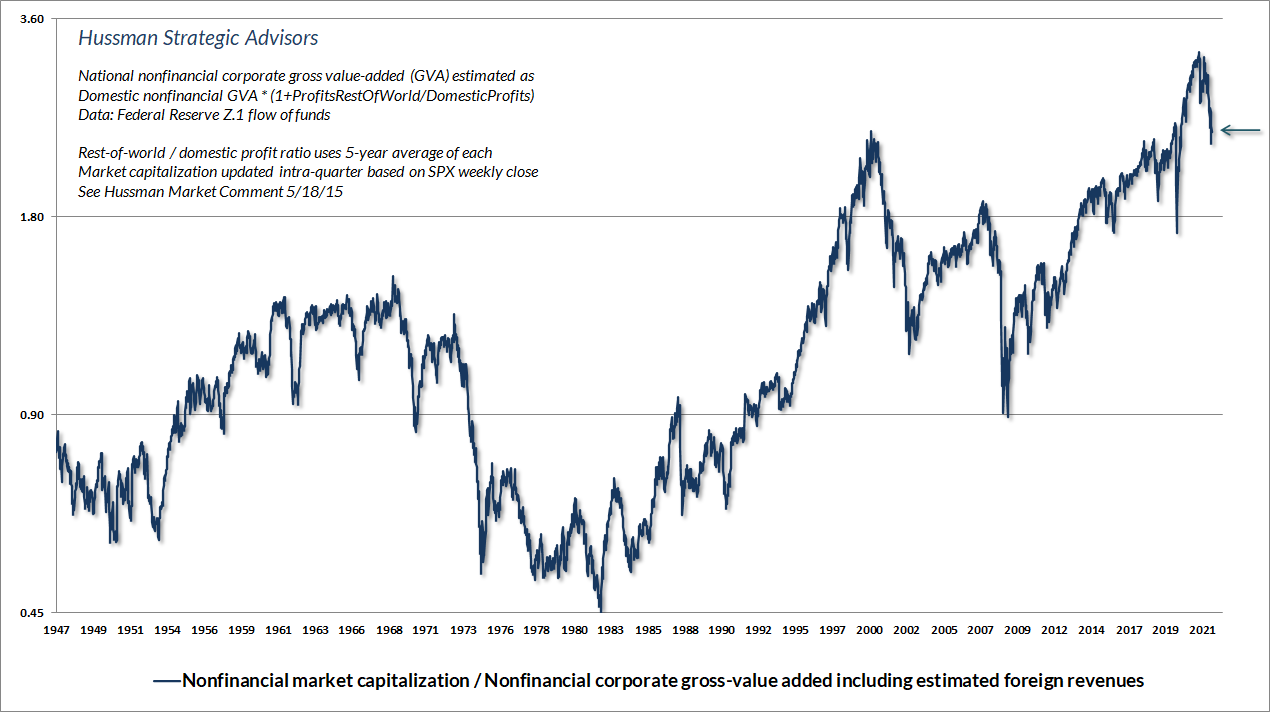
As of June 2022, both MarketCap/GVA and the S&P 500 price/revenue ratio stood at about 2.4, compared with a historical norm of about 1.0. Simply touching that run-of-the-mill valuation norm (without breaching it as the market did in 2009) would require a market loss of nearly 60% from current levels. That’s the “cyclical” risk here, and it’s not a worst-case scenario. Emphatically, shifts in investor psychology, which we infer from the condition of market internals, can defer that risk and even encourage what Benjamin Graham might describe as “rational speculation.” We’ll respond to those shifts as they emerge. Presently, we view market internals as ragged and divergent, suggesting continued risk-aversion among investors.
Longer-term, recall that over the past 10, 20, and 30 years, both U.S. nonfinancial gross value-added and S&P 500 revenues have grown at an average rate of about 4% annually. Assuming continued growth at that annual rate, it follows from arithmetic that if valuations were simply to touch their historical norms even 20 years from today, the expected annual gain in stock prices over that period would be:
(1.04)*(1.0/2.4)^(1/20)-1 = -0.5% annually.
On a total return basis, dividends would be expected to add a couple of percent annually to this return.
I do consider a continued 4% nominal growth estimate to be reasonable. Our estimate of “structural” real U.S. GDP growth (growth driven by demographic labor force growth and trend productivity, excluding the effect of changes in the unemployment rate) has dropped in recent decades to just 1.5% annually. A 4% nominal growth rate implies average inflation of about 2.5% annually above that. One can certainly assume a higher inflation rate. The difficulty is that if one examines periods in U.S. history when 10-year CPI inflation averaged even 4% annually, S&P 500 valuations at the end of those 10-year periods were always at or below historical norms – on average more than 30% below those norms.
Measured from the recent market peak, the S&P 500 is likely to experience a very long, interesting trip to nowhere for somewhere between 10-20 years. It’s true that a sharp market loss could certainly create investable conditions even in the coming year or two. Unfortunately, the investment return during the transition from an extreme level of market valuation to a normal level of valuation is almost invariably dismal, even if one puts a decade or more of time between those two points.
The cash flows generated by the economy are nowhere near enough to service bloated market capitalizations in a way that provides adequate long-term investment returns.
That’s the problem with zero interest rates. They encouraged investors to believe that they had no alternative but to chase risk, and to abandon price as an investment consideration. The resulting runup in prices and valuations front-loaded more than a decade of what would have otherwise been future returns. For more on the arithmetic that links valuations and subsequent market returns, see Making Friends with Bears Through Math.
What does “normal” mean?
Because the long-term total return of the S&P 500 has averaged about 10% annually, the historical “norms” that we define for valuations are also levels that we associate with subsequent long-term returns of about 10%. This fact seems to be a persistent source of confusion for investors. To say that market valuations are above their historical norms is not necessarily to say that expected returns are negative. Rather, it means that long-term market returns will most likely fall short of their historical norms. It’s the distance from those norms that defines how much returns are likely to fall short. That distance also typically defines potential downside risk over the complete market cycle.
Emphatically, the level of interest rates may affect the level of valuations that investors will pay, and the long-term returns they will accept, but it doesn’t change the arithmetic that links valuations and subsequent returns.
If a security delivers a $100 cash flow a decade from today, and you’re willing to pay $38.55 for it today, you’ve bargained for a 10% annual return. If you’re willing to pay $82 for it today, you’ve bargained for a 2% annual return. For any given set of future cash flows, knowing the current price is identical to knowing the expected return. You can compare that expected return to interest rates, but the level of interest rates doesn’t change the arithmetic. Saying that low interest rates “justify” record-high valuations for stocks is identical to saying that low interest rates on bonds “justify” record-low expected returns for stocks.
The chart below shows how a reliable valuation measure maps to subsequent market returns. For MarketCap/GVA, you’ll notice that a multiple of 1.0 maps to a subsequent S&P 500 total return of about 10% annually over the subsequent decade. Presently, we’re about 2.5 times that level, even after the market decline of recent months. Of course, nothing demands that valuations return to run-of-the-mill historical norms. If investors are comfortable with expected equity returns of 5% annually, a retreat in MarketCap/GVA to about 1.6 (roughly 2400 on the S&P 500) would be consistent with that. Higher valuations imply lower expected returns. Investors know that. They just don’t want to believe it.
The green line in the chart below shows what we estimate as the valuation “norm” that would be associated with run-of-the-mill expected long-term S&P 500 total returns of about 10% annually. One might object that with the exception of the 2008-2009 lows, the S&P 500 has been above that norm since 1996. It’s worth noting that even with the benefit of the recent bubble, the total return of the S&P 500 since then has averaged 8.73% annually. Similarly, from June 30, 1990 through June 30, 2022 the total return of the S&P 500 has averaged 9.87% annually.
Indeed, after lagging Treasury bills for 13 years measured from the 2000 market peak, the S&P 500 has required a speculative bubble matching the peak valuations of 2000 in order to claw out a 6.16% annual total return since March 2000. I expect that much of that return will be erased over the completion of this market cycle. That’s what it means to be this far above the green line. The higher the market is above its valuation norms, the worse the likely subsequent market returns.
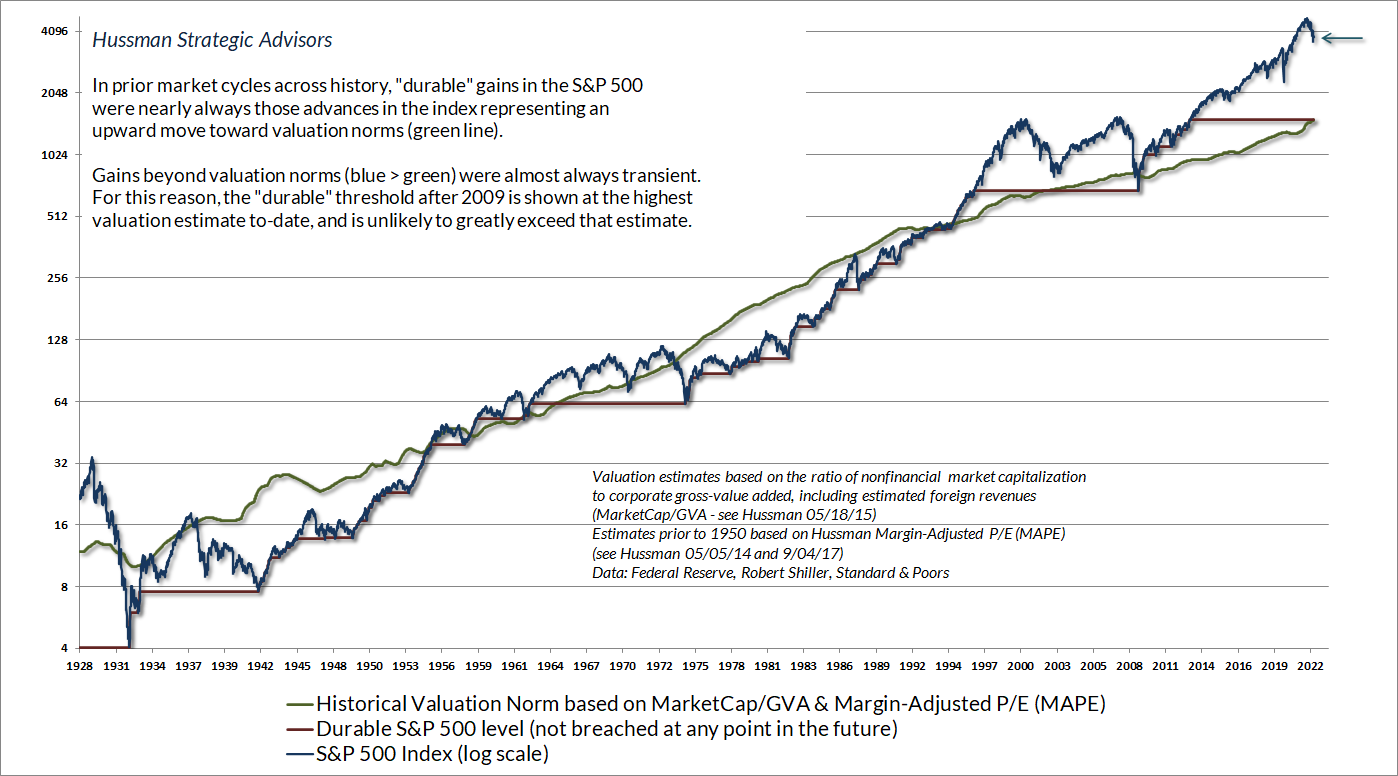
While the market can certainly remain above its historical valuation norms for long periods of time, the departures ultimately tend to be transient, as we observed partially in 2002 and fully in 2009. In contrast, market advances tend to be durable when they begin from undervalued levels and move upward toward valuation norms. The red “stairstep” shows levels of the S&P 500 that were not breached at any point in the future. We don’t actually know what that “durable” level is at present, but because market advances far beyond historical valuation norms tend to be transient, the red line is set at the highest valuation estimate to-date.
Price/Earnings ratios – Are we “there” yet?
What about the S&P 500 price/earnings ratio? Hasn’t the “forward P/E” declined to attractive levels?
Here’s the problem. Stocks are not simply claims to this year’s earnings, or next year’s expected earnings. Rather, stocks are claims to decades and decades of future cash flows. As I’ve regularly detailed over the years (see, for example, Top Dollar on Top Dollar), a reliable valuation ratio is nothing but shorthand for a proper discounted cash flow analysis. The denominator of that valuation ratio had better be representative and proportional to the long-term stream of deliverable cash that investors can expect over time.
The most reliable market valuation measures (based on their correlation with actual subsequent market returns) look more like price-to-revenue ratios than price-to-earnings multiples. That’s because profit margins have a strong cyclical component driven mainly by real unit labor costs, while longer-term competitive forces tend to normalize after-tax margins even though tax rates themselves have varied enormously. The worst thing investors can do – and they do it regularly at market tops – is to pay elevated P/E multiples on record earnings that benefit from elevated profit margins.
What do real unit labor costs have to do with profit margins? Well, suppose a company sells its output at a price $P per unit, and pays $ULC in labor costs to produce that unit of output. Clearly, if $ULC rises relative to $P, the profit margin will shrink. Because the majority of nonfinancial corporate expenses are labor costs (the current ratio is close to its 25-year average), the ratio of unit labor costs to the GDP deflator closely tracks nonfinancial profit margins over time. The chart below shows just how misaligned profit margins have become relative to real unit labor costs in recent years, as they temporarily were before the global financial crisis.
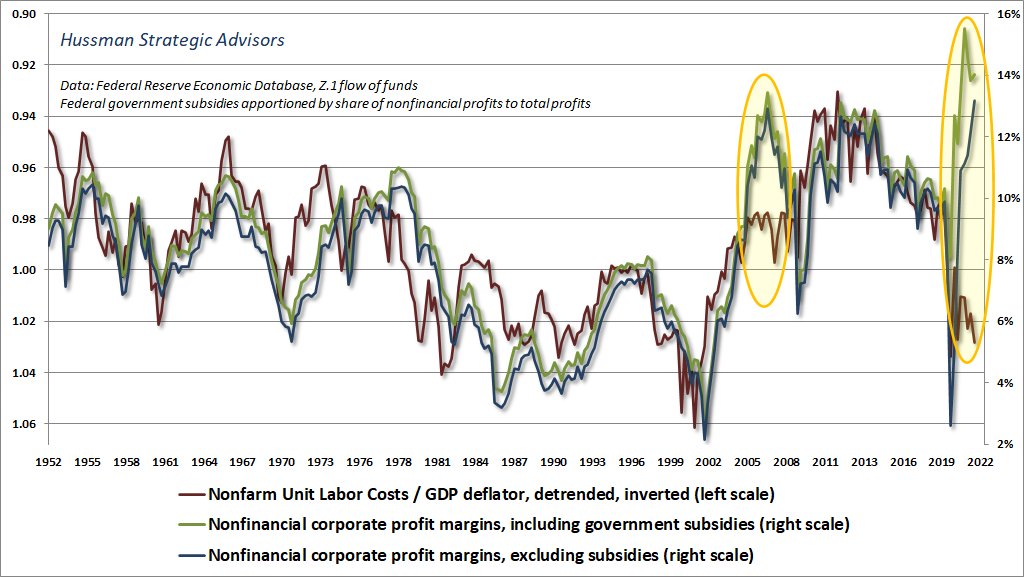
When you hear analysts gushing that the “forward P/E ratio” of the S&P 500 has declined to presumably attractive levels, keep in mind that the current forward P/E reflects the highest earnings estimates and profit margins in the history of the U.S. equity market. Even ignoring every prior market cycle, current profit margins are 30-40% above the median observed during the bull market since 2009. This shoe hasn’t dropped.
There are three principal phases of a bull market: the first is represented by reviving confidence in the future of business; the second is the response of stock prices to the known improvement in corporate earnings, and the third is the period when speculation is rampant – a period when stocks are advanced on hopes and expectations. There are three principal phases of a bear market: the first represents the abandonment of the hopes upon which stocks were purchased at inflated prices; the second reflects selling due to decreased business and earnings, and the third is caused by distress selling of sound securities, regardless of their value, by those who must find a cash market for at least a portion of their assets.”
– Robert Rhea, The Dow Theory, 1932
We haven’t even entered phase two.
Investor sentiment – Are we “there” yet?
Amid the market losses of recent months, one of the most popular charts circulating around is based on the American Association of Individual Investors (AAII) investor sentiment survey. It’s clear from this survey that respondents have adopted a generally “bearish” outlook on the market. Because sentiment typically behaves as a “contrary” indicator, heavy bearish sentiment is typically viewed as a positive sign.
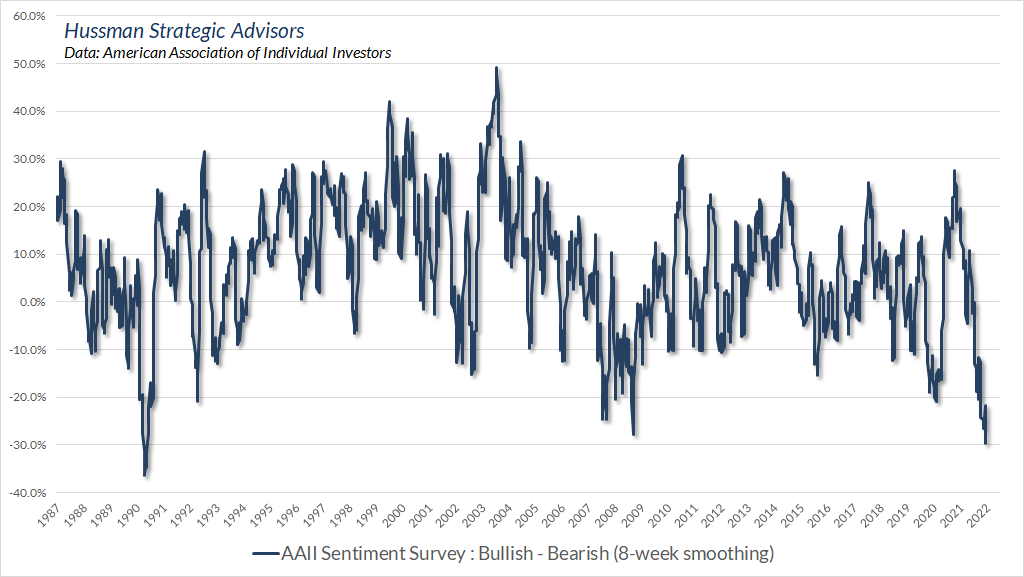
In my view, it’s reasonable to take the AAII survey as one of many investment considerations. It tends to be quite noisy, and has a rather weak correlation (about 0.2 or less) with subsequent short-and intermediate-term market returns. The Investors Intelligence survey is more reliable, and also leans bearish here, but less extremely so. Overall, it’s fair to say that investor sentiment has become generally bearish here. Still, it would be dangerous to assume that bearish sentiment creates a “limit” to further market losses.
Another difficulty with drawing too much signal from investor sentiment is that the bearishness has very little confirmation from other measures that are better correlated with subsequent market returns. Indeed, when one examines the extremes in market valuations and the equity allocation of investors, it appears that very little of the bearishness expressed by investors has found its way into actual investment behavior. AAII respondents currently report that nearly 65% of their assets are allocated in equities. The blue line in the chart below shows the AAII equity allocation. This percentage dropped to less than 45% at the 1990, 2002, and 2009 bear market lows.
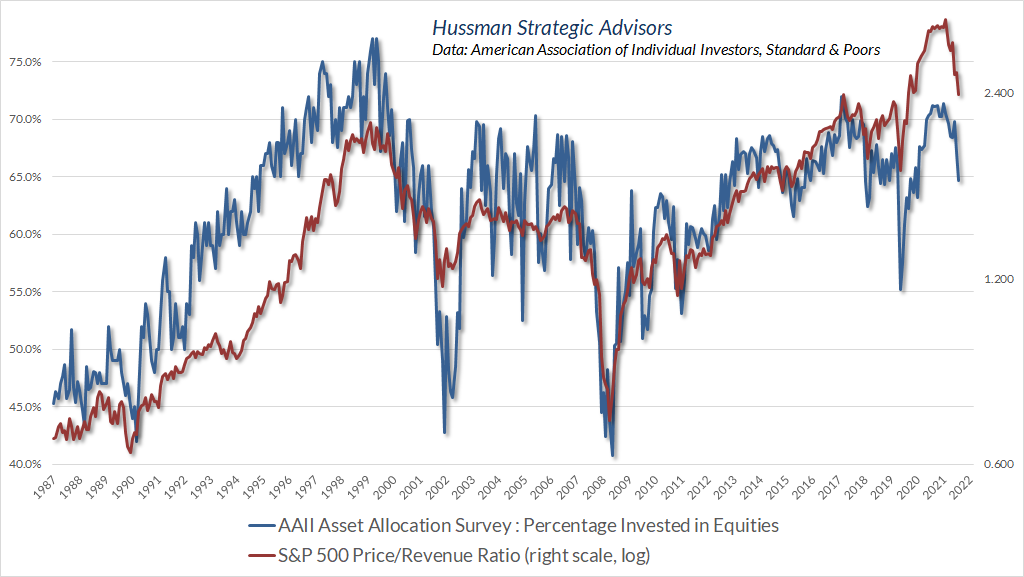
The red line in the chart shows the S&P 500 price/revenue ratio. One thing that should be evident here is that part of the decline in equity allocations has historically been driven by a decline in market valuations, not simply by “selling.” Indeed, in order for AAII respondents to lower their equity allocations by selling, some other group of investors has to absorb those shares by buying. There’s no “getting out” in aggregate.
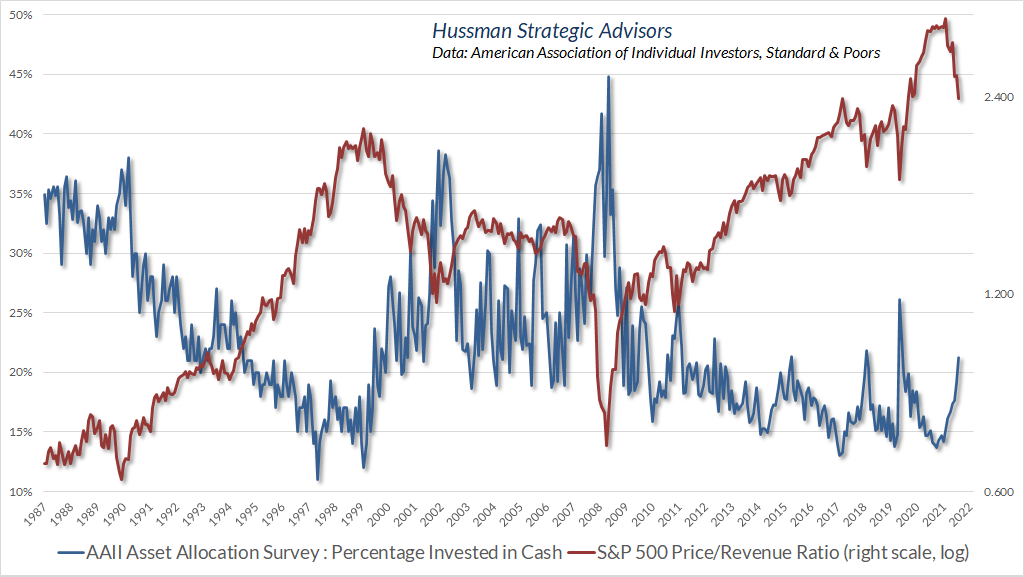
Still, as a specific class of investors, it’s fair to say that by the end of a cyclical market decline, AAII respondents tend to have much larger allocation to cash than they do at present.
The upshot here is this: market valuations remain near the highest level in history, matched only by the 1929 and 2000 extremes. Meanwhile, market internals continue to convey risk-aversion among investors. Bearish sentiment appears to be dominant among investors, but there is little evidence that investors have actually acted on that sentiment, suggesting that they are operating on hope that “it always comes back.”
Financial bubbles tend to decline sharply in the weeks following the peak, but they rarely crash directly. Rather, they tend to spend time consolidating, with an alternating sequence of fresh losses followed by “fast, furious, prone-to-failure” rebounds. Each explosive rebound feeds hope that the worst is over. It’s fascinating how a few advancing sessions can encourage analysts to make “bottom calls” near record valuations. Then, after churning around the initial lows, the market breaks to one fresh low too many, and investors attempt to sell in concert. The question then becomes “to whom?”
The main signal we draw from present conditions is that investors must be extremely uncomfortable. Indeed, the only other time AAII equity allocations were as high (>64%) with sentiment so negative (bull-bear spread<-20%) was in January 2008. The risk is that investors will act, and act in concert, to reduce their exposure to equities, resulting in a free-fall.
That’s not a forecast, but it certainly could be, because steep valuations and ragged internals continue to create what I describe as a “trap door” situation. For our part, we’ll respond to observable, measurable valuations, market internals, and other conditions as they change over time.
Peak inflation – Are we “there yet?
In my view, the recent inflationary episode can be reasonably described as being the combination of four factors. First, the government ran enormous deficits during the pandemic, and those deficits fueled a great deal of demand for goods and services. Second, there have been significant labor and supply disruptions in recent quarters, associated first with the pandemic and more recently with the war in Ukraine. Third, total U.S. public debt has soared in recent years to over 120% of GDP, while the Federal Reserve has clearly violated its section 2A mandate to “maintain long run growth of the monetary and credit aggregates commensurate with the economy’s long run potential to increase production.” Fourth, given all of these factors, it’s not surprising that the public has begun to lose confidence in the soundness of government liabilities.
Combine strong demand and constrained supply of goods and services with excessive supply and weakening demand for government liabilities, and you’ve created a situation where goods and services have increased in price, relative to government liabilities. That’s inflation.
Still, that fourth consideration – demand for dollars – is the one most sensitive to public psychology, and may be the quickest to affect the trajectory of inflation. See, when investors are risk-averse, they often seek liquidity as a safe haven. The increased demand for “safe” government liabilities tends to dampen inflationary pressures, because cash is seen as a desirable asset rather than an inferior and revolting one. That’s why credit crises are deflationary. The problem is that risk-aversion isn’t good for financial speculation at all, particularly at near-record valuations.
When we evaluate speculation versus risk-aversion among investors, our analysis includes the behavior of “debt securities of varying creditworthiness.” That behavior has been particularly interesting in recent weeks, because Treasury yields have retreated from their highs, even as junk bond yields have continued to surge. As I’ve often observed, when two securities diverge, the dispersion provides information about factors that they do not share in common. In this case, the dispersion suggests that the financial markets are becoming more concerned about credit risk and potential bankruptcies.
The upshot here is that the same risk-aversion that would be “good” for inflation could be quite unfavorable for stocks and low-grade credit. We observed the same thing, of course, during the global financial crisis. That’s a situation in which Fed easing does very little to provoke speculation. Indeed, I remain convinced that it was not Fed easing that ended the crisis, but instead the change in FAS 157 mark-to-market rules in March 2009, which essentially ended the risk of bank defaults by making balance-sheet losses opaque.
Suffice it to say that I don’t have pointed views on inflation. Rather, inflationary pressures are likely to pivot if risk-aversion becomes more pronounced. In my view, that’s probably a reasonable base expectation. Notably, economic weakness – even without amplified inflationary pressures – would likely be quite favorable for precious metals shares. The Philadelphia Gold and Silver Index (XAU) has historically performed best in periods when Treasury bond yields were below, not above, their levels of 6 months earlier, with particularly strong gains when the ISM Purchasing Managers Index was below 50. The correspondence between “inflation” and “rising gold stocks” is more complex that investors may recognize. As always, we’ll respond to the evidence as it emerges.
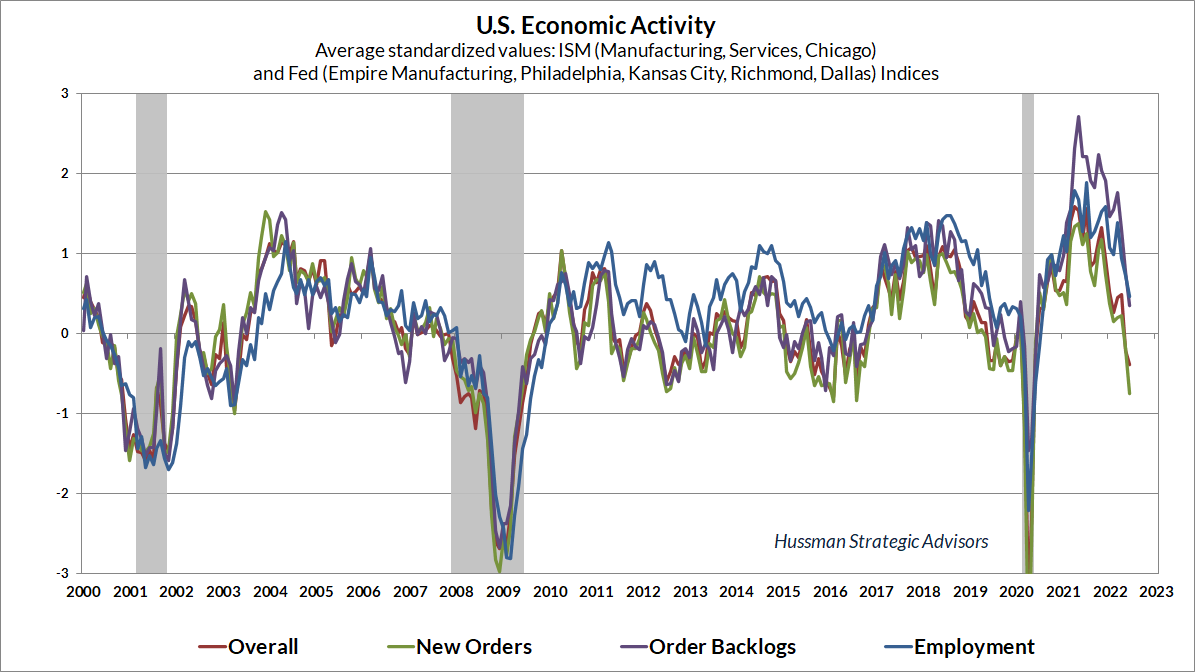
As for recession risk, Fed surveys and purchasing managers’ indices have deteriorated sharply in recent months. Current levels are consistent with recession, but not decisively so. The National Bureau of Economic Research generally defines recessions as periods in which output, income, spending, and employment retreat in a way that combines depth, diffusion, and duration (though clear weakness in one feature can offset more moderate weakness in another). Currently, my view is that employment hasn’t deteriorated to the extent that would be consistent with NBER recession criteria – at least not yet. Given that first quarter GDP growth was -1.6%, and the Atlanta Fed GDPNow model currently projects a -2.1% annualized loss in the second quarter, it’s likely that both quarters would be included in the NBER’s dating of any recession. It’s just that the NBER is unlikely to date a recession without weakness in employment. Headed that direction, but not “there” yet.
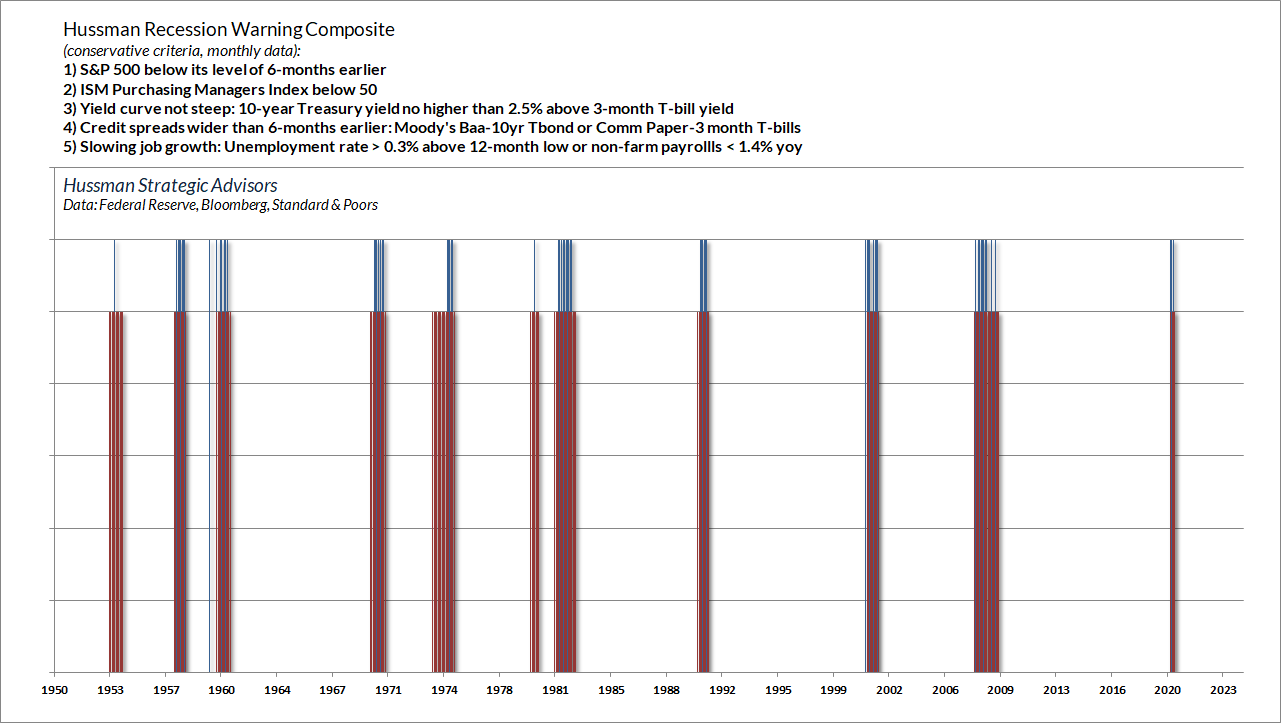
The blue bars in the chart below show our own Recession Warning Composite. The red bars are NBER-defined recessions. We do observe some warning features in place, specifically equity market weakness, rising credit spreads, and flatness in the yield curve. The ISM Purchasing Managers Index hasn’t yet declined below 50, nor have we observed a clear slowing in job growth or an uptick in the unemployment rate. These features aren’t obligatory, but they would certainly strengthen our expectations of a U.S. recession.
Monetary policy – Are we “there” yet?
The Committee currently anticipates reducing the quantity of reserve balances, over time, to a level appreciably below that seen in recent years but larger than before the financial crisis; the level will reflect the banking system’s demand for reserve balances and the Committee’s decisions about how to implement monetary policy most efficiently and effectively in the future. The Committee expects to learn more about the underlying demand for reserves during the process of balance sheet normalization.
– FOMC Policy Normalization Principles and Plans, June 14, 2017
Federal Reserve balance sheet: June 2017: $4.46 Trillion. June 2022: $8.94 Trillion
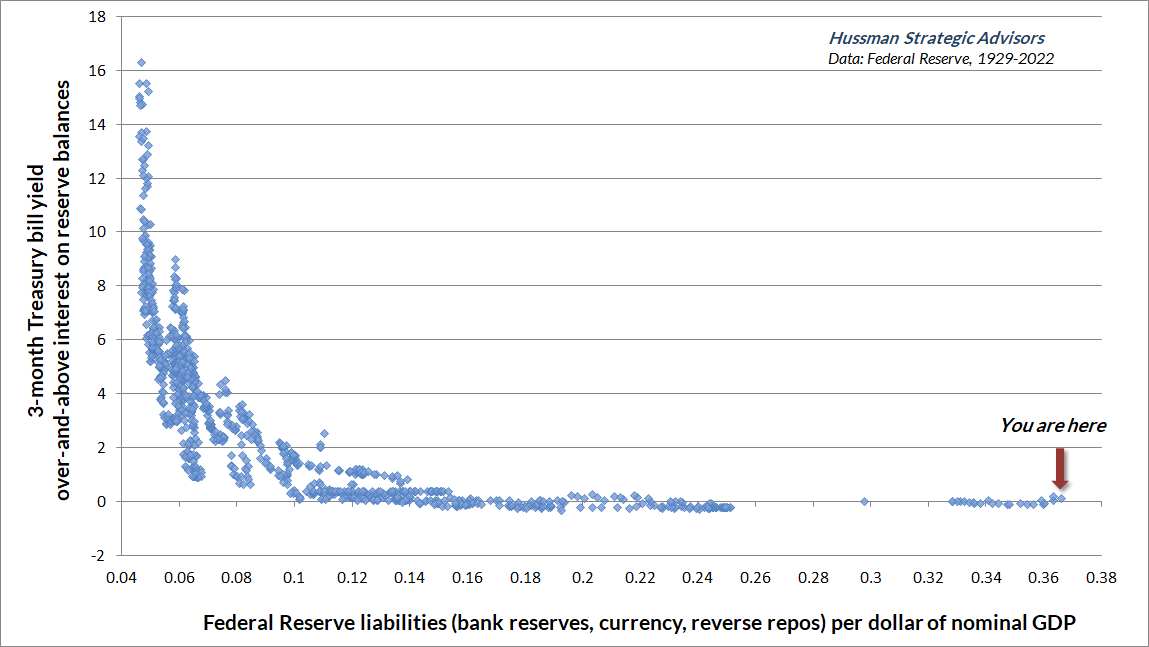
Nearly a century of data in this chart, and the Fed “… expects to learn more about the underlying demand for reserves.” Unbelievable.
The “Lipstick on a Pig” award for bureaucratic wordsmithing goes to whichever Fed member coined the term “ample reserves regime” to describe this atrocity.
This is not what good policy does. A balance sheet of this size is not an economic cushion. It’s a speculative amplifier. It’s an accident waiting to happen.
I’ll preface my comments on Fed policy by emphasizing the adaptations that we’ve made to our own investment discipline in the face of the deranged policy depicted above. While rich valuations can certainly make us more conservative, we’ve abandoned our bearish response to overvalued, overbought, overbullish syndromes when our measures of market internals still indicate that investors have the speculative bit in their teeth. We’ve also increased our capacity to adopt a moderately constructive investment outlook – albeit with position limits and safety nets – in a broader range of conditions, even amid rich valuations. These adaptations have restored the flexibility that allowed our discipline to admirably navigate decades of market cycles prior to QE. Their impact has already been evident during the volatile market advance since 2019. The Fed can do what it wishes. We’ll be just fine.
Still, understand that all QE and zero-interest rate policy has done is to encourage and amplify speculation that we ultimately expect to destabilize the U.S. financial system, as it did during the global financial crisis.
The Federal Reserve has an important role in stabilizing the banking system. If there are people in the economy who need to borrow money, and available bank reserves are so scarce that banks are unwilling or unable to lend them out, then it can be economically useful for the Fed to change the mix of government liabilities held by the public – buying Treasury bonds (which show up as assets on the Fed’s balance sheet) and paying for them with bank reserves (which show up as liabilities on the Fed’s balance sheet). Ideally, the Fed systematically sets the quantity of bank reserves so that short-term interest rates are reasonably well-aligned with observable economic data such as inflation, unemployment, and the GDP output gap.
That is what good economic policy does. It eases constraints that are binding, in a way that benefits the real economy, without generating undue distortions, and without encouraging reckless activity.
Unfortunately, the Fed has egregiously overstepped this role. The chart below shows the size of the Federal Reserve’s balance sheet in excess of the amount that is actually required to achieve its interest rate target. This is not good economic policy. In order to achieve its interest rate target, the Federal Reserve actually has to pay banks and other financial institutions interest on this excess.
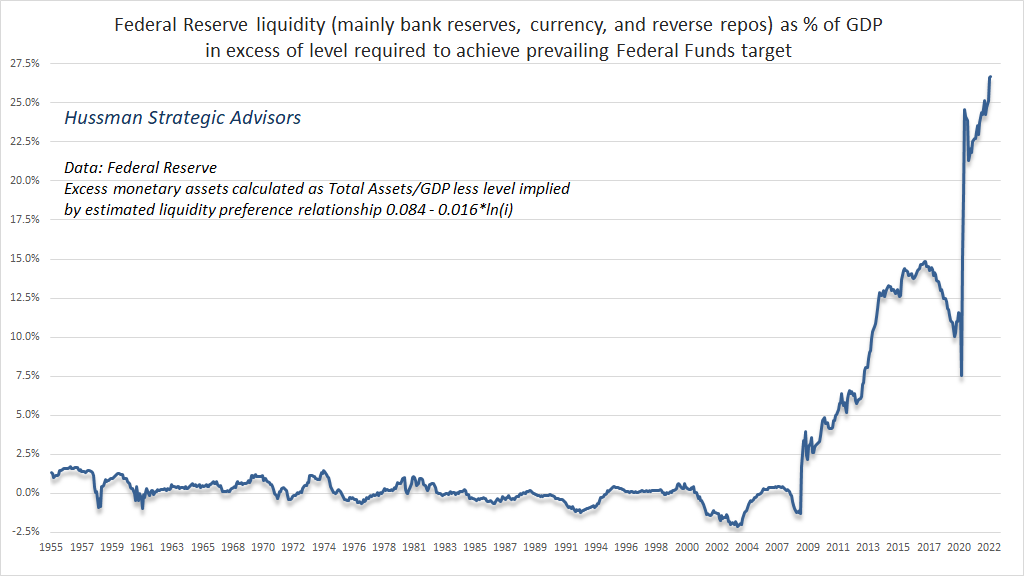
Someone in the economy has to hold every dollar of this excess base money, in the form of excess base money, until the excess base money is retired by the Fed. This is not what good economic policy does.
The chart below shows the volume of “reverse repurchases” the Fed currently has on its balance sheet. Every day, over $2 trillion in cash balances are conveyed to the Fed by banks, government-sponsored enterprises, and money market funds, in return for overnight “interest.” This operation essentially creates “synthetic” money-market assets for these entities, because the Fed insists on holding the actual money market assets (Treasury securities) on its own balance sheet, for reasons that seem unclear even to the FOMC.
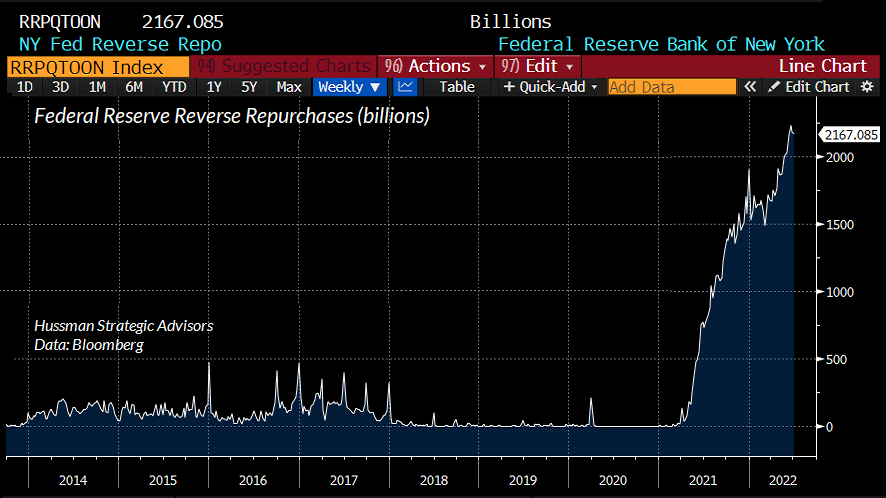
Honestly FOMC, what are you doing here? This is not what good economic policy does.
Frankly, my view is that the outrageous size of the Federal Reserve balance sheet poses a vastly greater risk of economic and financial destabilization than the specific level of interest rates that the Fed chooses – provided that its rate target is at least in a general ballpark of neutral. Though rules-based guidelines suggest substantially higher rates, even a Fed Funds rate of 2-3% would be acceptable from my perspective. The balance sheet, on the other hand, is breathtakingly deranged – not only in the sense of being outside of any historically sensible range, but also in the sense of being reckless, arrogant, dogmatic, and almost childishly naïve to its potentially damaging consequences. Yield-seeking speculation, and Wall Street’s creation of “product” to meet the demand, is precisely how we got the global financial crisis.
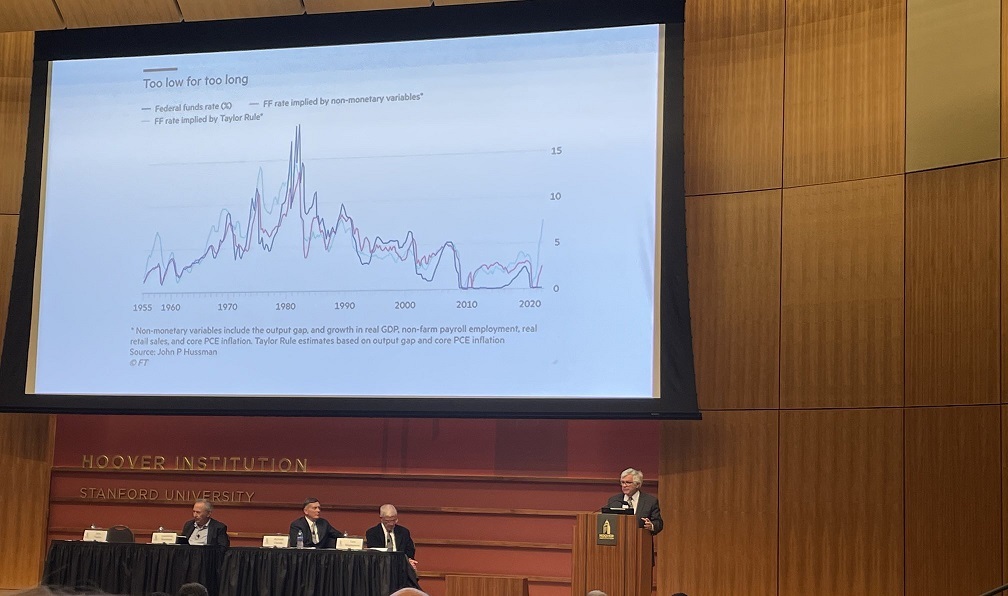
So this was nice – my former Stanford mentor (and dissertation committee member) John Taylor, with a chart I published in the Financial Times, discussing systematic monetary policy during a monetary policy conference at the Hoover Institution.
Remember that every dollar of zero-interest reserves created by the Fed must be held by someone at every moment in time until those reserves are retired by the Fed. If you take your bank deposit and buy stocks, someone else sells the stock and gets the bank deposit. There’s no way out until the Fed reduces its balance sheet and retires the base money. That’s how the Fed encourages speculation – by forcing investors to choke on so much zero-interest base money that they chase risky assets to valuations that imply zero returns or worse.
As I observed in January, in a Financial Times Op-Ed titled The Fed policy error that should worry investors, “By relentlessly depriving investors of risk-free return, the Fed has spawned an all-asset speculative bubble that may now leave investors with little but return-free risk.”
Yes, the Fed is currently restraining the speculative impact of its balance sheet, by paying interest on the excess liquidity it has created (through interest on reserve balances and reverse repo operations). But ultimately, keeping a balance sheet of this size is like keeping a 10 kiloton bomb in the basement. Nothing good can come from it.
The recent bubble has led investors to imagine that extreme valuations represent “wealth creation.” But securities are just claims to future cash flows. The wealth isn’t in the market cap. It’s in the cash flows. Think about it. When market capitalization becomes wildly elevated relative to the cash flows available to service it, the result is an extended period of poor returns.
My impression is that a great deal of financial market capitalization will simply evaporate in the coming years. Despite recent market losses, valuations are nowhere near run-of-the-mill historical norms. The cash flows generated by the economy are nowhere near enough to service bloated market capitalizations in a way that provides adequate long-term investment returns. When the collapse comes (and I suspect it will), don’t blame Fed tightening for bursting the bubble. Once “bubble” is in hand, “burst” is inevitable. Blame the decade of reckless monetary policy that encouraged the bubble in the first place.
The fact is that every financial security is an asset to the holder and a liability to the issuer. When you net out all the assets and liabilities in the economy, the only thing left – the true basis of a society’s net worth – is the stock of productive investment, education, and resources it has accumulated to provide for its people. The thing that creates new wealth is productive economic activity that generates value-added output that didn’t exist before.
The wealth is in productive activity. The wealth is in deliverable cash flows. Bloated market capitalization does not create wealth. It only provides a temporary window for holders to get a wealth transfer – provided they can sell near the highs to some poor schmuck who wants to hold the bag.
When the collapse comes (and I suspect it will), don’t blame Fed tightening for bursting the bubble. Once “bubble” is in hand, “burst” is inevitable. Blame the decade of reckless monetary policy that encouraged the bubble in the first place.
Still, while valuations suggest a very long trip to nowhere for the S&P 500, that trip will undoubtedly be interesting. While the S&P 500 lagged Treasury bills from April 1995 all the way out to March 2009, that period also included two distinct bubbles and two major collapses. Alternating periods of speculation and risk-aversion will likely provide regular opportunities – to embrace market risk when a material retreat in valuations is joined by uniformly favorable internals, and to stand aside when rich valuations are joined by ragged internals and the “trap door” swings open. We’ll respond to market conditions as they shift.
One can hope that the unwinding of this bubble will teach lessons that might help investors and policy makers to avoid a similar level of speculative recklessness in the future.
Are we “there” yet?
Not by any stretch of the imagination.
Keep Me Informed
Please enter your email address to be notified of new content, including market commentary and special updates.
Thank you for your interest in the Hussman Funds.
100% Spam-free. No list sharing. No solicitations. Opt-out anytime with one click.
By submitting this form, you consent to receive news and commentary, at no cost, from Hussman Strategic Advisors, News & Commentary, Cincinnati OH, 45246. https://www.hussmanfunds.com. You can revoke your consent to receive emails at any time by clicking the unsubscribe link at the bottom of every email. Emails are serviced by Constant Contact.
The foregoing comments represent the general investment analysis and economic views of the Advisor, and are provided solely for the purpose of information, instruction and discourse.
Prospectuses for the Hussman Strategic Growth Fund, the Hussman Strategic Total Return Fund, the Hussman Strategic International Fund, and the Hussman Strategic Allocation Fund, as well as Fund reports and other information, are available by clicking “The Funds” menu button from any page of this website.
Estimates of prospective return and risk for equities, bonds, and other financial markets are forward-looking statements based the analysis and reasonable beliefs of Hussman Strategic Advisors. They are not a guarantee of future performance, and are not indicative of the prospective returns of any of the Hussman Funds. Actual returns may differ substantially from the estimates provided. Estimates of prospective long-term returns for the S&P 500 reflect our standard valuation methodology, focusing on the relationship between current market prices and earnings, dividends and other fundamentals, adjusted for variability over the economic cycle.