
Edge of the Edge

John P. Hussman, Ph.D.
President, Hussman Investment Trust
March 2023
Don’t hassle me about the crumbs, man. I’m on the edge of the edge.
– Christopher Walken, Envy
The simplest thing that can be said about current financial market and banking conditions is this: the unwinding of this Fed-induced, yield-seeking speculative bubble is proceeding as one would expect, and it’s not over by a longshot.
I expect that FDIC-insured, and even most uninsured bank deposits will be fine. I also expect that hedged investments will be fine. In contrast, a great deal of market capitalization that passive investors count as “wealth” will likely evaporate, possibly including steep losses to bank shareholders and unsecured bondholders. Investors and policy-makers have confused speculation and extreme valuations with “wealth creation,” but it never was. A parade of seemingly independent “crises” will emerge as this bubble unwinds, including bank failures, pension strains, and market collapses, but they all have the same origin.
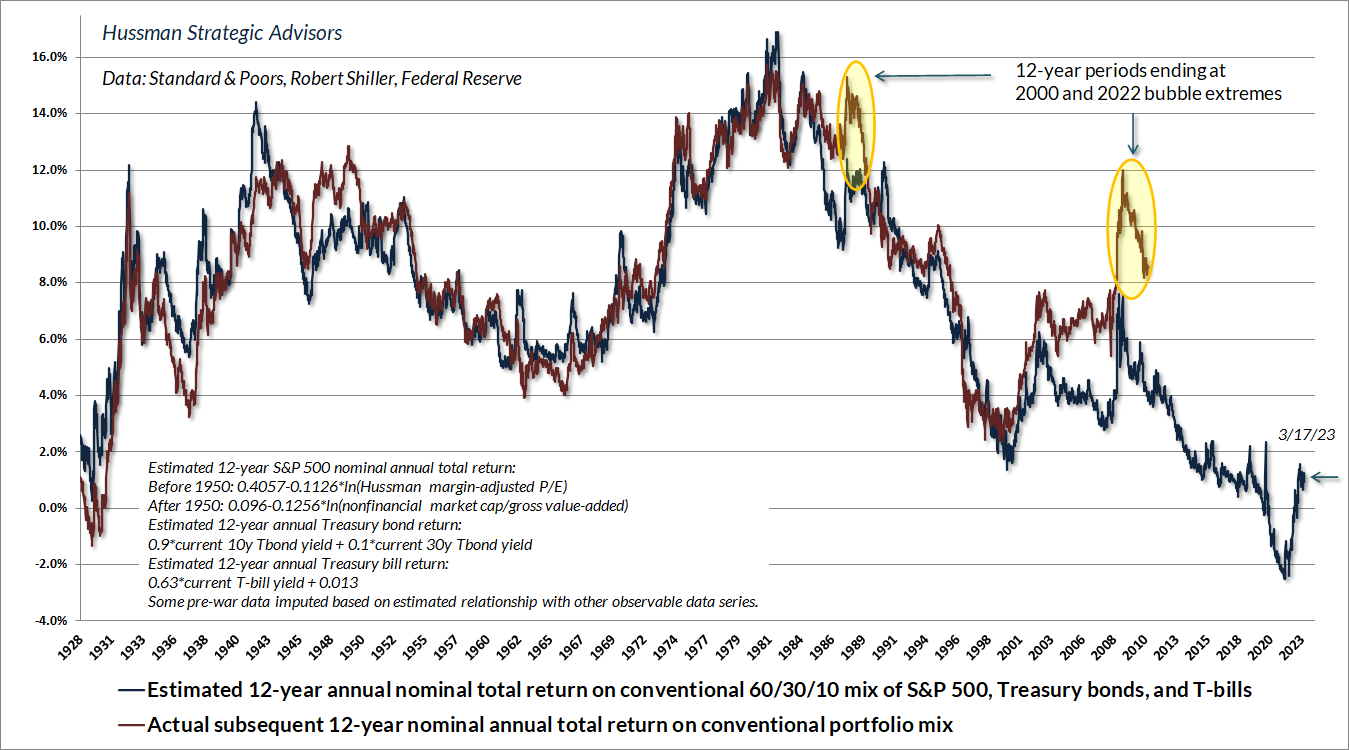
The chart below shows our estimate of likely 12-year total returns for a conventional passive investment mix invested 60% in the S&P 500, 30% in Treasury bonds, and 10% in Treasury bills, along with actual subsequent total returns. At present, this estimate stands at just 1.03%, matching the level of August 1929. By contrast, the average return for this conventional portfolio mix across history is just over 7% annually, which is where current pension return assumptions stand. That’s another way of saying that investors are setting their return assumptions based on average historical returns, ignoring the valuations that actually drive those returns. As explained in more detail at the end of this comment, I continue to expect a loss on the order of -58% in the S&P 500, from current levels, over the completion of this cycle. Nothing in our investment discipline relies on that outcome, but having correctly anticipated the extent of the 2000-2002 and 2007-2009 collapses, it’s best not to rule it out.
Notice that by late-2021, a decade of speculation by yield-starved investors had driven prospective investment returns to negative levels. That’s something that didn’t even occur at the 1929 and 2000 extremes. The sudden crises and financial strains emerging today are just the consequences of the extreme valuations and inadequate risk-premiums engineered by reckless zero-interest rate policies.
Origins of a bank crisis
In recent weeks, Silicon Valley Bank became the second-largest bank failure in U.S. history, second to the 2008 failure of Washington Mutual. Yet the bank appeared to be quite stable even at the beginning of this year. Indeed, in its most recent financial report as of December 31, 2022, deposits represented 82% of Silicon Valley Bank’s liabilities, and over 60% of those deposits were invested in cash or government securities. Silicon Valley Bank’s report noted “continued strong capital, with all capital ratios considered ‘well capitalized’ under banking regulations.”
What went wrong?
The short answer is 1) the bank’s assets suffered large, unrealized losses in recent quarters; 2) in response to the bank’s announcement that it was taking steps to raise more capital, depositors rushed to withdraw their money in a classic bank run; 3) the bank was unable to accommodate the withdrawals, causing the bank to fail due to inadequate liquidity and insolvency.
Still, saying that a house collapsed because a wrecking ball hit it doesn’t explain how the wrecking ball got there in the first place. The answer is that the wrecking ball got there because the Federal Reserve put it there.
As I wrote in a January 2022 Financial Times OpEd, The Fed Policy Error that Should Worry Investors, the central policy error of the Fed occurred well before inflation became problematic. That error was “abandoning a systematic policy framework for more than a decade, in favor of a purely discretionary one. The critical policy error may be the consequences of discretionary policy on the financial markets. By relentlessly depriving investors of risk-free return, the Fed has spawned an all-asset speculative bubble that may now leave investors with little but return-free risk.”
The essential ingredients of recent bank strains involve excess bank deposits, well beyond FDIC insurance limits, coupled with losses in the asset holdings of banks, particularly in securities like long-term Treasury bonds that are ordinarily considered “safe.” Silicon Valley Bank did not have enough liquidity to tolerate a bank run, and it did not have adequate solvency to qualify for emergency loans. But emphatically, the failure did not occur because there is too little liquidity in the banking system as a whole. It occurred because there is too much.
The “excess deposits” are there because the Fed put them there. According to the most recent FDIC quarterly banking profile, the U.S. banking system had $17.9 trillion of deposits as of the third quarter of 2022, with estimated insured deposits of $9.9 trillion, leaving $8 trillion of deposits that exceed the FDIC insurance limit. It is not a coincidence that the U.S. banking system also has nearly $8 trillion of bank deposits in excess of bank loans. They are there because more than a decade of “quantitative easing” took bonds out of the hands of the public and replaced those bonds with zero-interest bank deposits.
Meanwhile, overvalued long-term securities dominate portfolios because yield-starved investors and banks couldn’t tolerate the perpetual zero-interest rate world created by the Fed, and felt forced to reach for yield. All of those holders – investors, banks, pension funds, everybody – reached for yield, driving the equity market to valuations beyond their 1929 and 2000 extremes; driving interest rates to historic lows; driving the risk-premiums on low-grade debt to levels that still provide little margin of safety; encouraging speculative new issues of stock and covenant-lite debt; encouraging Silicon Valley Bank and others to invest their excess deposits in securities that might offer them something more than zero.
Even as banks like SIVB created a “duration mismatch” by using short-term deposits to finance investments in long-term Treasury securities, they escaped the scrutiny of regulators because “risk-based capital ratios” consider Treasury securities as risk-free, with a risk-weighting of zero. As former FDIC Vice-Chair Tom Hoenig observed, “The weakness is the use of risk-weighted capital measures, rather than equity capital measures that take in all assets. Silicon Valley Bank’s 16% risk-weighted capital looked great, but if you include securities with interest rate risk, and losses on them, they only had 5%.”
Investment losses have emerged since early 2022, both because inflation pressures forced the Fed to normalize rates after 13 years of zero-rate financial repression, and because extreme valuations are never sustained indefinitely. Sudden banking strains in the U.S. and Europe, the British pension crisis last year, all of these are just symptoms of an unwinding bubble. The same process is underway in the equity market, and the downside risk remains absurdly high.
That the rate of interest will be lower when commerce languishes and when there is little demand for money, than when the energies of commerce are in full play and there is an active demand for money, is indisputable; but it is equally beyond doubt, that every speculative mania which has run its course of folly and disaster in this country has derived its original impulse from cheap money.”
– The Economist, 1858
The excess deposits are there because the Fed put them there
When people say the Fed is “pumping money into the economy,” what actually happens is that the Fed buys interest-bearing securities like Treasury bonds from the public, and the Fed pays for the bonds by creating electronic entries called “bank reserves” that back a new bank deposit owned by whoever sold the bonds. The Fed takes interest-bearing securities out of public hands, and replaces them with zero-interest bank deposits backed by newly created “base money.” (We’ll get to the recent practice of paying interest on reserves shortly).
On the asset side of the Fed’s balance sheet are securities the Fed has purchased. On the liability side is base money the Fed has created. The Fed “expands its balance sheet” by buying interest-bearing securities from the public and paying for them with newly created base money. The Fed “shrinks its balance sheet” by selling interest-bearing bonds and receiving base money as payment.
Once the Fed creates base money, it has to be held by someone in the economy, in the form of base money, until that base money is retired by the Fed. If you try to put your money “into” a security, the seller of that security takes the money right back out. For more than a decade, all those reserves – and associated bank deposits – earned nothing. Zero. Someone had to hold them, and nobody wanted to.
Conceptually, you can think of your bank deposit as being “backed” either by reserves that your bank holds on deposit with the Fed, or by an IOU that your bank received in return for a loan it made with your money. By pushing trillions of dollars of reserves into the banking system, quantitative easing also pushed trillions of dollars of deposits into the banking system.
The relationship presented in the chart below isn’t perfect because some Fed liabilities are outside of the banking system (currency in circulation, reverse repurchases with money market funds), and banks finance some of their assets with non-deposit liabilities (senior debt, unsecured notes, equity capital), but the point should be obvious: the excess deposits in the banking system are there precisely because the Fed put them there.
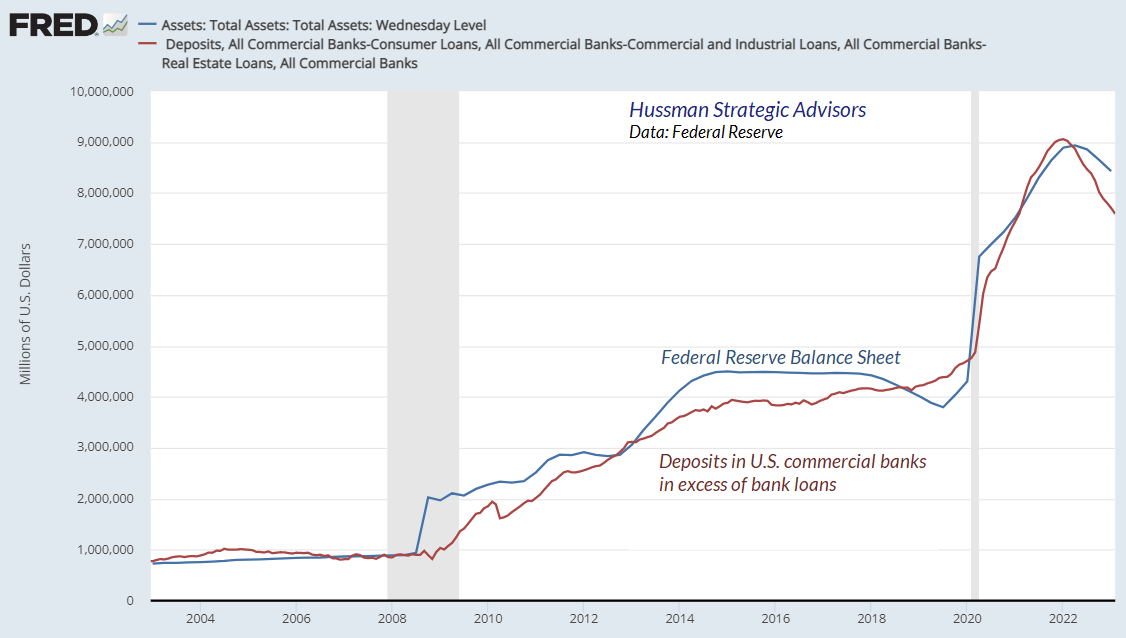
You’ll notice a sharp spike in the Fed balance sheet in 2008 that wasn’t matched by a spike in excess deposits. That spike was driven by lending through the “discount window”: the Fed provided short-term liquidity to banks in return for collateral from the banks. Discount lending is not “quantitative easing” because the Fed doesn’t actually buy the securities. It just provides short-term liquidity, backed by collateral. That’s notable because many observers have misinterpreted a recent spike in the Federal Reserve’s balance sheet as “QE,” when it is actually discount lending under a new – though legally questionable – program called the Bank Term Funding Program (BTFP). More on that below.
Fueling a bubble, setting up a collapse
Historically, the reserves created by the Fed have earned zero interest. As the Fed creates more zero-interest liquidity, investors respond by seeking yield in other securities, starting with T-bills. The more plentiful zero-interest liquidity, the lower short-term interest rates. Prior to 2008, the amount of base money never exceeded 16% of GDP. Once the Fed drowned the public with that much zero-interest money, even a few basis points of interest on T-bills became enough to chase yields back to zero.
Quantitative easing “worked” by flooding the economy with so much zero-interest base money that investors lost their minds, driving even long-term interest rates to record low levels, and driving our most reliable stock market valuation measures beyond even their 1929 and 2000 extremes.
But wait. Now that the Fed has been forced to raise rates to fight inflation, how has the Fed been able to keep its balance sheet at a ridiculous 33% of GDP and yet hold short-term interest rates above zero? Well, the only way the Fed has been able to lift short-term interest rates away from zero in recent years is by explicitly paying interest to banks (currently 4.65% IORB) on their reserve balances.
The chart below is our version of what economists know as the “liquidity preference curve” in data since 1929. When the Fed began to pay interest on reserves, we changed the Y axis from “3-month Treasury bill yield” to “3-month Treasury bill yield over-and-above interest on reserve balances.” Indeed, the current 3-month T-bill yield here is basically the average level of IORB that the Fed is expected to pay over the next 3 months.
The chart below requires no statistics or curve-fitting. Just a dot for every month since 1929. It presents monetary policy in a nutshell.
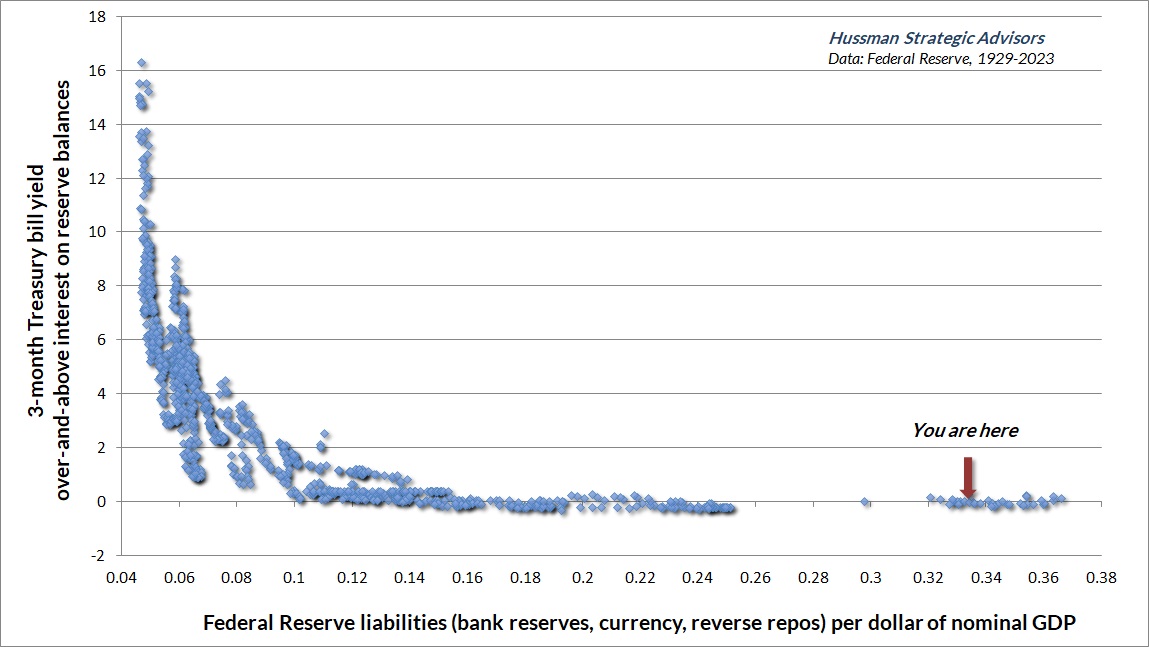
By early-2022, the Fed was forcing the public to choke down a breathtaking 36% of GDP in zero-interest money, passing like stale, re-gifted fruit cakes from one holder to another (how’s that one Dave?), fueling yield-seeking speculation in every security that might offer the hope of something more than “zero.”
Then the prices of those securities fell. One can blame inflation, and imagine that the Federal Reserve’s interest rate hikes “caused” the crisis. But the fact is that crisis has been baked into those stale, re-gifted fruit cakes for years. Avoiding a crisis required speculative valuations and record-low interest rates to be sustained forever.
As I’ve noted during previous bubbles, a market collapse is nothing but risk-aversion meeting an inadequate risk-premium; rising yield pressure meeting an inadequate yield. The extreme valuations encouraged by years of deranged Fed policy are unwinding, and based on the gap between prevailing investment valuations and even modest historical norms, it’s not over by a longshot.
And so on to the moment of mass disillusion and the crash. This last, it will now be sufficiently evident, never comes gently. It is always accompanied by a desperate and largely unsuccessful effort to get out. The least important questions are the ones most emphasized. What triggered the crash?
This is not very important, for it is in the nature of a speculative boom that almost anything can collapse it. Any serious shock to confidence can cause sales by those speculators who have always hoped to get out before the final collapse, but after all possible gains from rising prices have been reaped. Their pessimism will infect those simpler souls who had thought the market might go up forever but who now will change their minds and sell.
– John Kenneth Galbraith
Lessons from the global financial crisis
Excerpted from the section titled “Diary of a deranged ‘ample reserves regime” in the September 2022 comment, Now Comes the Hard Part
Recall how we got a mortgage bubble in the first place. Following the 2000-2002 market collapse, Alan Greenspan cut short-term interest rates to just 1%, driving investors to search for alternatives that might offer a higher return. They found that alternative in mortgage securities, which provided a “pickup” in yield over and above T-bills, as well as perceived safety, given that U.S. housing prices had never collapsed.
With demand for mortgage securities driven by yield-seeking speculation, and supply driven by Wall Street’s eagerness to sell new “product,” the result was an explosion in the volume of mortgage securities. But in order to create a mortgage security, you have to make a mortgage loan. Enter no-doc mortgages, zero-down interest-only payment structures, and a resulting bubble in housing prices. Then came the hard part. The Fed did not save the economy from the global financial crisis. The Fed caused it.
John Bull can stand many things, but he cannot stand interest rates of two percent.
– Walter Bagehot, British Chancellor of the Exchequer, 1852
Indeed, the thing that finally ended the global financial crisis wasn’t Fed heroism, distressed asset purchases, or quantitative easing. It was a change in accounting rule FAS-157 by the Financial Accounting Standards Board in March 2009, which eased “mark to market” standards for banks, eliminating the prospect of widespread bank insolvency by making insolvency opaque. The decade of zero interest rates that followed simply helped banks to recapitalize their balance sheets, funded by paying depositors zero.
The same dynamic that created the mortgage bubble – yield-seeking speculation driven by a pile of zero interest monetary hot-potatoes – is precisely what has now given us the broadest speculative episode in U.S. history. The speculation has been broader and more sustained because the Federal Reserve’s profligacy has been greater.
Pushing the FDIC into a corner
In response to the insolvency of Silicon Valley Bank and Signature Bank, the Federal Deposit Insurance Corporation (FDIC) took them into receivership, wiping out the stockholders and unsecured bondholders. This was, and remains, the correct approach to bank insolvency. The largest bank failure in U.S. history – the 2008 failure of Washington Mutual – is unmemorable because it was also resolved correctly. The FDIC took receivership. Depositors lost nothing. Stockholders and unsecured creditors did lose, because they are supposed to lose in this situation. Nobody was bailed out by a hyperactive Federal Reserve.
Even though recent bank failures were smaller than Washington Mutual, the FDIC invoked a provision that treated these banks as “systemically” important, and covered all of the uninsured deposits as well, even those beyond the $250,000 insured limit (which was increased from $100,000 in 2008). Any losses to the FDIC will be recovered by insurance fees from the banking industry.
While the decision of the FDIC amounts to a bailout of large depositors at large banks – and there’s currently no assurance that uninsured deposits will be similarly protected if smaller banks fail – my own view is that covering all depositors was the right thing to do. The FDIC only needed to do this because the Federal Reserve bloated the banking system with deposits far beyond any amount required for sound lending, and far beyond FDIC insurance limits.
Meanwhile, even as banks receive 4.65% from the Fed on their reserve balances, they continue to take a miserly approach to depositors. As one major bank CEO proudly observed on CNBC, “As rates rise up, our zero-interest deposits, which are a core part of our franchise, and our low-interest checking, obviously become a lot more valuable.”
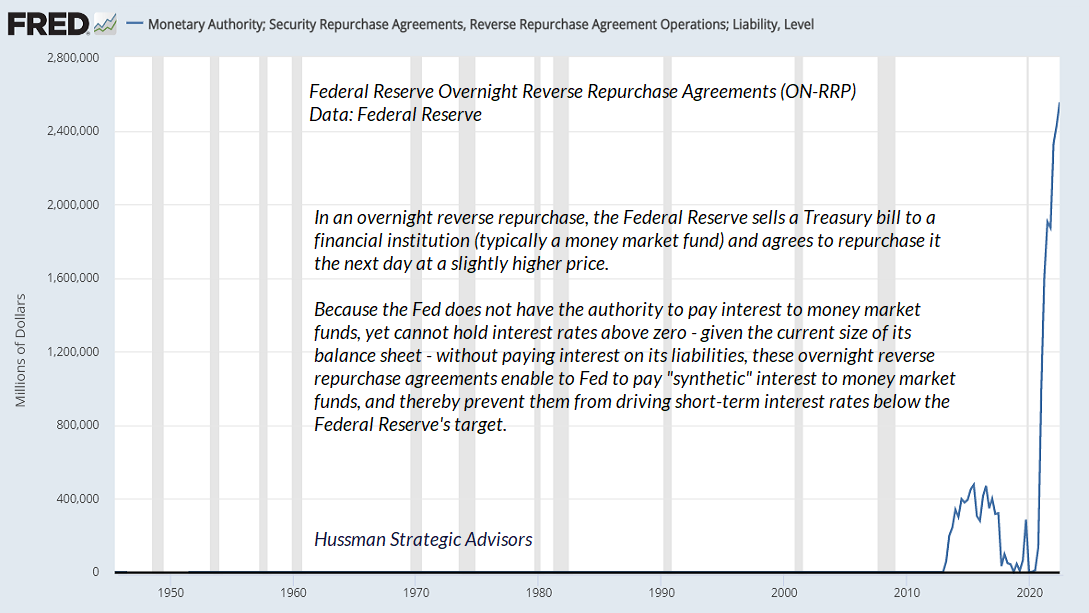
Given that money market funds actually do pass the interest they receive from the Fed to their investors, it should be no surprise that depositors have been fleeing the banking system in preference for money market funds. Since the Fed can’t legally pay interest to money market funds directly, it pays “synthetic” interest to money market funds by selling them Treasury securities overnight, and buying them back the next morning at an ever-so-slightly higher price. These transactions are called “overnight reverse repurchases” or ON-RRP.
All these special programs, acronyms, and facilities are part of the whack-a-mole world of complications created by the Fed’s “ample reserves regime.” The rampage won’t end until the Fed reins in the Bernankenstein Monster it unleashed more than a decade ago.
In my view, until the Fed normalizes its balance sheet, it may be best for the FDIC to insure all deposits, to promptly take receivership of failing banks, and to charge the banking system insurance premiums sufficient to cover any losses. It isn’t the fault of savers that the banking system is stuffed with excess deposits. Savers, in aggregate, are captive victims, like James Caan in Misery, and the Federal Reserve is Kathy Bates.
Given that the Fed has created $8 trillion in liabilities, someone has to hold them either: 1) indirectly as bank deposits, where your bank earns 4.65% interest from the Fed on the reserves that back your deposit, and thanks you for being part of its profitable “zero-interest deposit franchise”; 2) indirectly in a money market fund, where the money market fund receives “interest” on ON-RRP transactions with the Fed, or; 3) directly as currency you just pulled out of the ATM.
That’s it. The Fed created a mountain of liabilities, and someone has to hold them. Whenever someone waxes rhapsodic about all the “cash on the sidelines” waiting to “go into” some other market, they’re basically telling you they haven’t learned how equilibrium works. Every security that’s issued, even base money, must be held by someone until it is retired.
Failure is not failure: impose discipline, protect depositors, and reject Ponzi finance
As for bank failures, remember that when a bank becomes insolvent, the assets don’t vanish, nor do the bank deposits of customers. What actually happens is that the bank goes into receivership (rather than bankruptcy) with a nearly immediate “purchase and assumption” where another bank takes on all of the insolvent bank’s FDIC insured deposit liabilities, along with some of the assets and a cash payment from the FDIC. The insolvent bank’s equity capital gets wiped out, along with some of debt, and the rest of the assets are gradually sold by the FDIC. In general, the insolvent bank’s employees and operations continue under new ownership, and depositors just see a different bank name on their statements.
As I observed during the global financial crisis:
“The only reason that bank ‘failures’ in the Depression (and the ‘failure’ of Lehman) were problematic is that the institutions had to be liquidated in a disorganized, piecemeal fashion, because there was no receivership and resolution authority that could cut away the operating entity and sell it as a ‘whole bank’ entity ex-bondholder and -stockholder liabilities. I put ‘failure’ in quotations because there is a tendency to think of such events as something to be avoided even at the cost of public funds.”
Why did we do the bailouts? It was all about the bondholders. They did not want to impose losses on bondholders. They’re supposed to take losses.
– Sheila Bair, FDIC Chair, 2006-2011
Still, the FDIC is in a messy situation, fully insuring some depositors, yet not able to extend that promise to large depositors at smaller banks. As this “everything bubble” unwinds, it may be impossible to deal with the mess the Fed has created without protecting more depositors than the FDIC would normally cover, and without taking receivership of more banks than Wall Street would prefer.
There’s some concern that banks will simply pass FDIC insurance fees onto their customers. Look, banks are already getting 4.65% IORB on their reserve balances and paying depositors next-to-nothing. Given the size of the problem the Fed has created with its deranged “ample reserves regime,” higher FDIC insurance fees are near the bottom our list of concerns.
Not to be left out of any opportunity to don a flowy cape and nylon tights, the Federal Reserve has responded with its own Bank Term Funding Program (BTFP), offering loans to banks for up to one year, secured by government-backed collateral such as Treasury and mortgage bonds. The terms say “these assets will be valued at par,” presumably even if their market value is well below par.
Those terms are problematic from a legal perspective, because they don’t meet the requirements of Section 10(A) of the Federal Reserve Act – which addresses discount lending to a group of banks that take joint liability; nor 10(B) – which limits advances to 60 days and requires continuous certification of viability, meaning that it is neither currently nor expected to become critically undercapitalized; nor those of Section 13(3), which allows for more general emergency lending to corporations, but only on the basis of collateral, assigned a lendable value that is reviewed every 30 days, “consistent with sound risk management practices and to ensure protection for the taxpayer.” It’s not at all clear where the Fed derives the authority to lend against collateral that it arbitrarily values at par.
Still, one of the lessons of the 2008-2009 global financial crisis is that even after the Treasury and the Fed decided to bail out bank stockholders and bondholders, neither lower interest rates, nor distressed asset purchases, nor quantitative easing were enough to do the trick. Instead, the crisis was ended by suspending FAS157 mark-to-market rules. Suspending mark-to-market was at least easier to justify in that crisis because the distressed assets were illiquid securities like collateralized mortgage obligations (CMOs) and hard-to-value sub-prime obligations. Now the Fed has evidently decided to do the same with highly liquid and readily-valued Treasury debt.
One is reminded that a key feature of Ponzi schemes is that withdrawals by early investors are financed with other people’s money, rather than by sound assets. They work only because the accounting is fraudulent, so nobody realizes that the scheme is insolvent. Since 2008, the Fed has become so comfortable with loose collateral requirements (including treating unsecured junk bonds as their own collateral) that Ponzi finance has apparently become standard operating procedure.
Nobody even blinks that Janet Yellen earned $7.2 million in “speaking fees” from major banks and corporations in the interim between serving as Fed Chair and Treasury Secretary. Come on now. I don’t want to be mean, but have you ever heard Janet Yellen speak?
How, then, should monetary policy react to unusually high prices of houses – or of other markets for that matter? The debate lies in determining when, if ever, policy should be focused on deflating the asset price bubble itself. In my view, it makes sense to organize one’s thinking around three consecutive questions. First, if the bubble were to deflate on its own, would the effect on the economy be exceedingly large? Second, is it unlikely that the Fed could mitigate the consequences? Third, is monetary policy the best tool to deflate a house-price bubble? My answers to these questions in the shortest possible form are, ‘no,’ ‘no,’ and ‘no.’
Janet Yellen, Housing Bubbles and Monetary Policy, October 2005
In fact, the Federal Reserve was helpless only because it wanted to be. Clearly the Federal Reserve was less interested in checking speculation than in detaching itself from responsibility from the speculation that was going on. And it will be observed that some anonymous draftsman achieved a wording that indicated that not the present level but only a further growth in speculation would be viewed with alarm. Never before or since have so many become so wondrously, so effortlessly, and so quickly rich. Perhaps Messrs. Hoover and Mellon, and the Federal Reserve were right in keeping their hands off. Perhaps it was worth being poor for a long time to be so rich for just a little while.
– John Kenneth Galbraith, The Great Crash – 1929
Shrink the Fed
In my view, one of the most constructive things the Fed could do would be to shrink its balance sheet as quickly as possible, by immediately rolling off securities as they mature – every single one. Shrinking the balance sheet may seem like heresy, but only if one doesn’t understand that interest-bearing reserves are functionally different than zero-interest reserves.
See, quantitative easing wasn’t simply about flooding the financial system with reserves. It was about flooding the financial system with zero-interest reserves. When you force the economy to choke down 36% of GDP in zero-interest reserves, and someone has to hold them, it prompts all sorts of ridiculous speculation, which culminated in early 2022. That’s not “stimulus” – it’s bald-faced speculative distortion.
Presently, however, the liabilities that the Fed created are receiving interest, at public expense, in the amount of 4.65% annually. The reserves created by the Fed currently function as “synthetic” interest-earning securities. But they’re also bloating the banking system with deposits, creating pressure on the FDIC, and threatening small banks with withdrawals and possibly even insolvency.
Consider, then, that investors are presently perfectly happy to buy Treasury bonds yielding just 3.4%. Let them. When Treasury bonds mature, the Treasury issues new ones to “re-fund” the debt. If a $100 Treasury bond in the Fed’s balance sheet matures, and the Fed doesn’t buy a $100 bond to replace it, someone in the public will buy the new $100 bond instead. As a result, the public holds $100 fewer bank deposits and $100 more as bonds. The Federal Reserve holds $100 less as bonds, and retires $100 in bank reserves that it previously created. Smaller Fed balance sheet, lower interest cost.
The Federal Reserve’s “ample reserves regime” has not only encouraged the most extreme speculative bubble in history, it has created a host of other distortions that now include bank failures. The faster the Fed can wind down its balance sheet the better. Zero-interest reserves can certainly amplify speculation, but they’re not magic beans. Indeed, since the Fed launched quantitative easing in 2008, commercial bank loans (total commercial, industrial, consumer, and real-estate) have grown at an average annual growth rate of just 3.6% – the slowest rate of any point during the post-war era, and a fraction of the 9.3% pre-QE average.
As I’ve detailed previously, there’s no compelling evidence that the trajectory of GDP or employment in response to activist Federal Reserve interventions has been any different than one could have projected using non-monetary variables alone. If extraordinary monetary policy matters, information about monetary variables should improve our ability to explain subsequent movements in real GDP and employment. If it doesn’t, the forecasts will be largely the same with or without the monetary information. That’s exactly what we observe.
When interest rates are zero, a massive balance sheet drives speculation. Once the reserves created by the Fed pay interest, they become functionally different than zero-interest reserves. They essentially become “synthetic” T-bills. The higher the interest rate, the less they provoke speculation. As interest rates move higher, a massive balance sheet generates also capital losses in bonds and interest costs that the Fed quietly charges to the Treasury by withholding interest that would otherwise be returned for public benefit. Regardless of the level of interest rates, a massive balance sheet causes banking distortions.
Quantitative easing wasn’t simply about flooding the financial system with reserves. It was about flooding the financial system with zero-interest reserves. Presently, the liabilities that the Fed created are receiving interest, at public expense, in the amount of 4.65% annually. The reserves created by the Fed currently function as “synthetic” interest-earning securities. But they’re also bloating the banking system with deposits, creating pressure on the FDIC, and threatening small banks with withdrawals and possibly even insolvency. Consider, then, that investors are presently perfectly happy to buy Treasury bonds yielding just 3.4%. Let them.
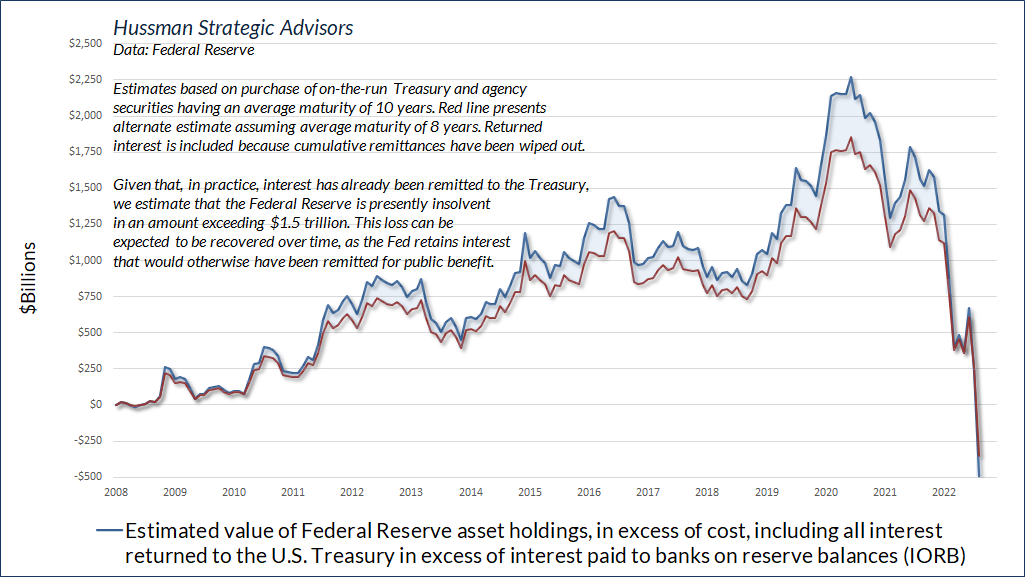
If you think commercial banks are the only ones taking losses because of the Federal Reserve’s recklessness, think again. Given that the Federal Reserve now owns about $8 trillion in debt securities, which have declined sharply over the past year and a half, the Fed itself would be insolvent if it marked its assets to market.
The chart below is generous, because it includes interest payments since 2008 that have, in fact, already been remitted to the Treasury. I’ve included them to emphasize that these remittances have been wiped out by capital losses. When Jay Powell recently testified to Congress that “We always turn over all of our earnings in every year, and we’ve turned over something like $1.2 trillion dollars just in the last decade or so,” what he failed to say is that an amount far greater than those remittances has been wiped out by capital losses. Until the Fed fills the hole created by its own reckless policies, it will retain interest payments that would otherwise be paid over to the Treasury for public benefit.
Hike or Hold?
As for the Federal Reserve’s immediate dilemma – whether to continue to raise interest rates to fight inflation, or put a hold on further rate hikes – a few observations from my December comment, They’ve Ruled Out Tail Risk, may be useful:
“On the subject of interest rates and inflation, I’ll reiterate that the single best predictor of year-ahead inflation is current year-over-year inflation, and the second-best predictor is last year’s inflation rate. While Fed policy, ISM readings, leading indicators, recessions, unemployment, GDP growth, credit spreads, shipping costs, wage inflation, productivity growth, and countless other measures do affect inflation, in some cases meaningfully, they come in second to prevailing inflation, unless they are extreme – for example, a banking crisis. Otherwise, the tools of monetary policy are quite blunt, and the relationships between Fed policy variables and inflation, or unemployment and inflation, are nowhere near what the public, Wall Street analysts, journalists, and even central bankers seem to believe.
“The main way Fed tightening affects inflation in the short-run is through interest-sensitive economic activity like housing, as well as a tendency to accelerate the consequences of reckless speculative behavior encouraged by the Fed (as we saw during the global financial crisis). The other important impact of Fed credibility is to increase public confidence that government liabilities (both bonds and money) will hold their value, and that the Fed will not behave as an arm of government finance. Remember – fiscal policy determines the quantity of government liabilities the public must hold. Monetary policy determines whether the liabilities are held by the public as interest-bearing bonds or as base money.”
Inflation basically measures the tradeoff between government liabilities (dollar bills) and real goods and services. The reason inflation is difficult to predict is that it can reflect any combination of four factors: excessive demand for goods and services, constrained supply of goods and services, inadequate demand (lack of confidence) in government liabilities, or excessive supply of government liabilities. Two of those factors are purely psychological.
What’s striking, though, is how little impact interest rate hikes themselves have in reducing inflation, except in economic environments that involve fear and risk-aversion – recession or banking crises. While rate hikes do tend to weaken housing, durable goods, and capital investment, the impact is typically not enough to reverse an inflationary trend.
Instead, when the Fed needs to respond to inflation, the function of tighter money and systematic policy is to send a signal that the Fed will defend the purchasing power of government liabilities by acting as a brake on their supply. That’s what Paul Volcker did in response to the late-1970’s inflation. He essentially said, look, we’re going to restrict the creation of money, in order to increase your confidence in it. The function of tighter money isn’t to crush the economy with high interest rates, but to restore public confidence that money will hold its purchasing power – by limiting its supply, and in turn, limiting the tendency of Congress to resort to debt finance.
That’s yet another way that quantitative easing did damage to the U.S. economy: the Federal Reserve acted as a wildly accommodative arm of government finance, and in the process, it weakened fiscal discipline on both the revenue and the spending side, resulting in a record ratio of Federal debt to GDP.
As I noted last December, the most deflationary events tend to be banking crises and periods of strong risk-aversion. In this situation, inflation falls not because the supply of money is restricted, but because the public demand for money soars. Indeed, a bank run is nothing but a mass attempt to convert bank deposits into currency. Safe, low interest liquidity becomes a desirable asset rather than an inferior one. Unfortunately, that also means that creating more of the stuff doesn’t provoke speculation. So even aggressive Fed easing does very little to support the financial markets during periods of risk-aversion, as investors should recall from the 2000-2002 and 2007-2009 collapses.
The chart below shows the impact of three different factors on the year-over-year rate of inflation in the core personal consumption expenditure (PCE) price index. Notice that a 1% (100 basis point) year-over-year increase in the Fed Funds rate tends to be followed by a slowing of just -0.15% in PCE inflation, with the full effect typically taking 30-36 months, on average. In contrast, a 1% year-over-year change in the unemployment rate tends to be followed by a somewhat larger decline in year-over-year PCE inflation, reaching about -0.35% on average, with a lag of about 9-12 months. Finally, a 1% widening in Baa credit spreads (basically reflecting concern about corporate default risk) tends to be followed by the strongest reduction in inflation, reaching about -0.4% with an average lag of 16-18 months.
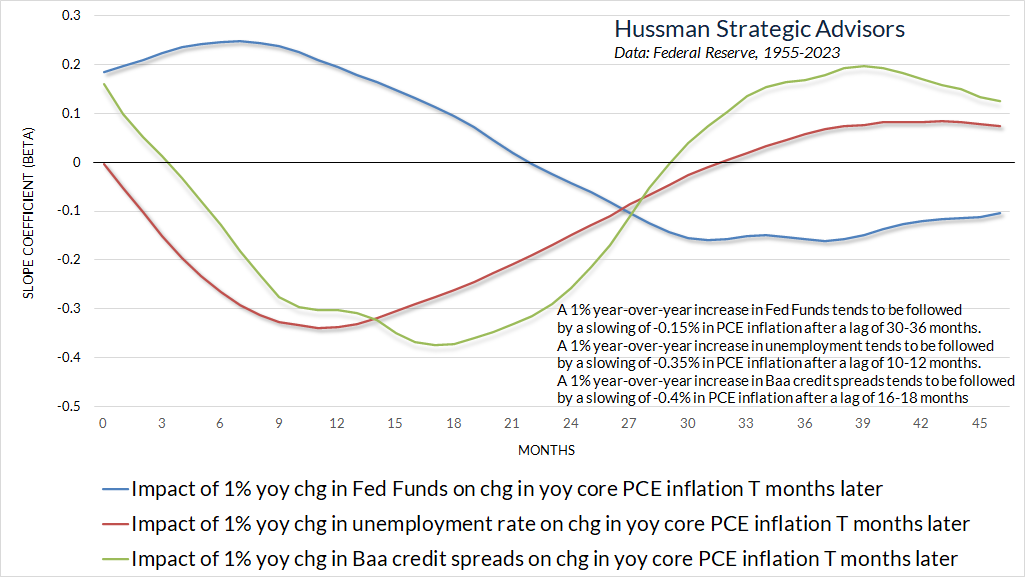
To avoid cluttering the chart above, not shown is that a 1% year-over-year change in the Fed Funds rate tends to be associated with an increase of about 0.2% in the rate of unemployment, with a typical lag on the order of 21-24 months. Those who hyperventilate about a quarter-point hike in the Fed Funds rate as if it would be a grave policy error are vastly overestimating the impact of small changes in the Fed Funds rate on other economic variables.
The main impact of slightly hiking the Fed Funds rate versus holding it steady is in its “signaling” effect. Given that core PCE inflation of 4.7% is well above acceptable levels, while the rate of U.S. unemployment is just 3.6%, pausing the Fed’s response to inflation would essentially convey that the Fed is neither systematic nor serious about price stability, and is likely to flinch and monetize whatever comes its way. That response could easily backfire, sending longer-term yields higher and compounding the unrealized losses of banks on their Treasury holdings.
Yet just as easily, the response could backfire by signaling that the Fed is alarmed enough by recent bank weakness to shrink from its resolve, causing a spike in bank concerns, credit spreads, and financial strains, yet sending longer-term Treasury yields lower.
Those who hyperventilate about a quarter-point hike in the Fed Funds rate as if it would be a grave policy error are vastly overestimating the impact of small changes in the Fed Funds rate on other economic variables. The main impact of slightly hiking the Fed Funds rate versus holding it steady is in its ‘signaling’ effect.
My own inclination would be to hike the Fed Funds rate by a quarter point, coupled with language acknowledging the Fed’s commitment to a stable banking system, and noting that even modest credit strains, as we’ve observed, tend to put downward pressure on inflation, potentially allowing the Fed to achieve its inflation objectives with a lower terminal Fed Funds rate.
As a side note on bond yields, I’ve noted that 10-year Treasury yields have rarely persisted below the weighted average of Treasury bill yields (weight 0.50), year-over-year PCE inflation (0.25), and nominal GDP growth (0.25). Presently, that weighted average is about 5.3%, so the current 10-year Treasury yield of 3.4% embeds quite a bit of confidence that the Fed will achieve its inflation target, whether through recession, credit crisis, or other means.
Longer-term, investors tend to set 10-year Treasury yields roughly in line with trailing 10-year nominal GDP growth. One might like to think that investors “look ahead” based on expectations of future inflation, but given that the best predictor of future inflation is current inflation, that’s a distinction without a difference. The chart below illustrates this regularity. The current point is shown by the slightly enlarged yellow dot.
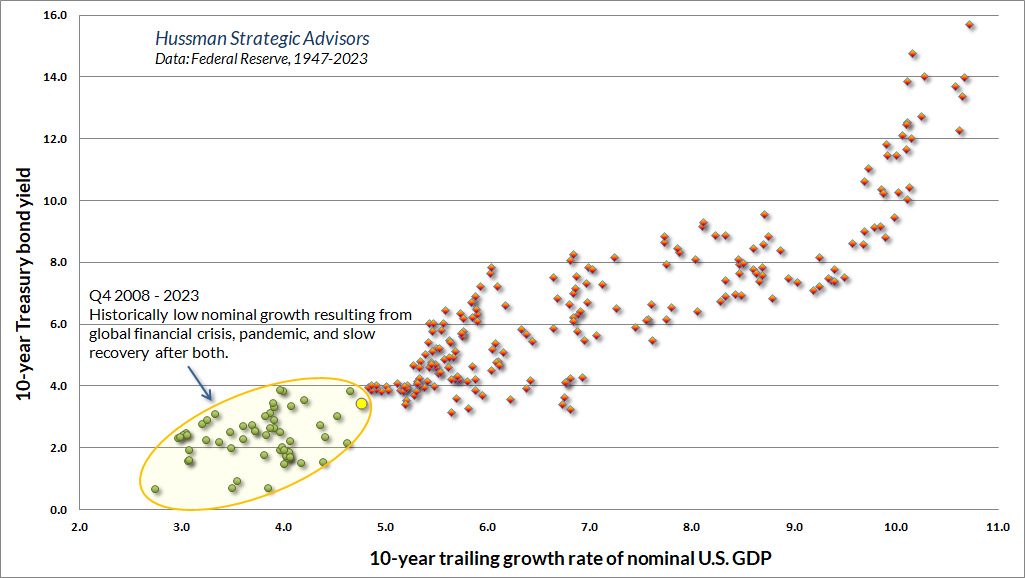
Notice the large oval in the lower left corner. These points span the period from the fourth quarter of 2008 to the present. The associated 10-year periods reflect historically low nominal economic growth resulting from the global financial crisis, pandemic, and slow recoveries following both. My impression is that the present level of long-term Treasury yields reflects “anchoring” by investors to an environment of persistently low inflation and recurrent economic and financial crisis. That may very well be a reasonable expectation, but it’s also an expectation that’s already embedded in prices.
My own inclination would be to hike the Fed Funds rate by a quarter point, coupled with language acknowledging the Fed’s commitment to both stable prices and a stable banking system, and noting that even modest credit strains, as we’ve observed, tend to put downward pressure on inflation, potentially allowing the Fed to achieve its inflation objectives with a lower terminal Fed Funds rate.
Meanwhile, given the possibility that the Fed will either hike and pause, or pause entirely, it’s worth remembering that the bulk of recession-associated bear markets in the stock market occurred after the Fed pivoted away from further rate hikes. A “pivot” typically reflects the Fed’s assessment that something just broke.
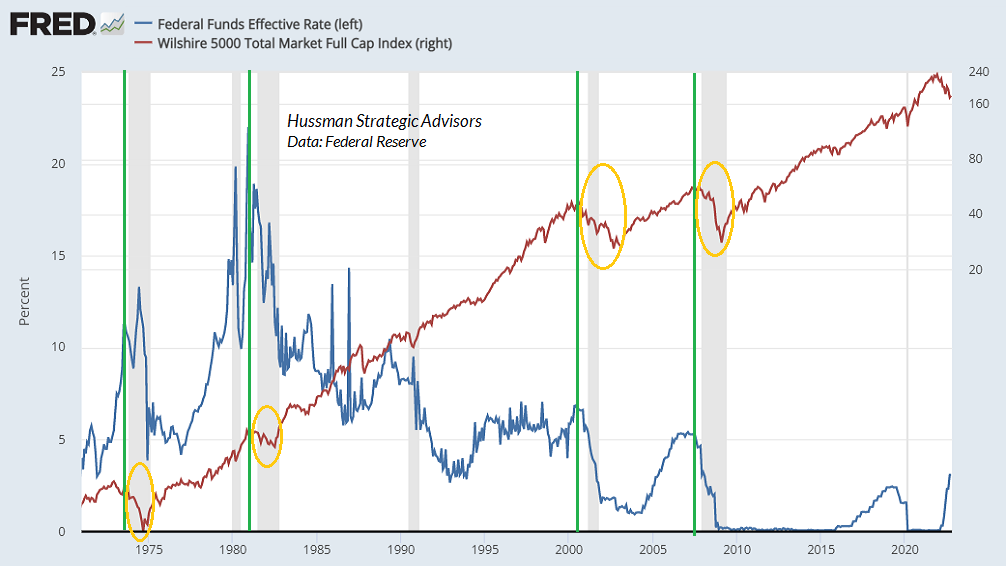
A broad range of measures are already warning of recession, including purchasing managers surveys, leading indicators, regional Fed surveys, and bank lending standards. Still, coincident and lagging measures, particularly labor market measures, remain stronger than we typically observe at the beginning of a recession.
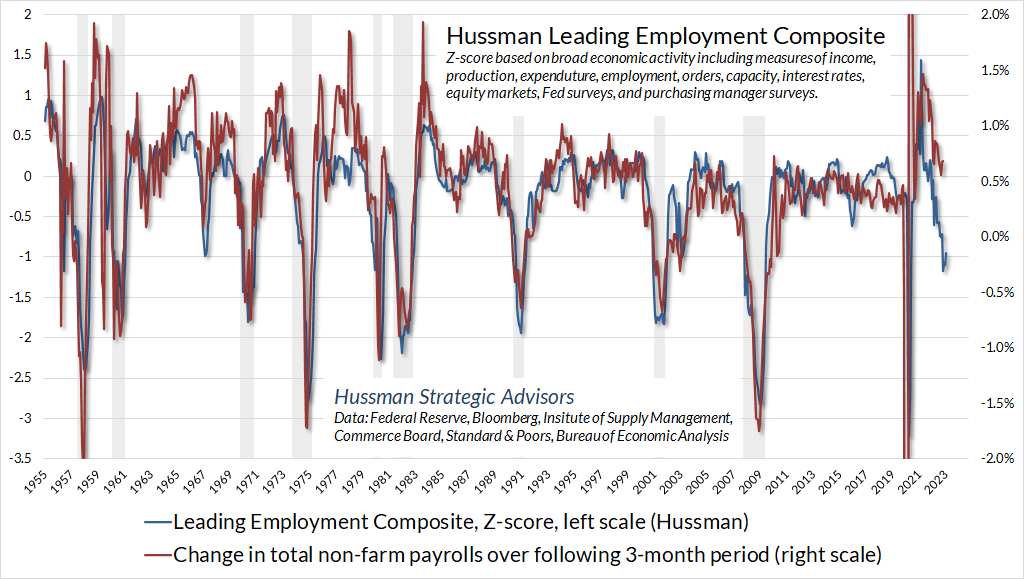
Overall, economic risks lean toward a “hard landing,” and a “trap door” is already open in the equity market, but as always, we’ll respond to observable, measurable evidence as it emerges. For now, even without decisive evidence of recession, we’re tightly bucked down.
It’s a long way down, but no forecasts are required
Faced with a zero-interest rate world that combined ‘fear of missing out’ with a belief that ‘there is no alternative’ to yield-seeking speculation, investors unwittingly drove the most reliable stock market valuation measures to levels beyond the 1929 and 2000 extremes. Unfortunately, those valuations also imply dismal long-term returns in any world not permanently dominated by FOMO and TINA psychology. Measured from the recent bubble peak, the likely consequence will be a long, interesting, 10-20 year trip to nowhere for the S&P 500.
– John P. Hussman, Ph.D., Repricing a Market Priced for Zero, April 2022
With regard to current financial market conditions, several updated charts will help to explain why we continue to estimate the potential for severe downside market risk. The green line in the chart below shows the level of the S&P 500 that we associate with run-of-the-mill expected returns averaging 10% annually. The blue dotted line is the level we associate with a historically run-of-the-mill 5% premium over-and-above Treasury yields, and the orange dotted line shows the level of the S&P 500 that we associate with 10-year expected returns no better than those of 10-year Treasury bonds. The yellow bubbles show periods when our 10-year estimate for S&P 500 total returns was below the prevailing 10-year Treasury bond yield.
We presently estimate that a market loss of -26%, to the 2900 level on the S&P 500, would presently be required simply to restore expected S&P 500 total returns to 3.4%, the present yield of 10-year Treasury bonds. A market loss of -51%, to the 1900 level on the S&P 500, would presently be required to restore a historically normal 5% expected return premium above Treasury bonds (an 8.4% expected nominal total return). Finally, a market loss of -58%, to the 1650 level on the S&P 500, would presently be required to restore historically run-of-the-mill expected returns of 10% annually.
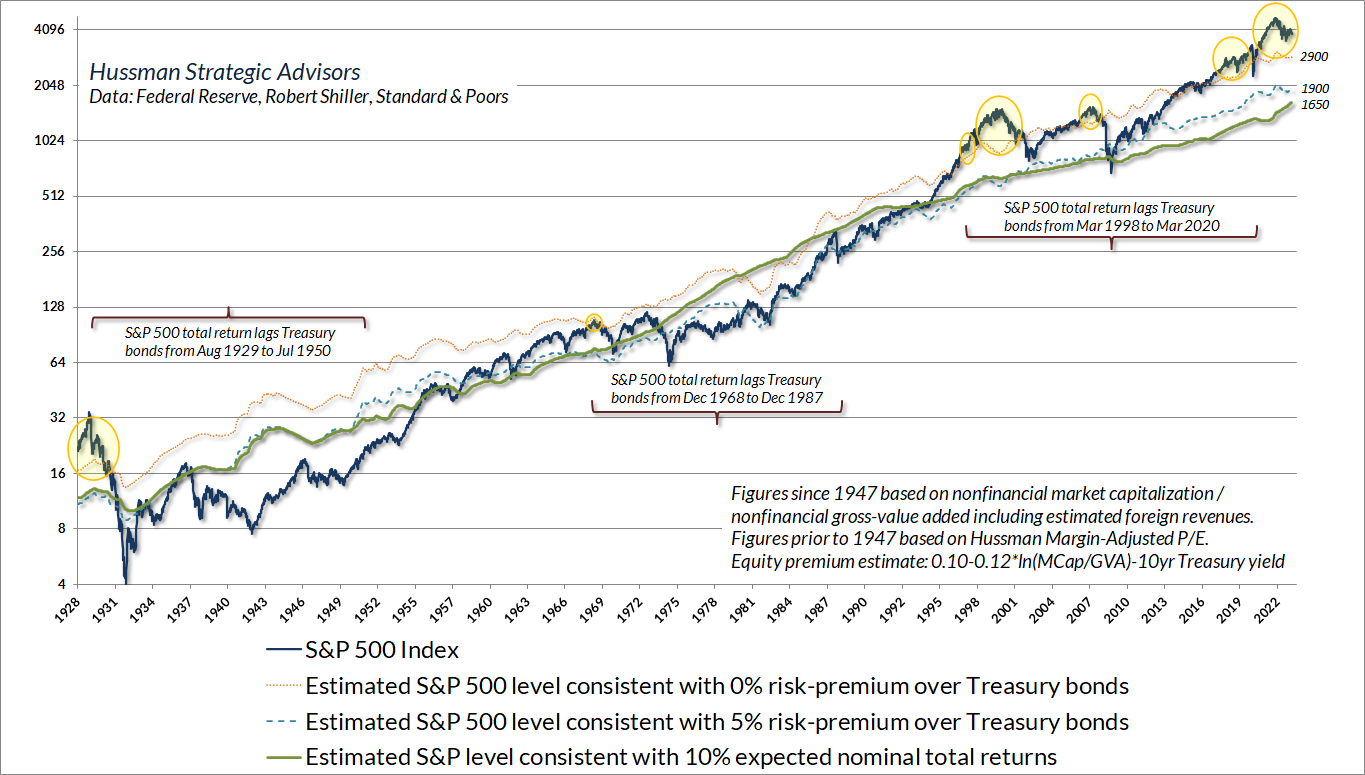
Notice that the S&P 500 has typically been above the green 10% line since 1995. It’s tempting to believe that the market should hug these valuation estimates. But that’s not how valuations work. Valuations only describe the mapping between prices and subsequent returns. To say that the S&P 500 is above the green 10% line is to say that over the long-term and the complete cycle, average annual returns are likely to be less than 10%. Indeed, S&P 500 total returns have averaged less than 10% during every 10-year horizon starting anywhere between 1995 and mid-2008, and those 10-year returns had a correlation of over 0.8 with starting valuations. Overvaluation doesn’t imply an immediate marekt decline. It implies lower long-term returns and deeper full-cycle loss. Our most reliable valuation measures have a strikingly good history of estimating both.
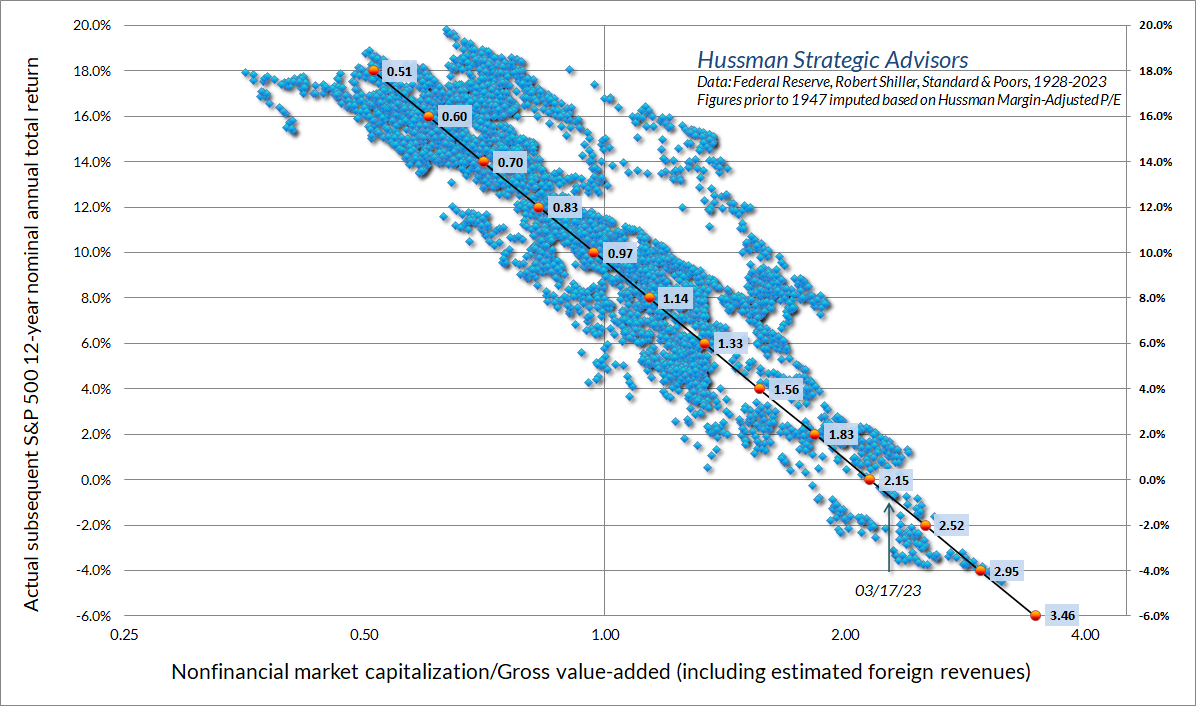
The distance between the S&P 500 and the green line in the chart above is proportional to our most reliable valuation measure: nonfinancial market capitalization to gross-value added, including estimated foreign revenues. Here’s how this valuation measure maps to subsequent market returns, in data since 1928. For an extensive discussion and analysis of factors that investors use to “justify” current valuations, including profit margins, interest rates, S&P 500 composition, growth, FANG stocks, and other factors, see the February market comment, Headed for the Tail.
With regard to potential market losses over the completion of this market cycle, it’s notable that the trough of a market cycle typically brings expected S&P 500 total returns to the greater of 10% annually or 2% above Treasury bond yields. The blue line on the chart below shows the market loss that would be required to restore that level of expected return. The blue cups certainly aren’t always filled with red ink immediately – again, overvaluation emphatically doesn’t imply immediate market losses. Still, the red ink at each point shows the deepest market loss over the subsequent 30-month period.
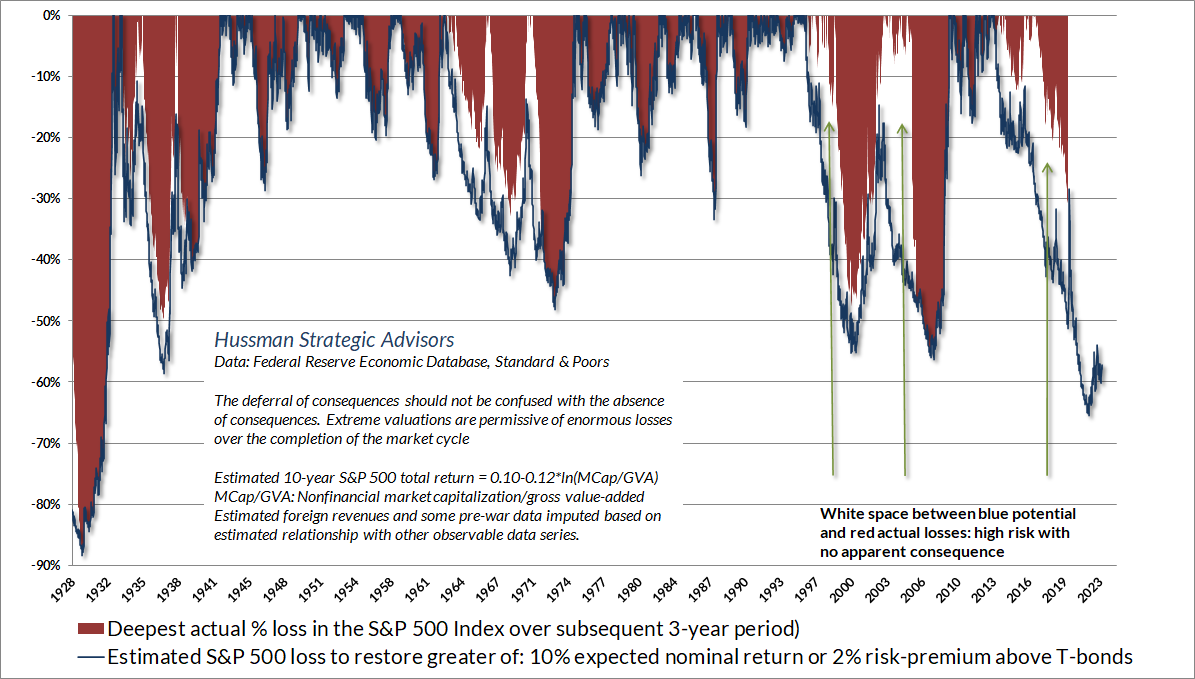
Emphatically, nothing in our investment discipline relies on extreme market losses, or a reversion to historical valuation norms. I do expect that severe market losses are likely, but our discipline doesn’t require any forecasts at all. Rather, our discipline is to align our market outlook with measurable, observable market conditions, primarily valuations and market internals (the uniformity or divergence of market action across thousands of individual stocks, industries, sectors, and security-types, including debt securities of varying creditworthiness).
We introduced our primary measure of market internals in 1998, with only minor adaptations since. The chart below presents the cumulative total return of the S&P 500 in periods where our measures of market internals have been favorable, accruing Treasury bill interest otherwise. The chart is historical, does not represent any investment portfolio, does not reflect valuations or other features of our investment approach, and is not an assurance of future outcomes.
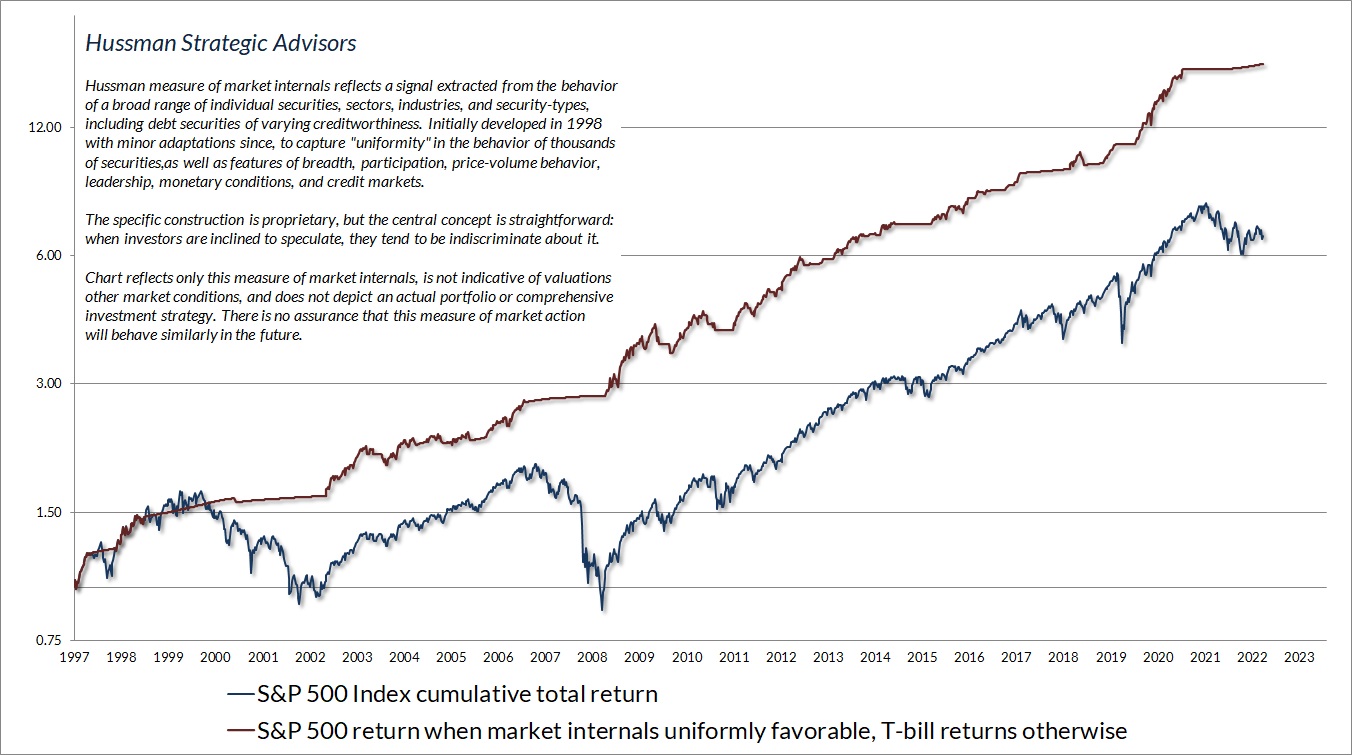
Since ragged, divergent internals are typically an indication of risk-aversion among investors, we view the combination of extreme valuations and poor market internals as a “trap door” situation. We continue to face that combination at present. If internals were to improve, we would suspend our bearish outlook even here, shifting to a neutral or constructive outlook, albeit with position limits and safety nets. For now, market conditions are not only unfavorable but increasingly fragile. Given that the most extreme market losses emerge when risk-aversion meets an inadequate risk-premium, suffice it to say that I chose the title of this comment intentionally.
Keep Me Informed
Please enter your email address to be notified of new content, including market commentary and special updates.
Thank you for your interest in the Hussman Funds.
100% Spam-free. No list sharing. No solicitations. Opt-out anytime with one click.
By submitting this form, you consent to receive news and commentary, at no cost, from Hussman Strategic Advisors, News & Commentary, Cincinnati OH, 45246. https://www.hussmanfunds.com. You can revoke your consent to receive emails at any time by clicking the unsubscribe link at the bottom of every email. Emails are serviced by Constant Contact.
The foregoing comments represent the general investment analysis and economic views of the Advisor, and are provided solely for the purpose of information, instruction and discourse.
Prospectuses for the Hussman Strategic Growth Fund, the Hussman Strategic Total Return Fund, the Hussman Strategic International Fund, and the Hussman Strategic Allocation Fund, as well as Fund reports and other information, are available by clicking “The Funds” menu button from any page of this website.
Estimates of prospective return and risk for equities, bonds, and other financial markets are forward-looking statements based the analysis and reasonable beliefs of Hussman Strategic Advisors. They are not a guarantee of future performance, and are not indicative of the prospective returns of any of the Hussman Funds. Actual returns may differ substantially from the estimates provided. Estimates of prospective long-term returns for the S&P 500 reflect our standard valuation methodology, focusing on the relationship between current market prices and earnings, dividends and other fundamentals, adjusted for variability over the economic cycle. Further details relating to MarketCap/GVA (the ratio of nonfinancial market capitalization to gross-value added, including estimated foreign revenues) and our Margin-Adjusted P/E (MAPE) can be found in the Market Comment Archive under the Knowledge Center tab of this website. MarketCap/GVA: Hussman 05/18/15. MAPE: Hussman 05/05/14, Hussman 09/04/17.

