

Asking a Better Question


John P. Hussman, Ph.D.
President, Hussman Investment Trust
September 2024
Simply put, we agree that economic conditions have eased enough to make gradual reductions in the Federal funds rate reasonable. The current rate is already consistent with systematic benchmarks, but we do continue to see economic conditions hovering at the threshold of recession. We would need more evidence to expect a recession with confidence, but provided that the Fed continues to support monetary confidence by gradually shrinking its balance sheet, I don’t see much risk in modestly cutting interest rates at the same time (particularly since rate cuts would presently be accomplished simply by the Fed paying a lower interest rate to banks on their reserve balances).
– John P. Hussman, Ph.D., Fed Pivots and Baby Aspirin, August 30, 2024
On September 18, the Federal Reserve cut the Federal funds rate, as expected, announcing at the same time that the Fed will continue to reduce its balance sheet. I my view, both of these decisions were appropriate. The Fed reduced short-term rates by 50 basis points, which was consistent with economic conditions that remain near the threshold of recession. Still, remember that the economic effect size of rate cuts is quite limited. Even a 100 basis point reduction in the Fed funds rate has historically been associated with a reduction of less than 0.2% in the unemployment rate one year later. There’s also no meaningful relationship between quantitative easing and subsequent economic activity beyond what can be explained by wholly non-monetary variables – though QE can certainly amplify yield-seeking behavior when rates are near zero and investors are inclined to speculate – so the Fed’s commitment to further balance sheet reduction was welcome and appropriate.
While the S&P 500 has advanced by less than 1% since the preponderance of “overextension” syndromes we observed on July 16, the desperate “fear of missing out” among investors is striking. The narrative on financial television seems completely insensitive to prevailing conditions, as analysts cite average outcomes following Fed pivots, and average bull market gains – completely detached from the present context, where valuations are already at record highs, while market conditions feature lopsided bullish sentiment and continued divergence in our key gauge of market internals (important notes on that below). As I detailed in the July comment, You’re Soaking In It, a rate cut is typically worth a one-day pop even when internals are unfavorable, but on average, market losses have actually been worse when easy money is combined with divergent internals.
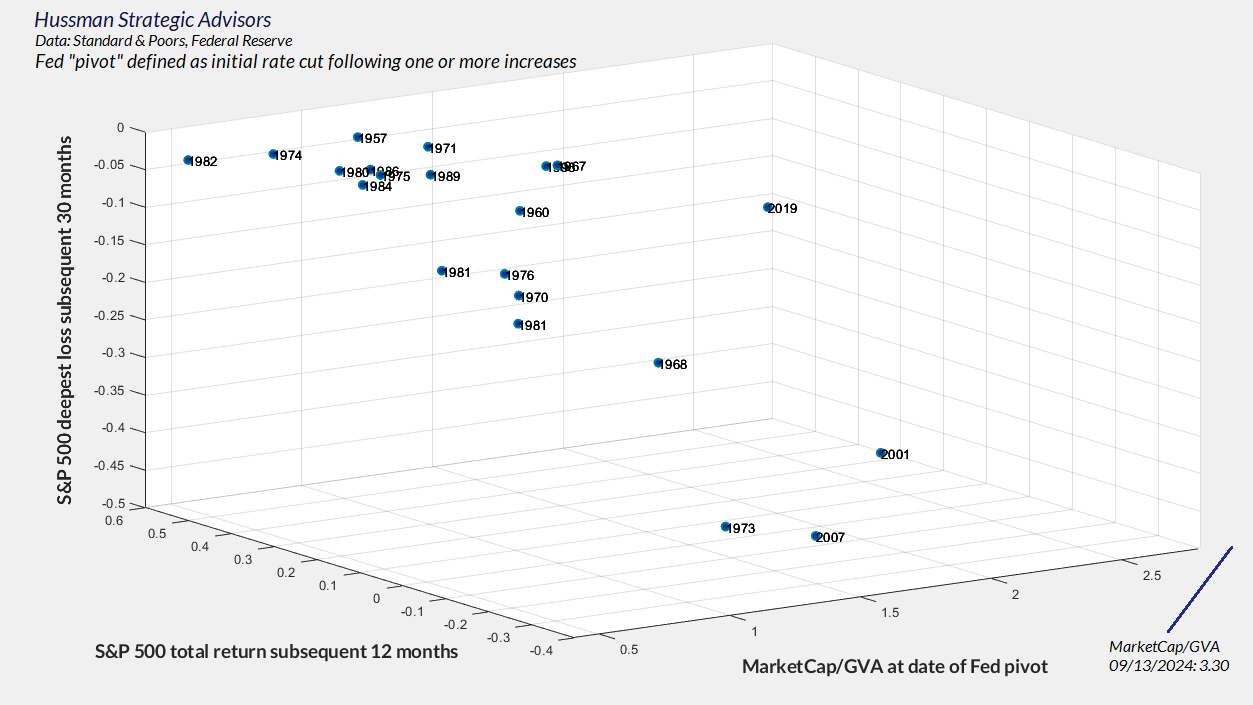
Meanwhile, more often than not, Fed pivots have historically occurred at moderate or depressed levels of market valuation. That feature matters, so one can’t simply quote “average” outcomes apart from that context. The chart below shows the 12-month total return of the S&P 500 and its deepest 30-month loss following Fed pivots across history, based on the level of market valuation at the time of the pivot. MarketCap/GVA is the ratio of the market capitalization of nonfinancial companies to gross value-added, including our estimate of foreign revenues, and is our most reliable gauge of market valuation (based on correlation with actual, subsequent 10-12 year S&P 500 total returns in market cycles across history). The current level of 3.3 is the highest extreme in history, eclipsing both the 1929 and 2000 bubble peaks.
Clearly, one cannot discuss pivots like 1982, 1974, which occurred at the lowest valuations in history, as if they’re somehow representative of what investors should expect, particularly at a point where valuations are beyond the extremes of 2001 and 2007.
As Jeremy Grantham observed earlier this year, “We have totally full employment, totally wonderful profit margins. All the things you would not want to start a bull market from. This is where you start bear markets from. Great bull markets start with exactly the opposite.”
The third great speculative U.S. bubble – a long-term perspective
I continue to view period since January 2022 as the extended top formation of the third great speculative bubble in U.S. financial history. From its initial valuation peak in January 2022 to last week, the capitalization-weighted S&P 500 has outperformed Treasury bills by only about 10%, with nearly all of that owing to the bounce since early August. Meanwhile, both the Russell 2000 small-cap index and the S&P Midcap 400 index, as well as the equal-weighted S&P 500 and Nasdaq 100 indices, remain even with or behind Treasury bill returns for this period.
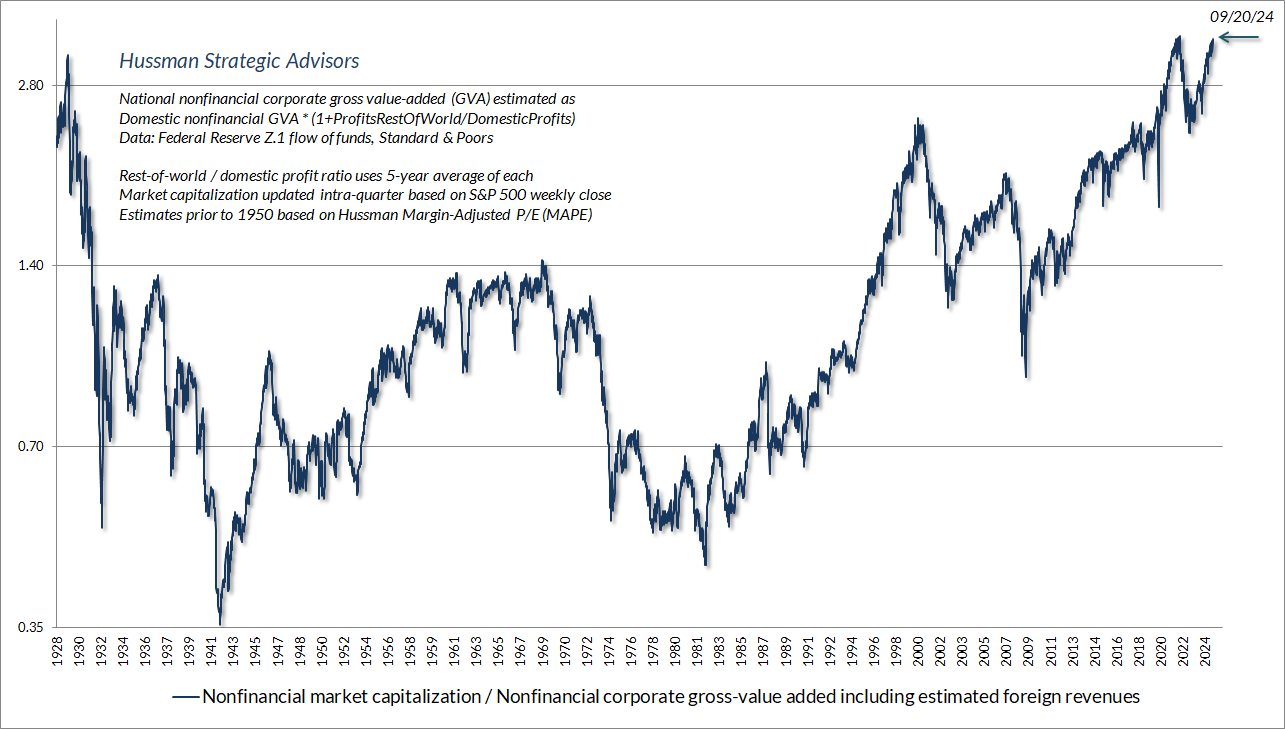
The chart below offers a long-term perspective on valuations, based on our most reliable measure, MarketCap/GVA.
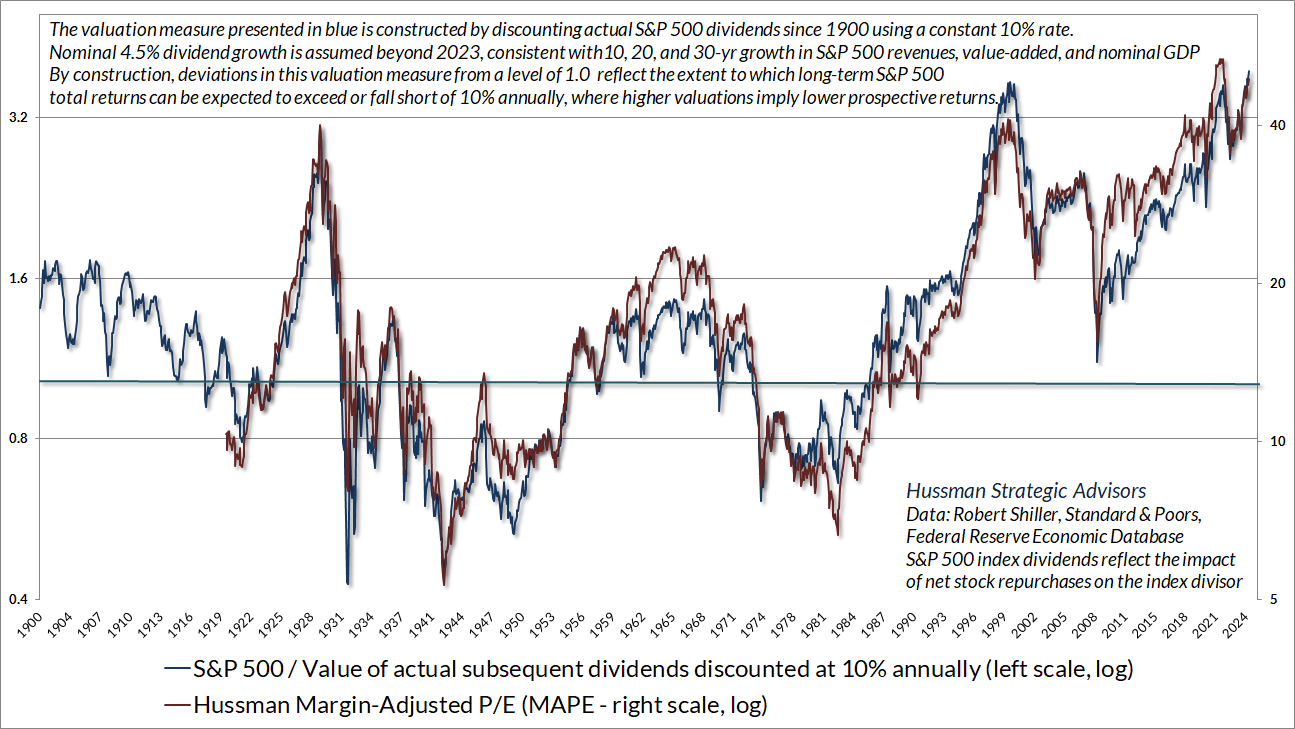
As I’ve often noted, a reliable valuation measure is just shorthand for a proper discounted cash flow analysis. The chart below shows our Margin-Adjusted P/E, which considers cyclical variations in profit margins and their impact on the price/earnings ratio, along with the ratio of the S&P 500 to the present value of actual subsequent S&P 500 dividends since 1900, discounted at a constant rate of 10% annually. The ratio therefore estimates the extent to which likely long-term S&P 500 total returns are likely to depart from a 10% average return. The higher the valuation, the larger the expected shortfall.
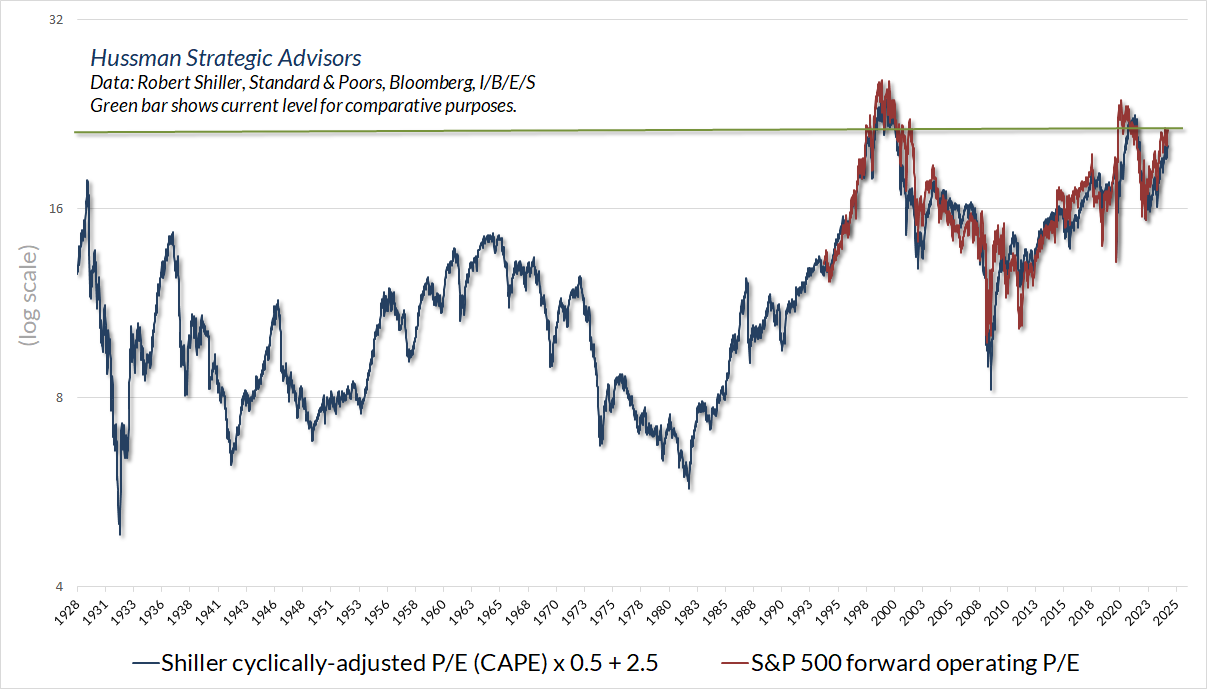
Even if one accepts analyst estimates of year-ahead S&P 500 operating earnings at face value, current valuations are at rare extremes. Since the price/earnings ratio on forward operating earnings has only been popular since the 1990’s, investors often overestimate what “normal” valuations are. One can get a better sense by comparing the forward P/E with Robert Shiller’s cyclically-adjusted P/E (CAPE), which has a far longer history. The green horizontal line shows the current extreme for comparative purposes. In the available data since the 1980’s, the current price/forward operating P/E is associated with subsequent 10-year average S&P 500 nominal total returns between -2% to 3% annually.
To offer a sense of the long-term, full cycle implications of these valuation extremes – which emphatically do not imply near-term outcomes – the chart below shows the relationship between MarketCap/GVA and actual subsequent 12-year S&P 500 total returns, in data since 1928.
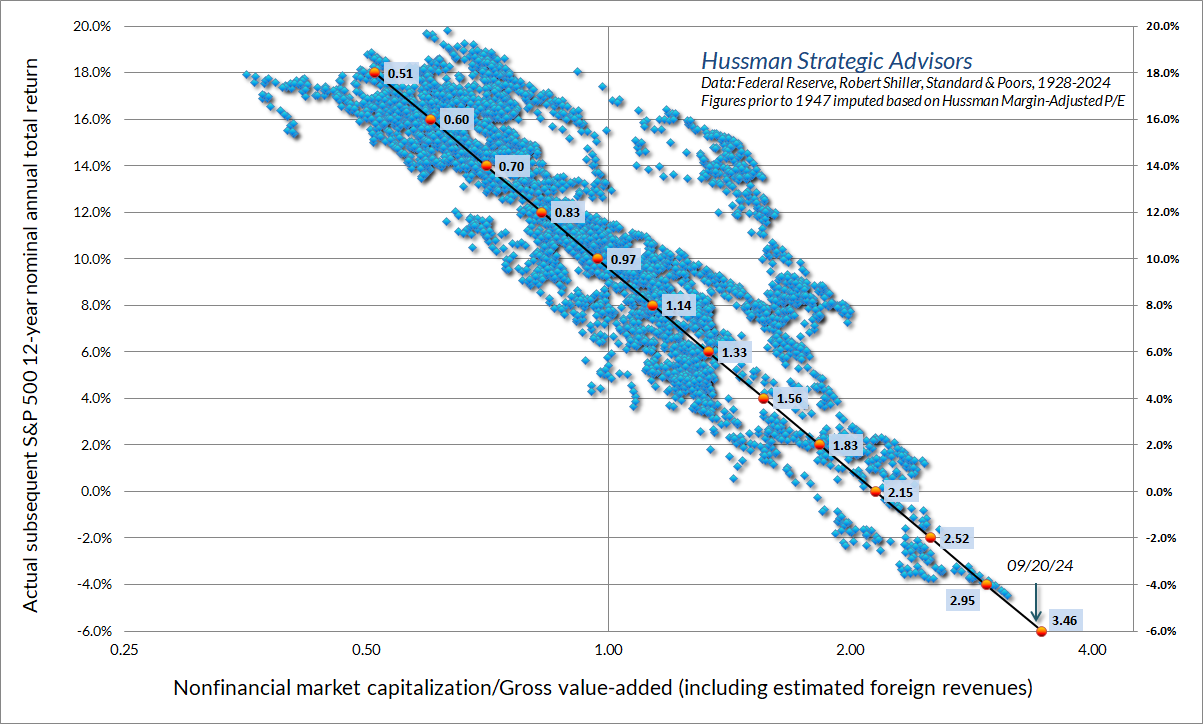
As a side note, it’s often asserted that the use of overlapping 12-year periods produces an invalid estimate of the relationship between valuations and subsequent returns. This is not true. Serial correlation doesn’t bias a linear estimator, it just makes the t-statistic inconsistent. In plain language, that means that one might draw a slightly wider range of lines through the points in order to get a “confidence interval” for the true relationship. But you still need to draw those lines through the points, and the line you see on the chart above is unbiased.
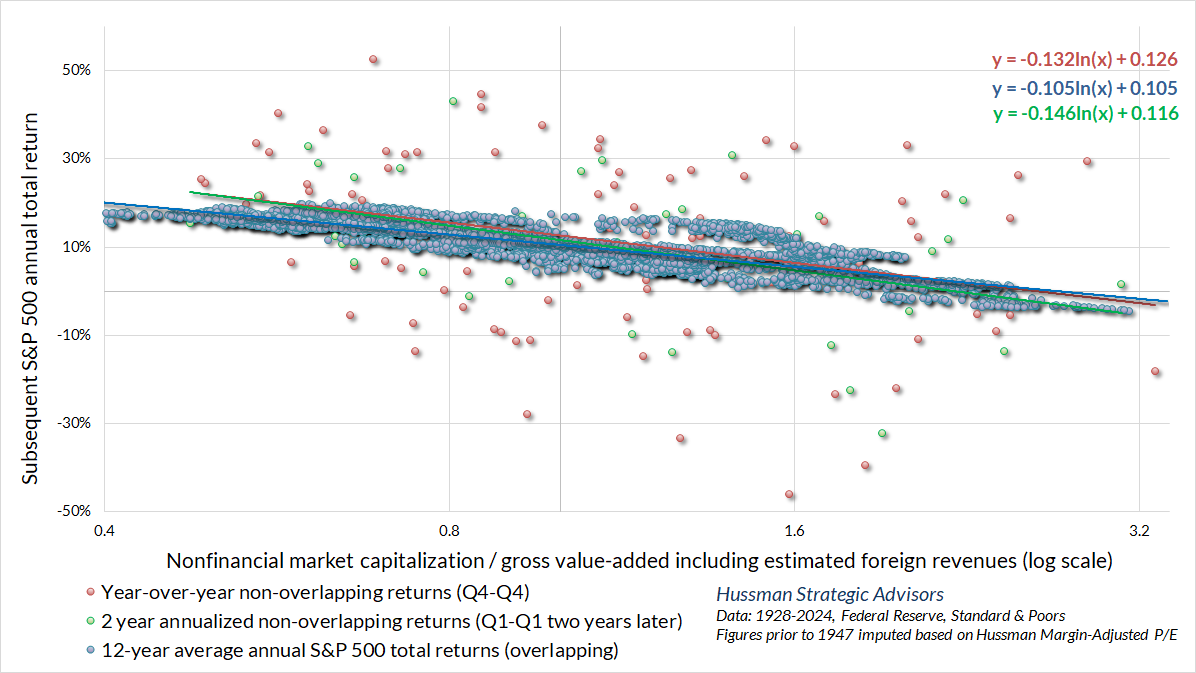
A simple way to see what’s going on is to run the same estimation using one-year or two-year non-overlapping returns. You get fewer points, and for short horizons of a year or two, there’s an enormous amount of variation (as the investment horizon gets longer, the points converge more tightly toward the true long-term relationship). Notice that even using these very noisy but wholly independent data points, the lines that relate (log) valuations and subsequent market returns are very similar. The line looks flatter only because the Y axis spans four times the range as the chart above.
Asking a better question
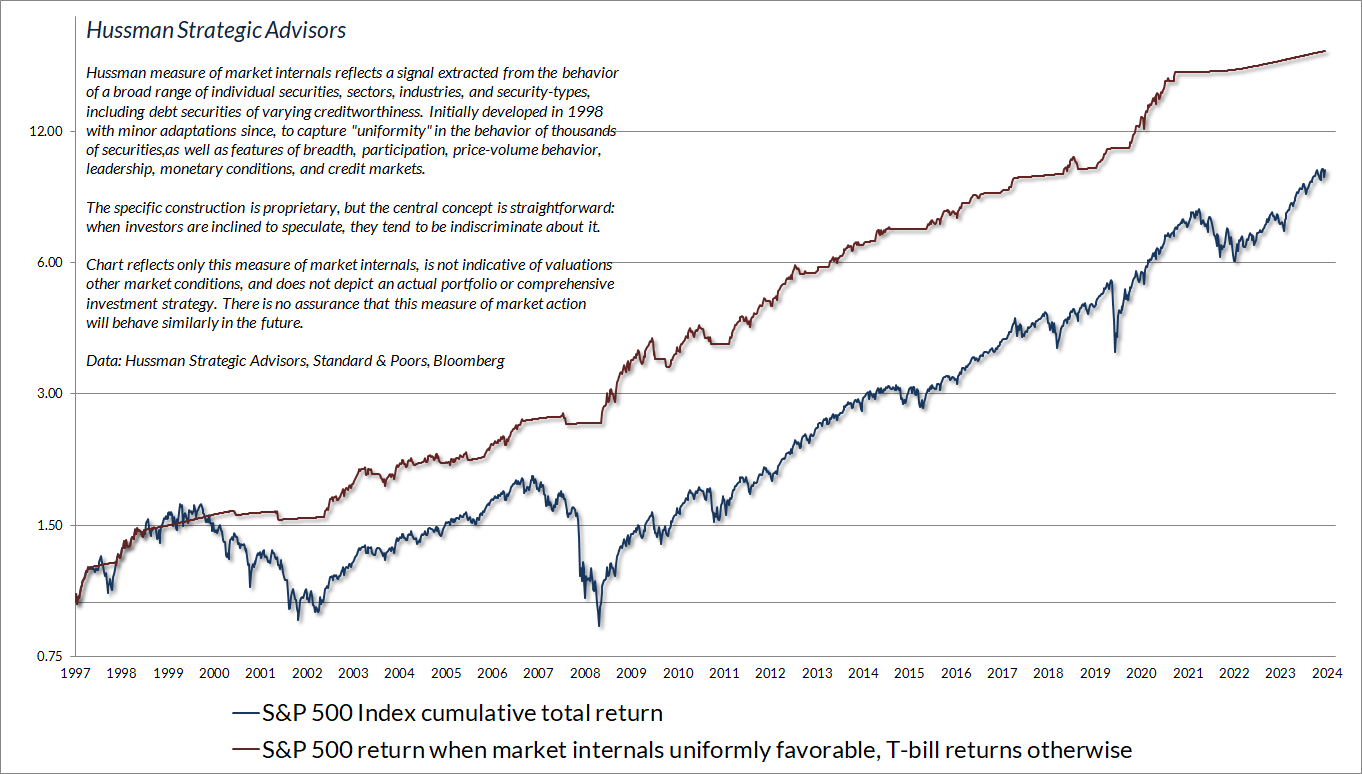
In our investment discipline, valuations inform our expectations for long-term and full-cycle market outcomes. In addition to valuations, we gauge the inclination of investors toward speculation or risk-aversion based on the uniformity or divergence of market action across thousands of individual stocks, industries, sectors, and security-types, including debt securities of varying creditworthiness (when investors are inclined to speculate, they tend to be indiscriminate about it). We also attend to syndromes of extremely overextended market conditions, monetary policy, economic conditions, and other factors. Our discipline does not rely on forecasts, scenarios, or projections of market action. Instead, we try to align our investment stance with observable, measurable market conditions as they change over the market cycle.
The chart below presents the cumulative total return of the S&P 500 in periods where our main gauge of market internals has been favorable, accruing Treasury bill interest otherwise. The chart is historical, does not represent any investment portfolio, does not reflect valuations or other features of our investment approach, and is not an assurance of future outcomes.
Following initial market losses into 2023, the rebound of recent quarters, particularly in the capitalization-weighted indices, has been uncomfortable for us. Persistently extreme valuations and divergent internals have provided little opportunity to demonstrate the impact of the adaptations we introduced in 2021. These adaptations encourage a constructive outlook when internals are favorable, even amid rich valuations albeit with position limits and safety nets, holding neutral only in particularly extreme conditions.
For us, the challenge in recent quarters has been the persistent combination of divergent market internals and valuations still far beyond historical norms. Many of my efforts in recent months have focused on the apparent conflict between our gauge of market internals and popular, seemingly “obvious” trend-following measures. The question for investors, of course, is which matters more.
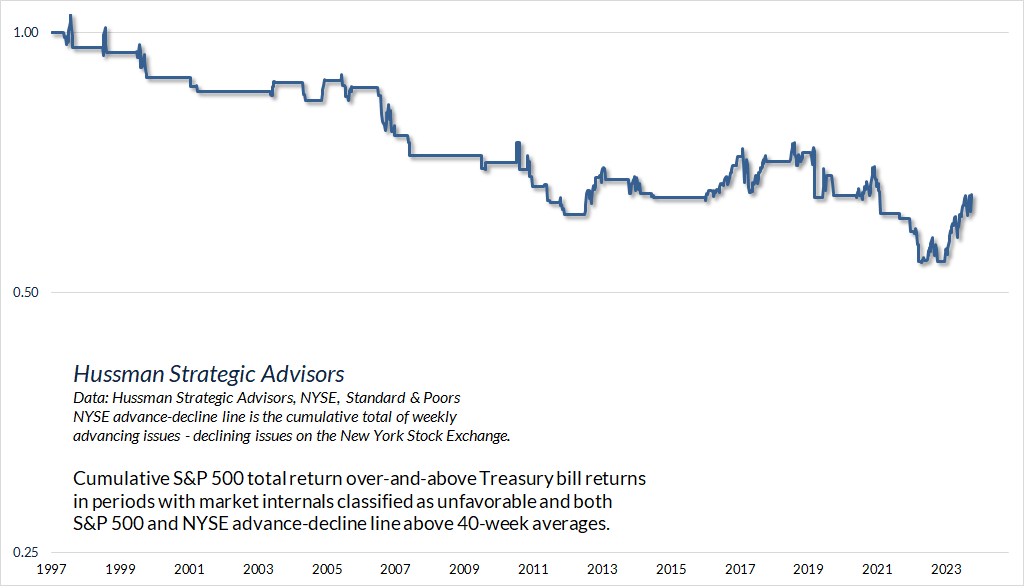
The chart below illustrates the answer that we consistently find to this question. This particular example shows the cumulative total return of the S&P 500 during periods when our own gauge of market internals has been unfavorable, yet the S&P 500 has been above its 40-week average. We see the same profile in decades of market cycles before 1998 as well. Despite periodic divergences, the status of market internals has ultimately mattered most.
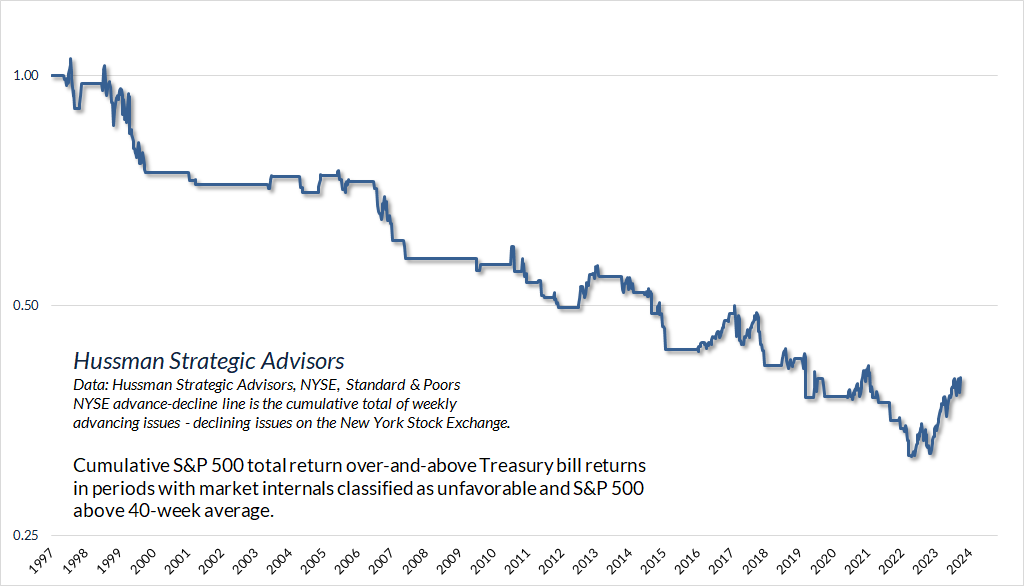
We find the same outcome even when both the S&P 500 and the NYSE advance-decline line are above their 40-week averages. Indeed, across hundreds of similar studies, we find that market internals have been more reliable than alternative trend-based measures. If that wasn’t the case, we would happily adopt more reliable alternatives.
My impression is that internals have remained unfavorable precisely because of the internal divergences they are designed to measure. Presently, these divergences reflect a period of more than two years during which equal-weighted indices of stocks at every market capitalization have lagged Treasury bills, and sectoral divergences resulting from economic conditions that have persistently hovered at the borderline of recession (though we would still need more evidence to expect that outcome with confidence).
Still, we have some good news, and some good news.
The first piece of good news is that, by all evidence, internals are measuring precisely what they are intended to measure. We clearly don’t rule out the possibility that internals may shift even a week or a month from today, but we do have confidence that our gauge of internals remains a valid measure of what it is intended to measure.
It’s the wrong question to ask, “How can we somehow force internals to look like trend-following measures that aren’t as reliable across history?” Happily, abandoning that question frees us to ask a better question. Once one accepts that internals are, in fact, behaving as intended, the question becomes:
How can we benefit during bearish conditions when valuations and internals validly hold us to a defensive outlook, yet obvious but less reliable trend-following measures remain favorable?
As John Dewey wrote, a problem well-stated is half-solved. If the average outcome of bearish conditions is a market decline, and it’s not possible to find observable conditions that distill a subset that has positive average returns, then it’s not helpful to “force” a valid, unfavorable market assessment to be favorable.
Instead, the solution begins with accepting the unfavorable market assessment as valid – that market returns are likely to be negative, on average, regardless of how we partition the data. Instead of trying to force our response to shift from bearish to constructive, the appropriate response is to modify the intensity of the bearish outlook itself. From a hedging perspective, that variation in exposure, while maintaining the same directional tilt, is known as a “gamma scalp.” That’s always been part of our discipline, but asking the right question revealed some latitude for enhancement.
So, the second piece of good news is this. We’ve enhanced the component of our hedging discipline that informs our choice of put option strike prices in periods that are classified as bearish. The underlying hedging mathematics essentially integrate the consensus of dozens of technical gauges that measure a wide range of shorter-term factors such as trend, channel, compression, overextension, breakout, and reversal. The result is a better ability to distill bearish periods when the market loses value, on average, but only at a moderate average rate, versus bearish periods when the market also loses value, on average, but at a wicked average rate.
The moderate periods still warrant a defensive outlook, because the market does tend to lose value during those periods, on average, but that outlook is now more likely to take the form of out-of-the-money put options. The wicked periods also warrant a bearish outlook, but are more likely to take the form of high and tight put strikes. The greatest benefit of that variation emerges when a bearish outlook, in hindsight, turns out to be wrong. The “pain trades” – maintaining a bearish market outlook during an uncharacteristic advance, as we’ve seen in recent months – become far less frequent. Not by “forcing” a constructive outlook despite “trap door” combinations of extreme valuations and unfavorable internals, but by refining the sensitivity of the hedge.
Taken together, here’s where we stand. Our 2021 adaptations primarily shifted our response to favorable internals. In data since 1940, our present investment discipline, as adapted, suggests a constructive or aggressive investment outlook in about two-thirds of those periods, with the majority either unhedged or leveraged. Only about a quarter of periods since 1940 are classified as bearish. This breakdown may seem inconsistent with the misapplied “permabear” label on my paw, but then, my inclination to adopt a constructive or bullish outlook is far greater than investors may recognize. We do, however, require market conditions that justify that.
Herb Greenberg, who’s still writing, and has an interesting and useful column On The Street on Substack, shared this note a few weeks before the January 2022 peak:
John, I don’t think anybody would believe me if I told them that back in the early 1990s I used to refer to you as one of my column’s “resident bulls…”
And then… we started getting charts like this! 😱🤣 https://t.co/sfQmHYkNxb
— Herb Greenberg (@herbgreenberg) December 6, 2021
Since mid-2021, because of persistently elevated valuations and unfavorable market internals, our discipline has encouraged a bearish outlook about 70% of the time, with a fairly neutral outlook otherwise. The new bit applies to these bearish market conditions. When prevailing market conditions encourage a bearish outlook, the “moderate” hedge I’ve described above has applied in about 25% of bearish periods since 1940, about 50% of bearish periods since 2021, and about 75% of bearish periods year-to-date (though not at the moment). The S&P 500 has actually lost value in the remaining periods year-to-date.
That’s the research update. My hope and expectation is that you’ll see the impact of this particular enhancement within weeks or months, rather than quarters or years. As usual, we’ll respond to observable conditions as they change. No forecasts are required.
Shadow of the motherlode
In mid-July, we saw the largest preponderance of overextended warning syndromes since the March 2000 and January 2022 market peak. At present, the S&P 500 is less than 1% above its July peak, yet there’s a far more palpable tenor of fear, capitulation, and defeat surrounding the very idea of a defensive market outlook. The exuberance is contagious, as are narratives of soft landings and a fresh “rate cutting cycle.”
Still, it’s useful to remember how this ends. Jeremy Grantham’s work, like ours, is informed by the study of countless bubbles across history. They always end in exuberance: “Everyone feels great, and that’s how you get to a market peak. You feel great about everything. Of course, almost by definition. When do you start going down? You still feel great. You just don’t feel quite as great as you felt the day before.”
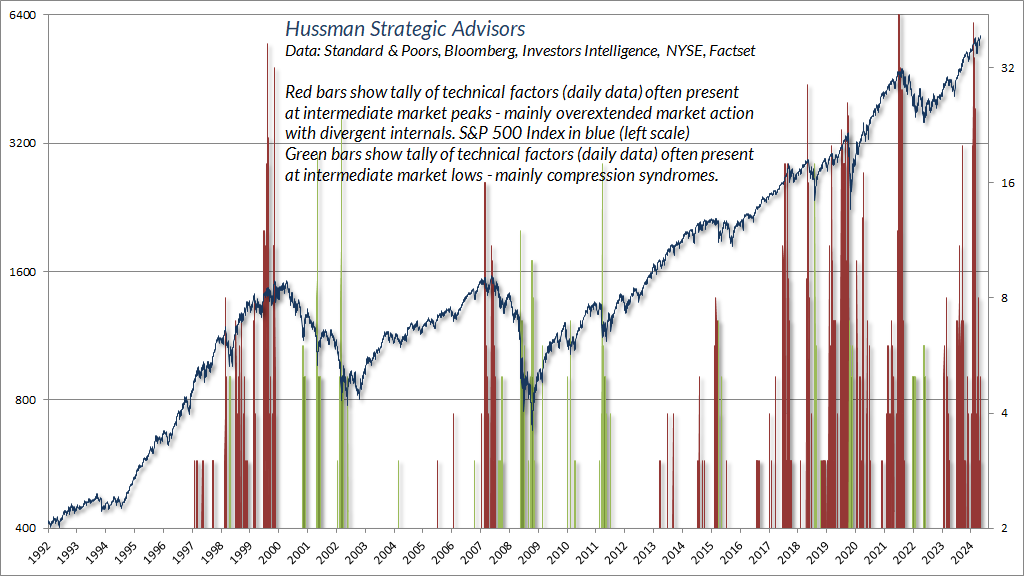
The chart below shows the tally of overextension syndromes (red) and compression syndromes (green) that we’ve observed daily data since 1992. The largest number of syndromes was registered on July 16, less than a percent from current levels.
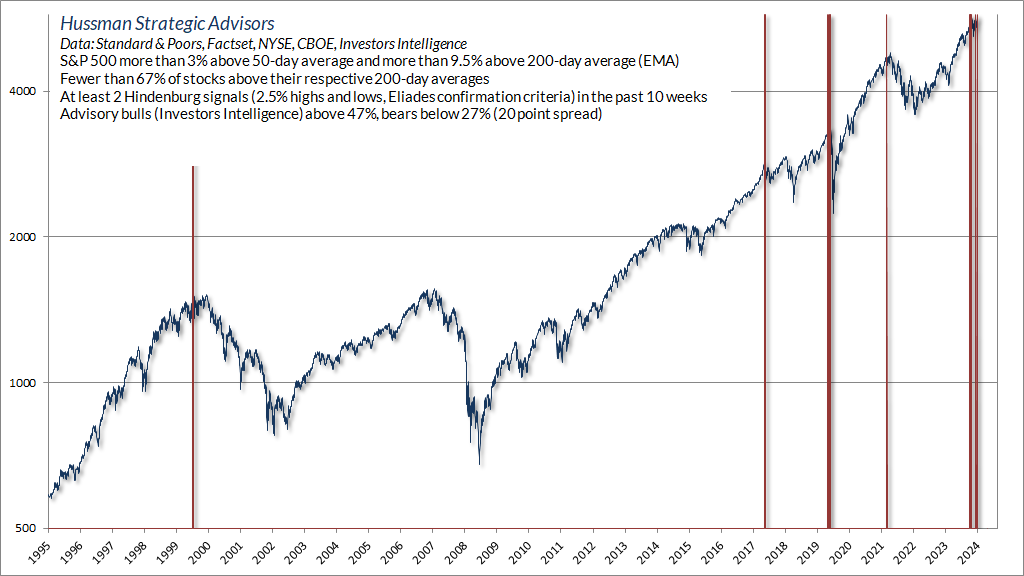
We saw the syndrome below on Friday, September 20. As usual, none of these syndromes are forecasts or investment disciplines in themselves. Rather, we monitor scores of them as a way of inferring a common signal from multiple, imperfect sensors.
Nothing in the current motherlode of market extremes ensures that the market has hit a peak, or that stocks can’t register further highs. I generally don’t have a forecast about near term outcomes, and I don’t have one here. I do believe long-term, full-cycle market prospects are dismal, and that present conditions warrant a bearish market outlook. Even so, our long-term investment stance will be made of no other substance than the series of investment stances that we adopt from one week to the next, in response to the conditions we observe at each point. I only know the present stance for certain. Our next outlook seems more likely to be a neutral outlook than a constructive one, but we’ll take the evidence as it comes. In short, our investment discipline is to identify prevailing, observable market conditions, and align our investment outlook with the expected return/risk profiles that we associate with those conditions.
A large move of small effect
As I noted at the outset, the recent 50 basis point cut in the Fed funds rate, coupled with continued Fed balance sheet reduction, are both reasonable in my view. I doubt that the rate cuts will have much economic impact, but that’s part of the reason that it’s fine for them to be a bit aggressive. More important on the inflation front is confidence in monetary liabilities, and the Fed’s continued balance sheet reduction should support that.
It’s notable that the current level of the Fed funds rate is already fully consistent with systematic policy benchmarks based on factors such as prevailing core inflation, unemployment, real retail sales, and the GDP output gap. In my view, the notion that the Fed funds rate is far above “neutral” is mostly a reflection of anchoring and lookback bias. More a reflection of short memories than economic analysis.
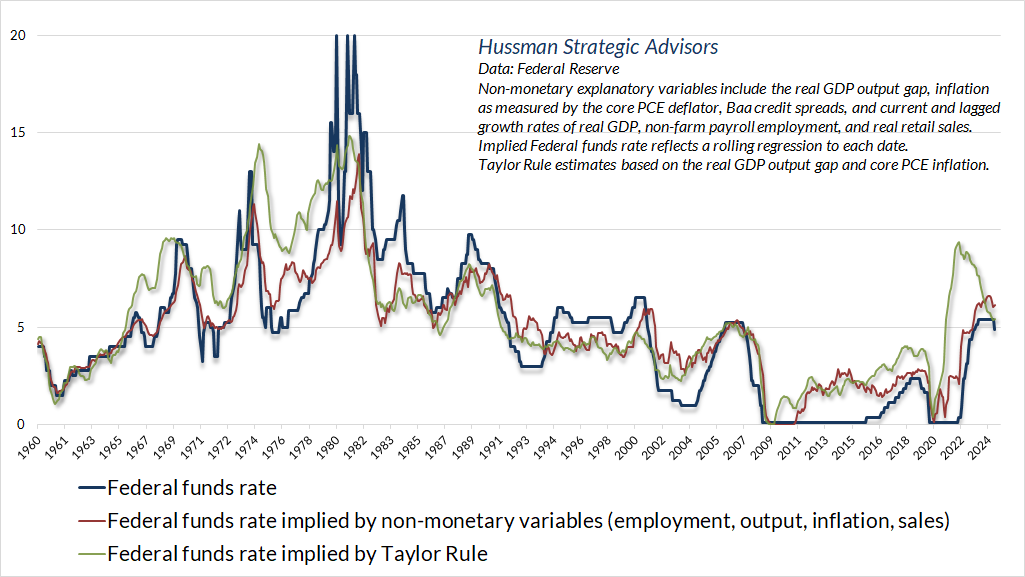
To the extent that the unemployment rate is still just 4.2%, real GDP stands above its estimated non-inflationary potential, and core inflation is still comfortably above the Fed’s targets, one might wonder whether any rate cut was justified at all. That’s a reasonable argument – I’m just not convinced that small changes in the Fed funds rate make much economic difference. As for the stock market, as I’ve regularly detailed in other comments, easy money does amplify the speculative impact of favorable market internals, but otherwise, the condition of market internals is more important to market returns.
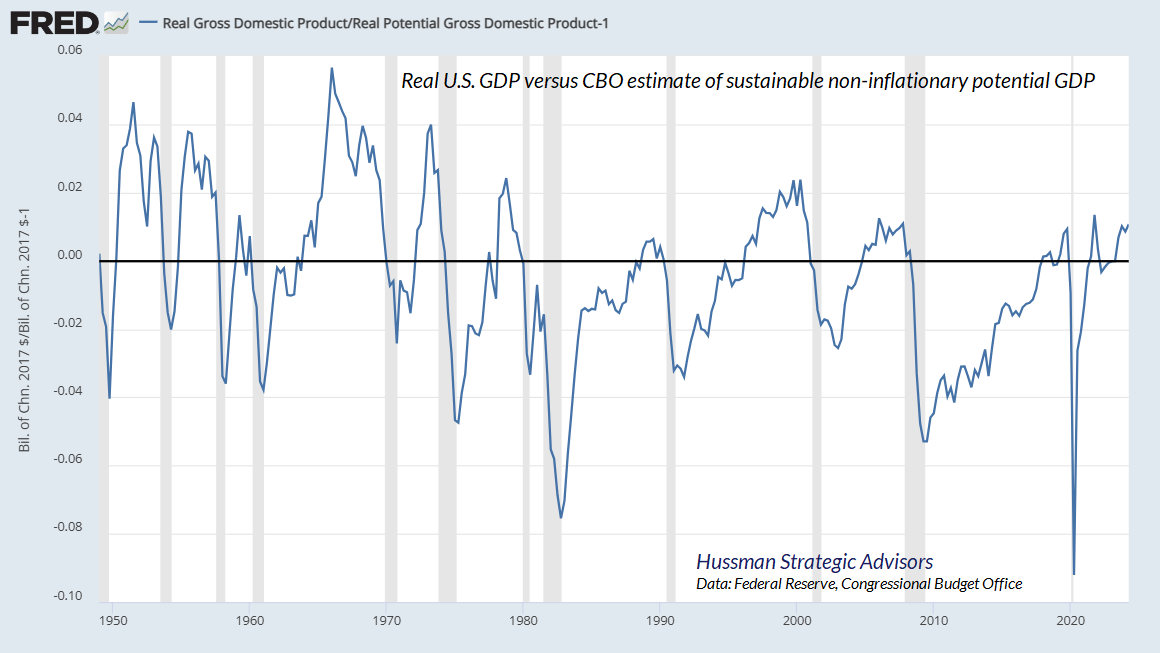
The chart below shows the GDP output gap, defined as the difference between real GDP and the Congressional Budget Office estimate of sustainable non-inflationary potential GDP.
Notice something. Recessions typically emerge after GDP has run beyond its potential. Recessions typically emerge after the rate of unemployment has dropped to low levels. In those periods of tight capacity, the Fed will typically be raising rates, not to cause a recession, but in an effort to cool demand that has run beyond sustainable supply. In this context, it’s not Fed hikes that cause a recession, but Fed hikes that accompany periods of tight capacity, which in and of themselves are naturally followed by economic retreat. Recessions are typically blamed on Fed tightening, but that’s not really how it works.
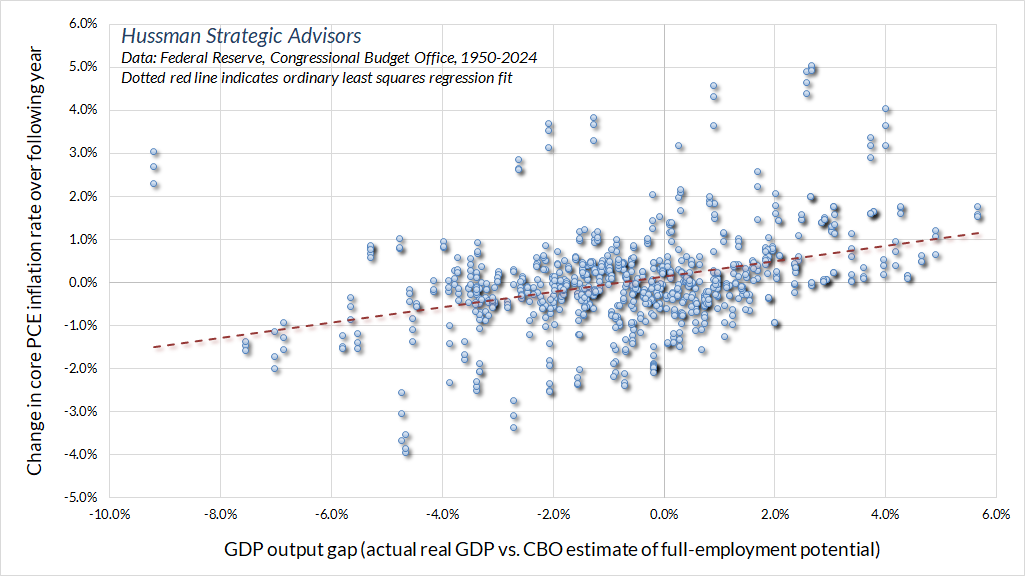
Of course, one of the reasons the Fed tries to restrain demand when GDP is running above potential is that positive output gaps (real GDP above potential) tend to be followed by higher inflation. The relationship, like most economic relationships, isn’t terribly strong, but it’s worth keeping in mind that by easing policy when GDP is above potential, unemployment is still depressed, and inflation remains above the Fed’s 2% target, the Fed has already been generously accommodative.
One of the striking aspects of the yield curve here is the extent to which investors have priced in a recession. As Ian Harnett of ASR London has observed, the 2-year Treasury yield has never been this far below the prevailing Fed funds rate (essentially anticipating aggressive rate cuts) except just before or during recessions. Given that the level of unemployment has modestly increased, and a broad range of leading measures are still hovering at the threshold of recession, an economic downturn shouldn’t be ruled out. It’s just that investors have already priced it in, along with rather aggressive rate cuts. Fixed income investors now require a recession for longer-term rates to make sense.
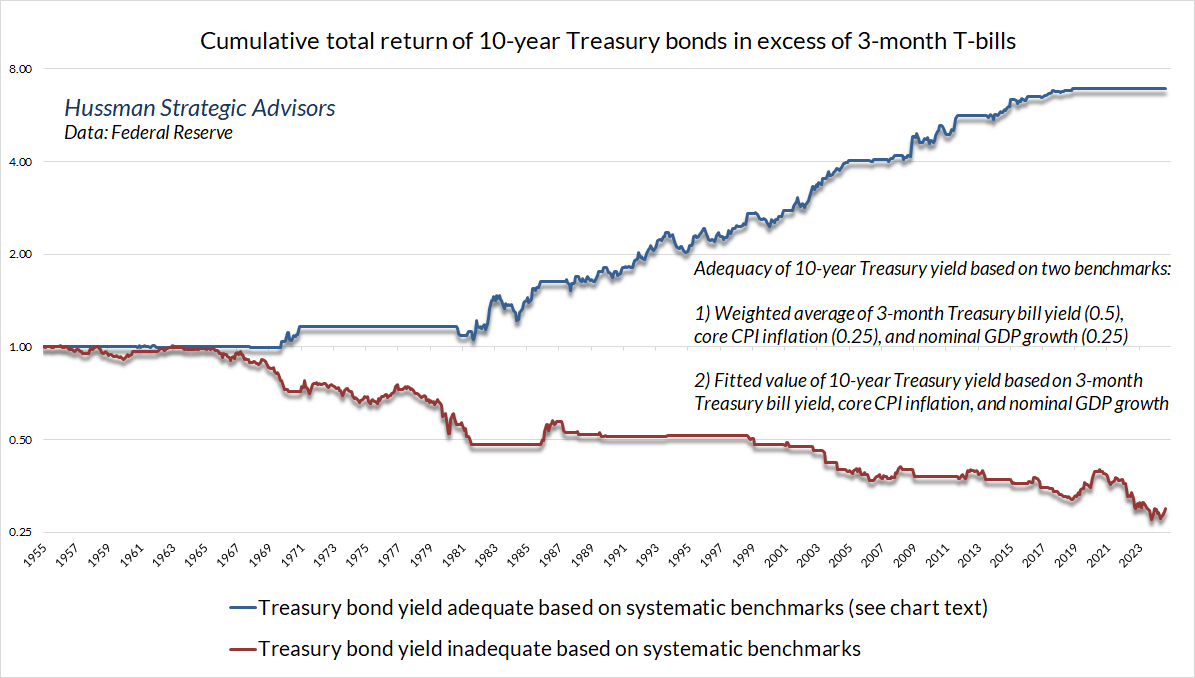
For our part, we continue to view longer-term interest rates as acceptable but somewhat inadequate. The chart below shows the 10-year Treasury bond yield relative to simple but useful benchmarks we’ve developed and monitor.

The chart below shows the cumulative total return of 10-year Treasury bonds, over-and-above Treasury bill yields, depending on whether or not prevailing yields were adequate based on the benchmarks above.
Meanwhile, given that the entire historical total return of the Philadelphia Gold & Silver Index (XAU) has emerged during periods of falling interest rates (even defined as simply as the 10-year Treasury yield below its level of 6 months earlier), coupled with still tepid leading economic indicators, downward pressure on real interest rates, and still reasonable valuations by our measures, we remain constructive in that sector. It’s important to keep volatility in mind when setting allocations, because even normal corrections can feel jarring otherwise, but as I noted last month, precious metals shares have been a useful and complementary component of our fixed income investment discipline.
Be aware of where we are in the cycle
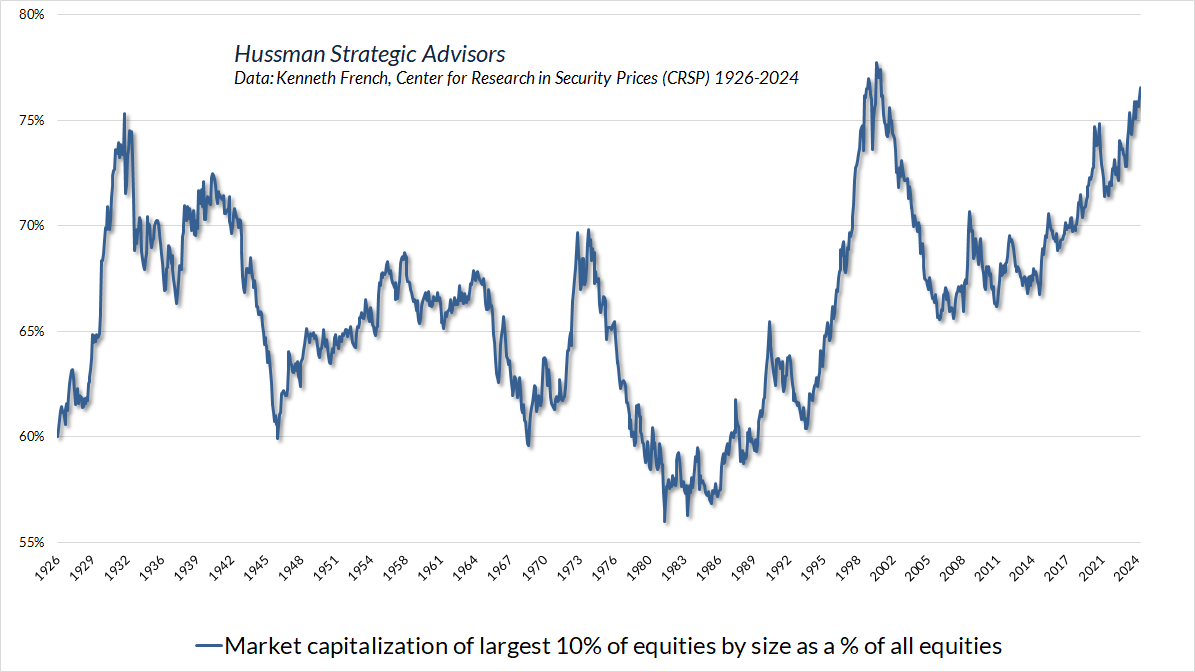
Amid record valuation extremes, amid the extended peak of the third great speculative bubble in U.S. history, and amid the greatest concentration of market capitalization in speculative glamour stocks since the peaks of the other two bubbles in 1929 and 2000, one thing seems certain. Market conditions will change.
If you look carefully, the seeds of a collapse are already present in a bubble. The seeds of a great bull market are already present in a collapse. No forecasts are required. All that’s required is flexibility.
All the adaptations we’ve made in this bubble have the effect of restoring the strategic flexibility that we lost once interest rates hit zero and speculation no longer had reliable “limits.” Nothing in our discipline relies on valuations approaching or breaking their historical norms ever again. Nothing relies on speculative limits. Nothing relies on the absence of future episodes of zero interest rates or QE. We’ve adapted in ways that lean toward much more constructive positions when internals are favorable, and throttle our bearish positions to better tolerate periods like recent quarters when internals are unfavorable and uneven speculation continues anyway.
What will matter from here is full-cycle discipline, flexibility, and mindfulness of market conditions as they change. Unfortunately, those are the last things investors have on their minds. Instead, investors have become convinced that it is enough to buy and hold stocks with no thought about price, valuation, or the relationship between market conditions and market outcomes. Investors seem to imagine that expected returns will simply mirror average historical returns, completely ignoring the valuations that were responsible for those historical averages.
Given where we stand in the market cycle, if I were to include nothing in these monthly comments but the quote below from Graham & Dodd, published after the 1929-1932 collapse, I would be content that I had done investors a service.
One of the striking features of the past five years has been the domination of the financial scene by purely psychological elements. In previous bull markets the rise in stock prices remained in fairly close relationship with the improvement in business during the greater part of the cycle; it was only in its invariably short-lived culminating phase that quotations were forced to disproportionate heights by the unbridled optimism of the speculative contingent.
But in the 1921-1933 cycle this ‘culminating phase’ lasted for years instead of months, and it drew its support not from a group of speculators but from the entire financial community. The ‘new era’ doctrine – that ‘good’ stocks were sound investments regardless of how high the price paid for them – was at bottom only a means of rationalizing under the title of ‘investment’ the well-nigh universal capitulation to the gambling fever.
Why did the investing public turn its attention from dividends, from asset values, and from average earnings to transfer it almost exclusively to the earnings trend, i.e. to the changes in earnings expected in the future? The answer was, first, that the records of the past were proving an undependable guide to investment; and, second, that the rewards offered by the future had become irresistibly alluring.
Along with this idea as to what constituted the basis for common-stock selection emerged a companion theory that common stocks represented the most profitable and therefore the most desirable media for long-term investment. This gospel was based on a certain amount of research, showing that diversified lists of common stocks had regularly increased in value over stated intervals of time for many years past.
These statements sound innocent and plausible. Yet they concealed two theoretical weaknesses that could and did result in untold mischief. The first of these defects was that they abolished the fundamental distinctions between investment and speculation. The second was that they ignored the price of a stock in determining whether or not it was a desirable purchase.
The notion that the desirability of a common stock was entirely independent of its price seems incredibly absurd. Yet the new-era theory led directly to this thesis… An alluring corollary of this principle was that making money in the stock market was now the easiest thing in the world. It was only necessary to buy ‘good’ stocks, regardless of price, and then to let nature take her upward course. The results of such a doctrine could not fail to be tragic.
That enormous profits should have turned into still more colossal losses, that new theories should have been developed and later discredited, that unlimited optimism should have been succeeded by the deepest despair are all in strict accord with age-old tradition.”
– Benjamin Graham & David L. Dodd, Security Analysis, 1934
Keep Me Informed
Please enter your email address to be notified of new content, including market commentary and special updates.
Thank you for your interest in the Hussman Funds.
100% Spam-free. No list sharing. No solicitations. Opt-out anytime with one click.
By submitting this form, you consent to receive news and commentary, at no cost, from Hussman Strategic Advisors, News & Commentary, Cincinnati OH, 45246. https://www.hussmanfunds.com. You can revoke your consent to receive emails at any time by clicking the unsubscribe link at the bottom of every email. Emails are serviced by Constant Contact.
The foregoing comments represent the general investment analysis and economic views of the Advisor, and are provided solely for the purpose of information, instruction and discourse.
Prospectuses for the Hussman Strategic Growth Fund, the Hussman Strategic Total Return Fund, and the Hussman Strategic Allocation Fund, as well as Fund reports and other information, are available by clicking Prospectus & Reports under “The Funds” menu button on any page of this website.
The S&P 500 Index is a commonly recognized, capitalization-weighted index of 500 widely-held equity securities, designed to measure broad U.S. equity performance. The Bloomberg U.S. Aggregate Bond Index is made up of the Bloomberg U.S. Government/Corporate Bond Index, Mortgage-Backed Securities Index, and Asset-Backed Securities Index, including securities that are of investment grade quality or better, have at least one year to maturity, and have an outstanding par value of at least $100 million. The Bloomberg US EQ:FI 60:40 Index is designed to measure cross-asset market performance in the U.S. The index rebalances monthly to 60% equities and 40% fixed income. The equity and fixed income allocation is represented by Bloomberg U.S. Large Cap Index and Bloomberg U.S. Aggregate Index. You cannot invest directly in an index.
Estimates of prospective return and risk for equities, bonds, and other financial markets are forward-looking statements based the analysis and reasonable beliefs of Hussman Strategic Advisors. They are not a guarantee of future performance, and are not indicative of the prospective returns of any of the Hussman Funds. Actual returns may differ substantially from the estimates provided. Estimates of prospective long-term returns for the S&P 500 reflect our standard valuation methodology, focusing on the relationship between current market prices and earnings, dividends and other fundamentals, adjusted for variability over the economic cycle. Further details relating to MarketCap/GVA (the ratio of nonfinancial market capitalization to gross-value added, including estimated foreign revenues) and our Margin-Adjusted P/E (MAPE) can be found in the Market Comment Archive under the Knowledge Center tab of this website. MarketCap/GVA: Hussman 05/18/15. MAPE: Hussman 05/05/14, Hussman 09/04/17.