
Ring Out, Wild Bells

John P. Hussman, Ph.D.
President, Hussman Investment Trust
December 2024
There can be few fields of human endeavor in which history counts for so little as in the world of finance. Past experience, to the extent that it is part of memory at all, is dismissed as the primitive refuge of those who do not have the insight to appreciate the incredible wonders of the present. Only after the speculative collapse does the truth emerge.
-John Kenneth Galbraith, A Short History of Financial Euphoria, 1990
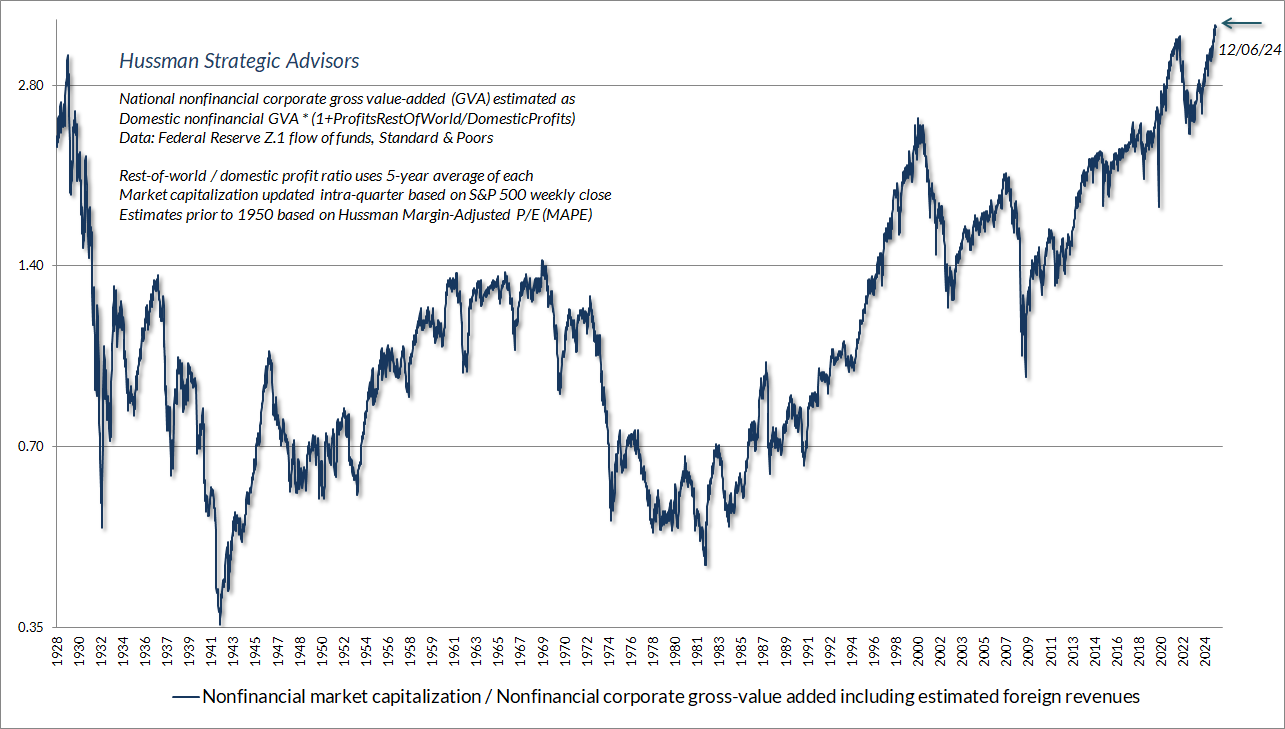
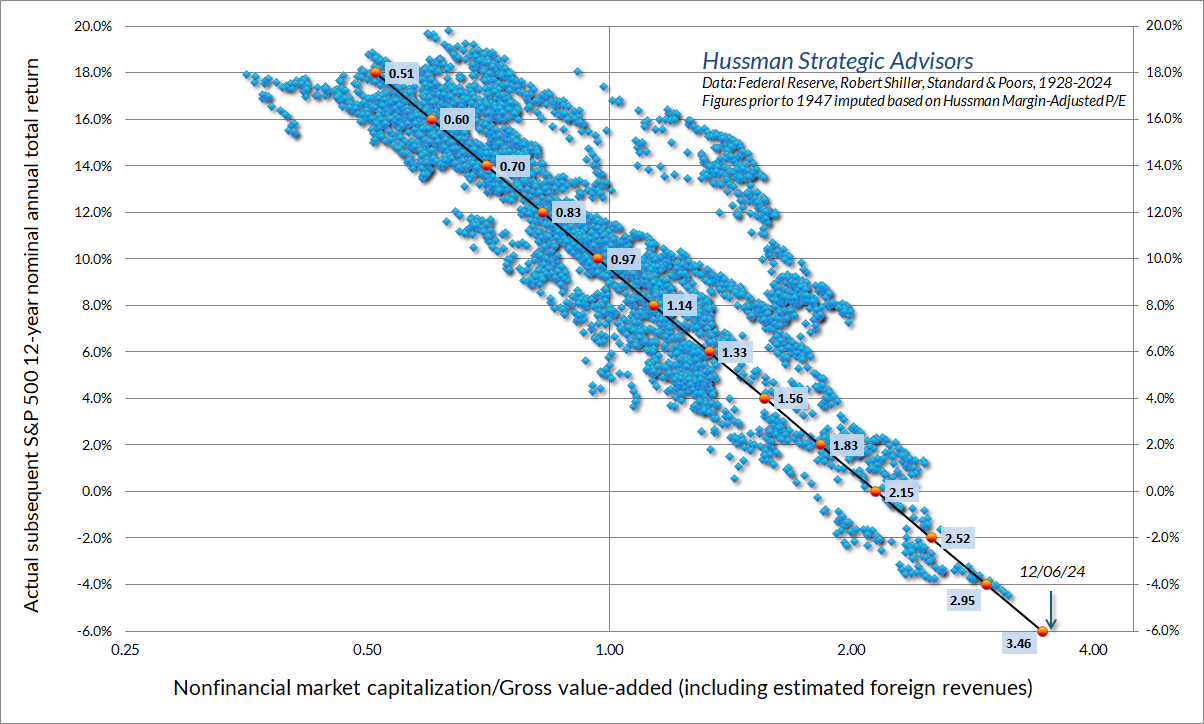
On Friday December 6th, the U.S. stock market pushed to the most extreme level of valuation in U.S. history, based on the measures that we find best-correlated with actual subsequent 10-12 year S&P 500 total returns, as well as the depth of subsequent losses over the completion of market cycles across a century of data. That’s not a forecast. Rather, it’s a statement about current, measurable, observable market conditions.
While we’ve seen an initial retreat based on concern that the Federal Reserve may lower interest rates less aggressively than hoped, record valuations leave the market vulnerable to a hundred risks, not just one. Presently, our most reliable valuation measures exceed those observed at the 1929 and 2000 peaks, and I continue to view the period since early-2022 as the extended peak of the third great speculative bubble in U.S. history.
The chart below shows our most reliable gauge of market valuations in data since 1928: the ratio of nonfinancial market capitalization to gross value-added (MarketCap/GVA). Gross value-added is the sum of corporate revenues generated incrementally at each stage of production, so MarketCap/GVA might be reasonably be viewed as an economy-wide, apples-to-apples price/revenue multiple for U.S. nonfinancial corporations.
The chart below shows the relationship between MarketCap/GVA and actual subsequent 12-year S&P 500 average annual total returns, in data since 1928.
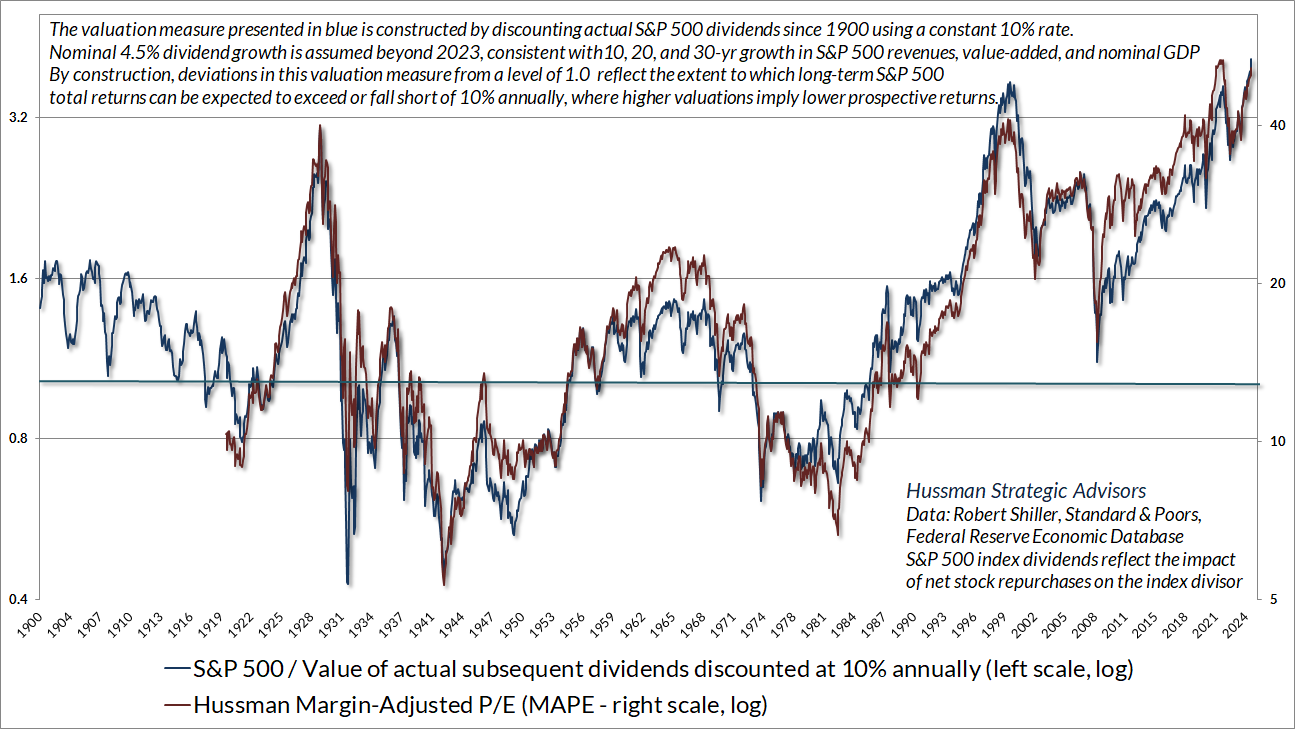
Importantly, the current valuation extreme is by no means restricted to a single measure. The chart below shows our Margin-Adjusted P/E, which considers cyclical variations in profit margins and their impact on the price/earnings ratio, along with the ratio of the S&P 500 to the present value of actual subsequent S&P 500 dividends at every point in time since 1900, discounted at a constant rate of 10% annually (see chart text for additional details). The ratio therefore estimates the extent to which likely long-term S&P 500 total returns are likely to depart from a 10% average return. The higher the valuation, the larger the expected shortfall from historically run-of-the-mill expected returns of 10%.
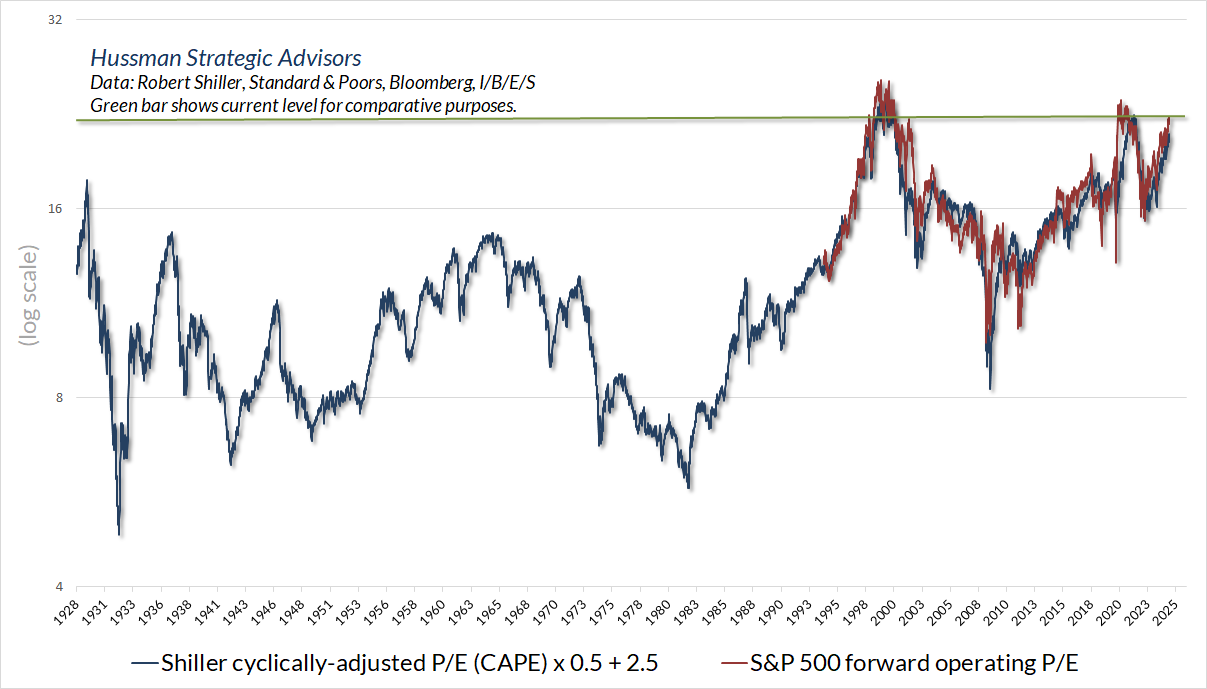
It’s tempting to imagine that our valuation perspective relies on the assumption that current profit margins are unsustainable. Yet even if one takes average profit margins over the past decade at face value (as the Shiller cyclically-adjusted P/E does), and even if one takes Wall Street’s unprecedented expectations for year-ahead profit margins as the basis for market valuation (as the S&P 500 forward operating P/E does), market valuations are presently at levels observed only surrounding the 2000 and 2022 market peaks. Indeed, given the fairly linear relationship between the forward operating P/E and the Shiller CAPE, we can get a good sense of what the forward operating P/E would have looked like on a historical basis, had data on this measure been available. Presently, valuations are easily above the 1929 extreme even on these measures.
While preparing charts for this month’s comment, I checked on an older valuation measure that I constructed decades ago. The chart below shows my original “weighted price-to-fundamental” ratio (WtdP/F), which is a composite of the S&P 500 price/peak-earnings multiple that I created back in 1998 (Alan Abelson of Barron’s wrote a nice article on it back then), along with scaled price/revenue, price/dividend, and price/book multiples for the S&P 500. It should not be a surprise that the WtdP/F is also at record extremes.
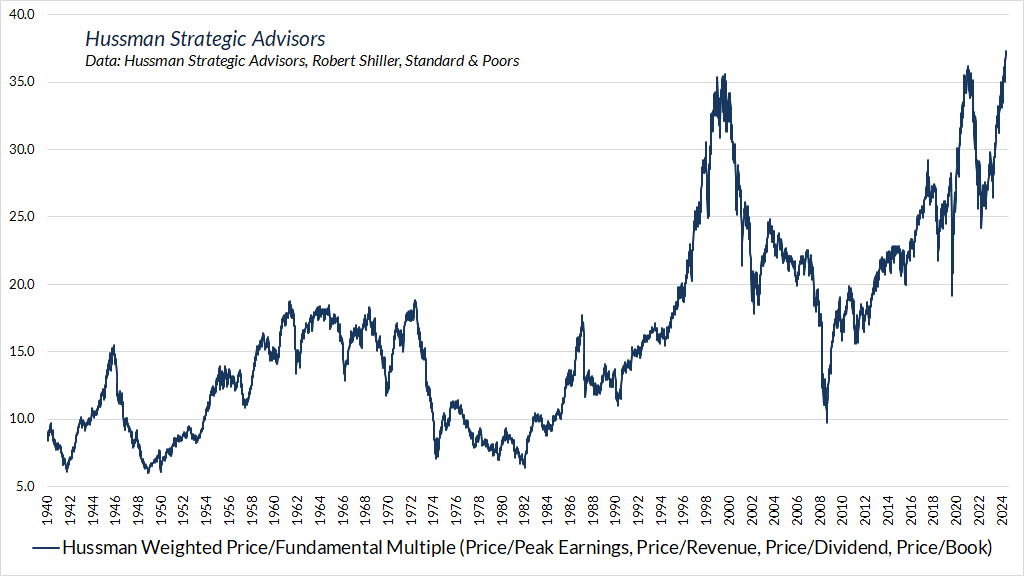
A key feature of the bubble period since 1995 is that average valuations have been substantially above their long-term historical norms. That observation makes it tempting to assume that valuations have simply “shifted” higher. As Graham and Dodd described this temptation in 1932, “the conclusion to be drawn was not that the stock was now too high but merely that the standard of value had been raised. Instead of judging the market price by established standards of value, the new era based its standards of value upon the market price.”
On this point, it’s important to recognize that there’s a remarkably stable mapping between the level of reliable valuation measures and the level of subsequent annual returns. For any given set of future expected cash flows, higher valuations imply lower returns, and lower valuations imply higher returns. For the WtdP/F, a level of about 15 has historically been associated with run-of-the-mill subsequent S&P 500 nominal total returns averaging about 10% annually. When valuations have been higher, subsequent returns have been systematically lower. Put simply, saying “the standard of valuation has been raised” is identical to saying “the likely level of future returns has been lowered.”
The chart below shows how our Weighted P/F ratio is related to actual subsequent 10-year S&P 500 average annual total returns.
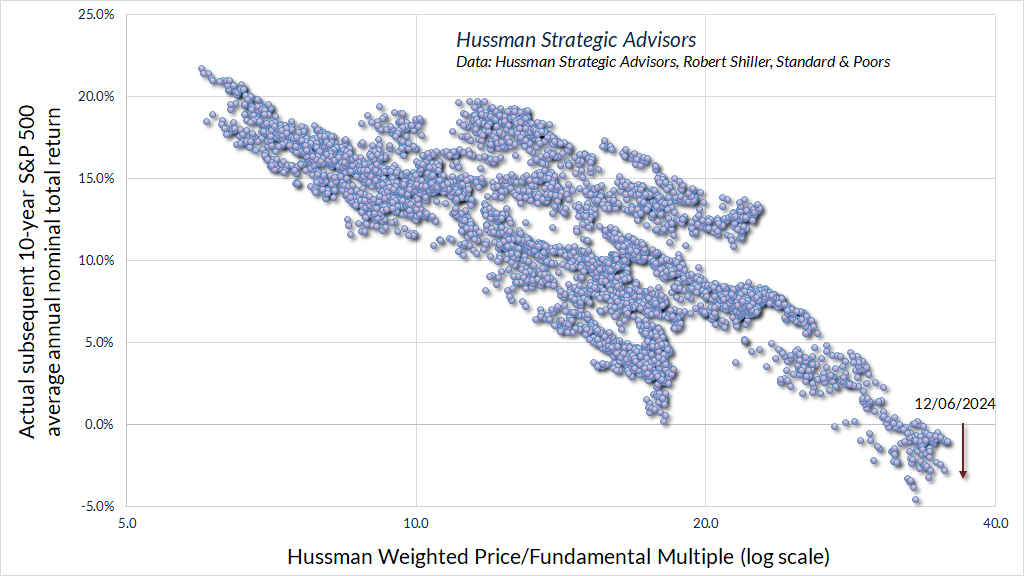
For more on the mapping between valuations and subsequent market returns, see my August 2022 comment, The Structural Drivers of Investment Returns.
Saying ‘the standard of valuation has been raised’ is identical to saying ‘the likely level of future returns has been lowered.’
Here’s the same data presented as a line chart.
Notice that “errors” between actual returns and what would be expected based on initial valuations are almost always a reflection of extreme valuations at the end of the 10-year investment horizon. For example, why did actual returns fall short of expectations in the 10-year investment periods that began between 1964 and 1972? The answer is that the market had plunged to secular valuation lows by the end of those 10-year horizons (between 1974 and 1982). Likewise, why did actual market returns overshoot expectations in the decades that followed 1988-1990 and 2008-2012? The answer is that valuations had reached bubble extremes at the end of those 10-year horizons (1998-2000, 2018-2022).
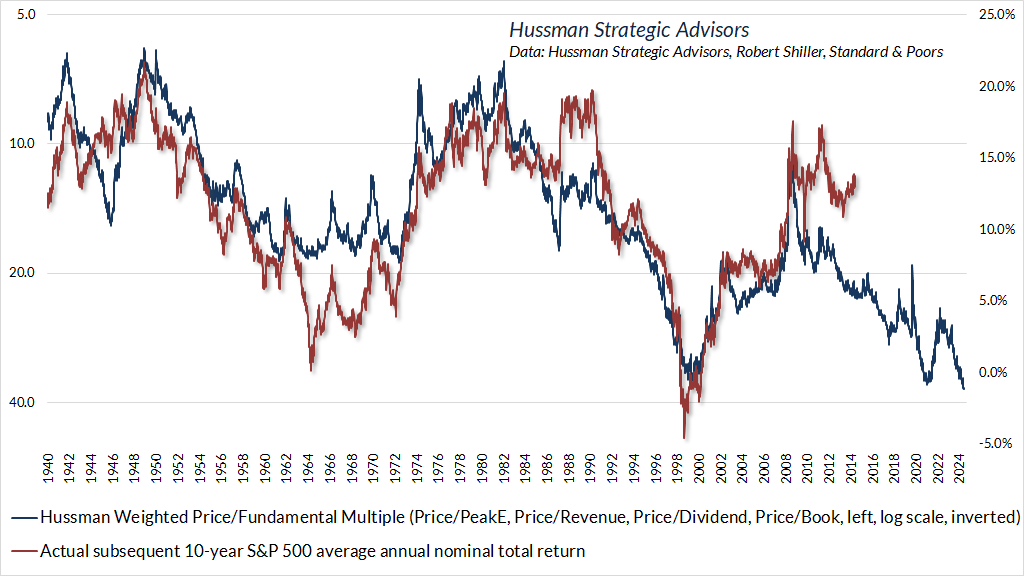
Yet just as large and observable negative “errors” in the 10-year investment periods ending between 1974 and 1982 offered information that valuations had reached untenable lows, and were likely to be followed by outstanding future returns, the large and observable positive “error” in recent years offers information that valuations have likely reached untenable highs, and may be followed by profoundly disappointing returns, as they were in the decade that followed the 1998-2000 extremes.
New eras provide durable benefits to consumers, not durably extreme profitability
The ‘new era’ commencing in 1927 involved at bottom the abandonment of the analytical approach; and while emphasis was still seemingly placed on facts and figures, these were manipulated by a sort of pseudo-analysis to support the delusions of the period. The ‘new-era’ doctrine – that ‘good’ stocks (or ‘blue chips’) were sound investments regardless of how high the price paid for them – was at bottom only a means for rationalizing under the title of ‘investment’ the well-nigh universal capitulation to the gambling fever.
– Benjamin Graham & David L. Dodd, Security Analysis, 1934
My latest OpEd in the Financial Times – New Eras, Same Bubbles: The Forgotten Lessons of History – discusses the “new era” thinking that recurrently surrounds valuation extremes like the one we see at present. For our current purposes, it’s enough to repeat that despite all the society-changing innovations of the past two decades, real GDP growth has averaged just 2.1% annually, a fraction of the growth observed over the preceding half-century. Without robust growth in the U.S. population and labor force, even a resumption of productivity growth to levels observed from 1950-2000 would boost real GDP growth by only about 0.5% annually. Combine this with the fact that real GDP currently stands about 2.6% above estimated potential GDP growth, as is typical in late-stage expansions prior to recession, and the result is a baseline estimate for real GDP growth over the coming 4-year period of only about 1.5% annually.
We’ve done enough examination of growth trajectories, profit margins, and the drivers of economic growth and investment returns in prior comments that none of this should be surprising.
For much more on likely baseline U.S. GDP growth, see the section in the November comment titled “On the structural drivers and prospects for U.S. economic growth”
For much more on both mega cap stocks and profit margins, see Universal Capitulation and No Margin of Safety. With respect to “new era” thinking, one of the important facts covered in that comment is that despite cyclical fluctuations, the median profit margin of the largest S&P 500 components hasn’t shifted materially in recent decades, relative to the median profit margin of all S&P 500 components. Another fact is that nonfinancial profit margins before interest and taxes have been largely unchanged for 70 years – the increase in net profit margins is actually due to reductions in corporate tax rates (where most of the impact on profit margins was in place by the early 1980’s) and falling interest rates.
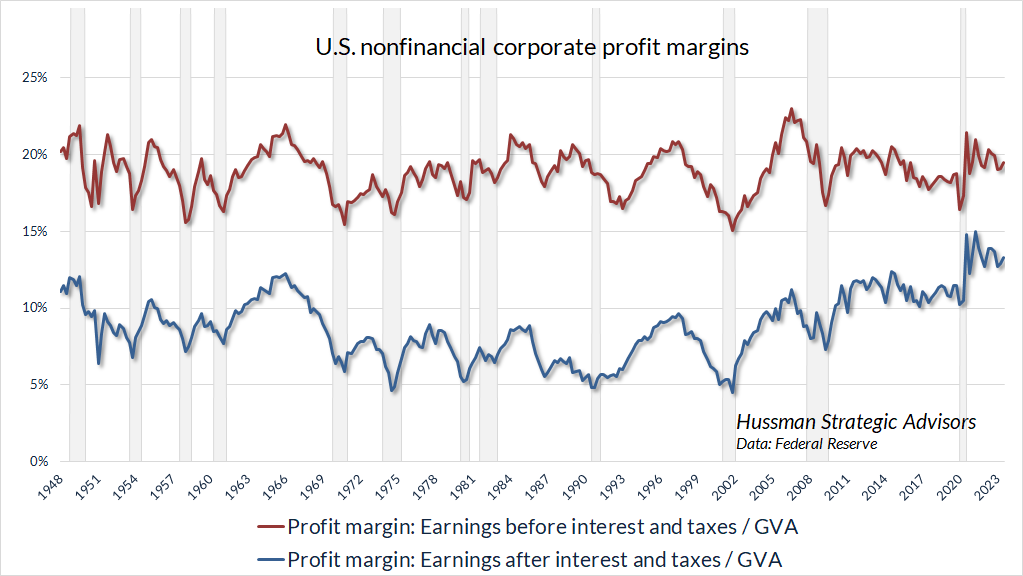
Indeed, interest expense as a share of nonfinancial corporate gross value added has plunged since 1990. The upshot here is that most of the expansion in after-tax profit margins and S&P 500 operating margins in recent decades has been driven not by technological shifts, but by falling interest rates – which were temporarily locked-in during 2020-2021.
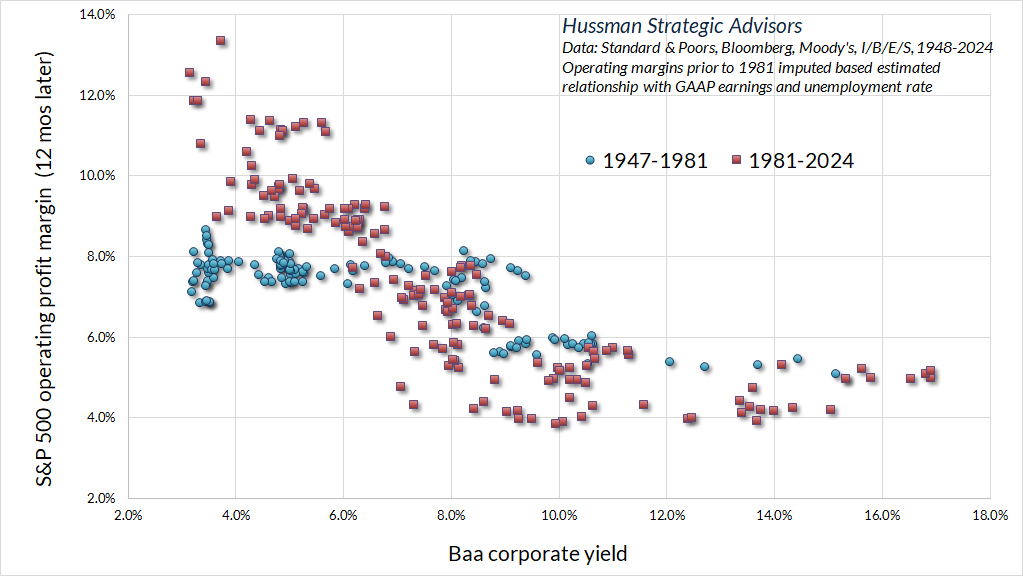
For much more on valuation measures, the long- and shorter-term drivers of investment returns, and their mapping to actual subsequent market returns, see The Structural Drivers of Investment Returns, particularly the section with the same title, and the section that follows, titled “You may not like this part.”
As for the present episode of “new era” thinking, the fact is that while the newest, most innovative layer of the economy is nearly always the most profitable, both the profit margins and the growth rates erode as markets expand. As that happens, a great deal of the “surplus” initially observed as profit becomes non-monetary “consumer surplus” – benefit to individuals in the form of convenience, utility, improved customer experience, new forms of activity, and other intangibles that may be reflected to some extent in productivity figures, but don’t cause a wholesale change in the way that economics work.
As a useful but slightly dramatic illustration, think of commercial aviation. The very idea that people would be able to buy tickets and fly from place to place for vacations, family visits, and business was incomprehensible before the Wright brothers achieved flight in 1903. Yet the U.S. airline industry, in aggregate, has actually lost money over the past century. Yes, individual companies have profited in various time periods, but as Warren Buffet famously said, “If a capitalist had been present at Kitty Hawk, he should have shot Orville Wright.”
Whatever “innovation-led” bubble we choose to examine, the result is the same. The bubbles collapse, the innovations create a new and useful layer of economic activity, the early profits erode, and most of the benefits ultimately accrue as consumer surplus. Speculators screaming “this time is different!” are begging to be steamrolled by their own disregard for economic history.
This is the longest period of practically uninterrupted rise in security prices in our history… The psychological illusion upon which it is based, though not essentially new, has been stronger and more widespread than has ever been the case in this country in the past. This illusion is summed up in the phrase ‘the new era.’ The phrase itself is not new. Every period of speculation rediscovers it… During every preceding period of stock speculation and subsequent collapse business conditions have been discussed in the same unrealistic fashion as in recent years. There has been the same widespread idea that in some miraculous way, endlessly elaborated but never actually defined, the fundamental conditions and requirements of progress and prosperity have changed, that old economic principles have been abrogated… that business profits are destined to grow faster and without limit, and that the expansion of credit can have no end.
– The Business Week, November 2, 1929
Ring out, wild bells
The total return of the S&P 500 is about 5.5% ahead of T-bills since we published our June comment You Can Ring My Bell. That June piece was motivated by the combination of extreme valuations, unfavorable market internals, and a preponderance of overextended syndromes that typically resolve into steep market losses. Most of the incremental gain has been since early November, on considerations that Wall Street appears to view with favor. I share no such view, but save for the nod to Tennyson, futile for the moment, my discretion in withholding comment is probably the better part of valor.
With recent speculation restoring the preponderance of overextended extremes we saw in June, my impression is that their typically negative consequences have not been avoided, only deferred.
By the time the market reaches bubble extremes, valuations are widely considered to be useless. The only way that valuations could reach levels like 1929, 2000, and today was by pushing beyond every lesser extreme. Explaining why investors abandoned any concern about valuations in 1929, to their eventual ruin, Benjamin Graham wrote “The answer was, first, that the records of the past were proving an undependable guide to investment; and, second, that the rewards offered by the future had become irresistibly alluring.”
Still, even if one expects a bubble to collapse, the bubble itself must be dealt with. While valuations are extremely informative about long-term returns and full-cycle downside risk, it’s important to combine valuations with other measures to gauge market conditions over shorter segments of the market cycle. In our own discipline, we use the uniformity or divergence of market internals across thousands of stocks, industries, sectors, and security types to gauge the extent to which investor psychology leans toward speculation or risk-aversion, and we monitor scores of “syndromes” that gauge the extent to which shorter-term market action is overextended or compressed.
Attention to market internals can be enormously helpful in navigating bubble periods. I’ve detailed at length why we encountered difficulty amid the speculation that followed the market collapse of the global financial crisis, largely as the inadvertent consequence of “ensemble” methods I introduced as a stress-testing response to that collapse (which we fully anticipated) – see the second section of the June comment for a full discussion. We finally abandoned the ensemble implementation in 2021. The main force of the adaptations we’ve made is to prioritize the status of market internals, to the extent that we expect to adopt a constructive market outlook in well over 90% of periods when our key gauge of internals is favorable.
The chart below presents the cumulative total return of the S&P 500 in periods where our main gauge of market internals has been favorable, accruing Treasury bill interest otherwise. The chart is historical, does not represent any investment portfolio, does not reflect valuations or other features of our investment approach, and is not an assurance of future outcomes.
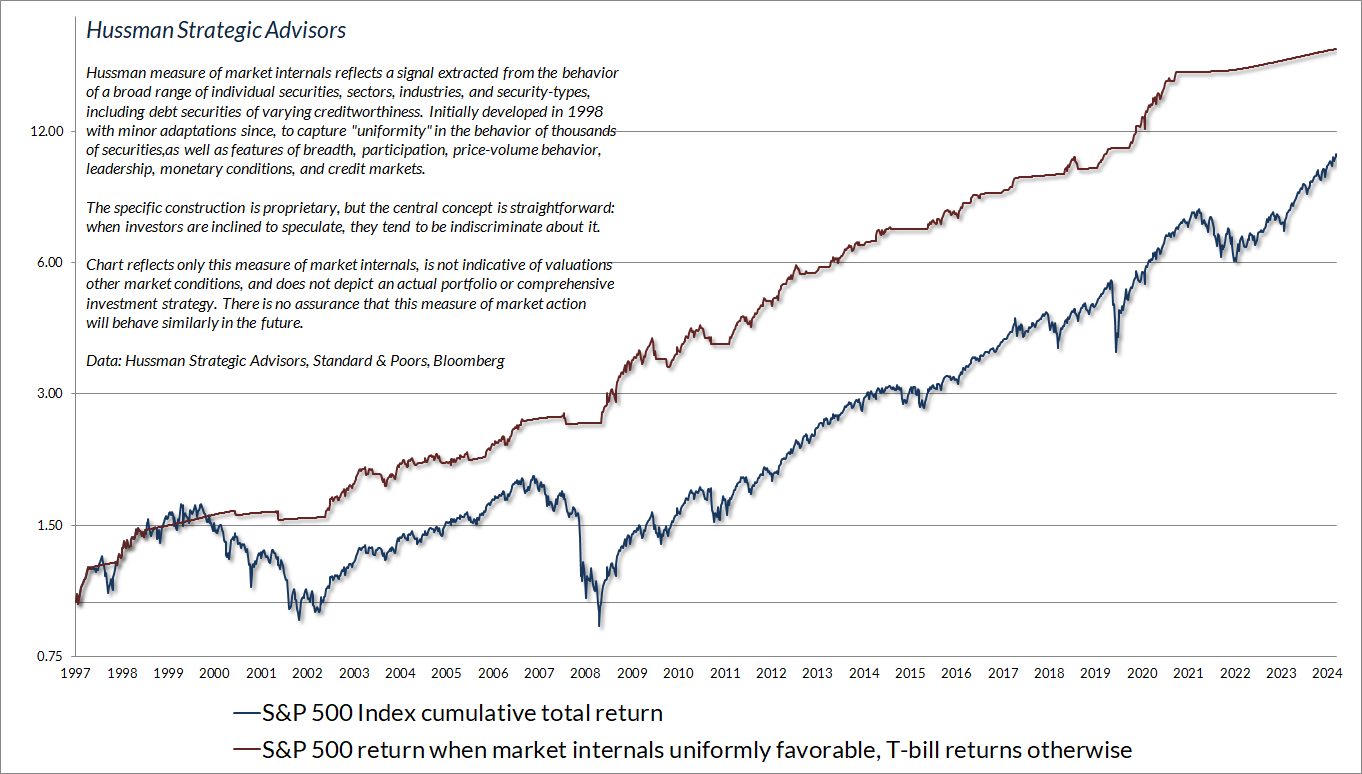
Largely because of tepid broad market behavior in the period since early-2022, our gauge of market internals has remained persistently unfavorable even during the recent market advance. Because investors have so disproportionately favored mega-cap stocks, the cumulative total returns of both the equal-weighted S&P 500 and the Russell 2000 Index are actually behind Treasury-bill returns for the full period since early-2022.
For much of the past year, my research efforts were focused on the attempt to identify some omitted variable that could “jimmy” internals positive, from twists on already-captured factors like central bank liquidity, small/large/mega-cap performance, trend-following measures, and macro factors, to a hundred sophisticated candidate variables. By September, it became clear that it was the wrong question to ask how we might cleverly “force” internals to measure what they were not designed to measure, in order to dart between a defensive outlook and a bullish one amid historically ominous market conditions. Every MacGyver-like adaptation that might “improve” the performance of internals over past year resulted in deteriorated performance across history.
Asking a better question provided immediate clarity and led to a profoundly useful hedging implementation. The right question began by accepting the unfavorable status of internals as valid, and instead asking how we might vary the intensity of a valid defensive outlook, in a manner that could be expected to benefit even in a further advance, provided only that the market fluctuates along the way. Having worked as an options mathematician at the Chicago Board of Trade in the late-1980’s, the solution was something of a Eureka moment. It’s been rather difficult to suppress my enthusiasm about it since then, because it turns out that the approach generalizes to both defensive and constructive market conditions.
For more on this and other adaptations, and how they fit together, and the basis for my enthusiasm – regardless of market direction – see the section titled “The Martian” in the November comment, The Turtle and the Pendulum.
In September, we introduced that new hedging implementation, giving us an additional dimension of flexibility in the intensity of our investment outlook – whether positive or negative – even in periods when gauges like valuations and market internals aren’t changing much. Given that the stock market has been pushing along its upper Bollinger band (2 standard deviations above its 20-period average) at daily, weekly and monthly resolutions since September, this adaptation isn’t very evident yet. Still, I expect our discipline to feel materially more comfortable and less “combative” in the coming weeks and months, even if our outlook remains generally defensive, and even if the bubble continues and valuations never retreat (which I view as unlikely). Emphatically, we don’t need a market collapse. Reasonably normal levels of short-term market variation should be enough.
Once a “trap door” of rich valuations and unfavorable market internals opens, our attention moves to overextended conditions and related syndromes. Over the past four decades, I’ve developed and collected scores of interesting syndromes and relationships that tend to occur at market extremes. I often discuss using terms like “overextension,” “dispersion,” and “reversal.” Having grown up as the son of two medical doctors, I use “syndrome” to describe a combination of observable features that can be associated with a specific outcome. There are certain features of valuation, investor psychology, and price behavior that emerge, to one degree or another, when the fear of missing out becomes particularly extreme and the focus of speculation becomes particularly narrow.
The chart below updates the tally of overextension syndromes we observe in weekly data.
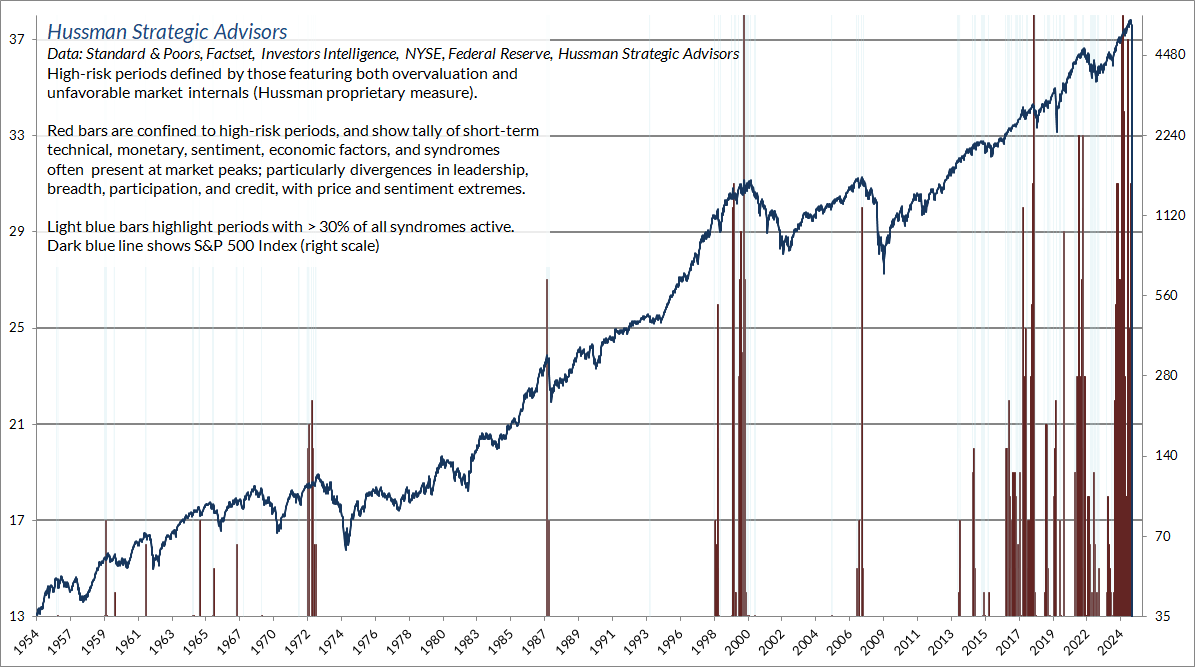
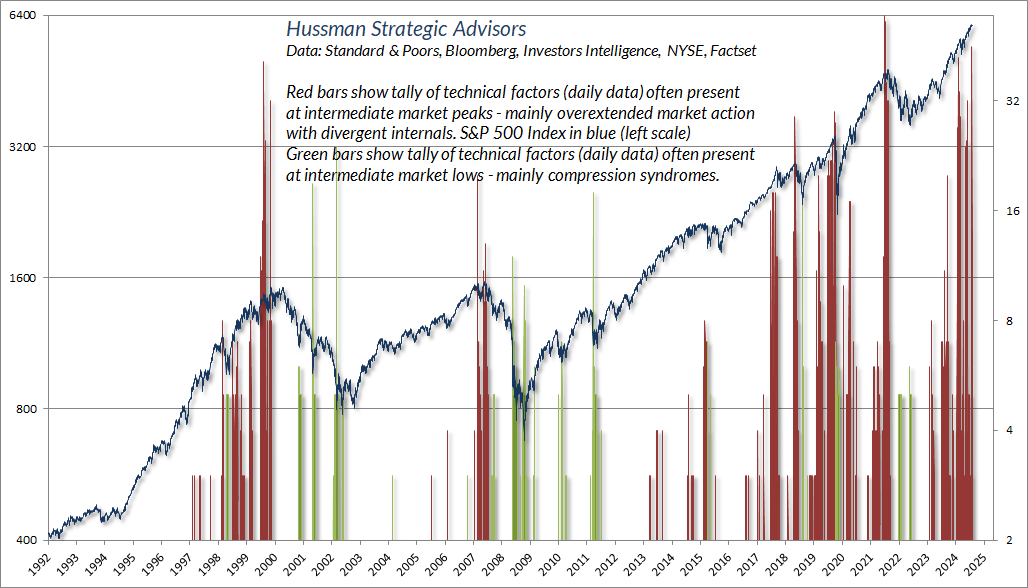
On Monday, December 16, we observed an explosion of these warning syndromes in daily data, driven by a fairly rare combination of internal divergences, leadership reversal, lopsided bullish sentiment, extreme valuations, aggressive call option speculation, and a wide range of other factors. As I wrote in July 2007, just before the global financial crisis “I’ve noted over the years that substantial market declines are often preceded by a combination of internal dispersion, where the market simultaneously registers a relatively large number of new highs and new lows among individual stocks, and a leadership reversal, where the statistics shift from a majority of new highs to a majority of new lows within a small number of trading sessions.”
The red bars in the chart below show our tally of daily “overextension” syndromes. The green bars show what I’ve often described as “compression” syndromes, which are often followed by very rapid short-term advances. Those opportunities are certainly something we can look forward to, even if the present moment offers better opportunities on the risk-management side.
Defining bubbles and crashes
The greed itch begins when you see stocks move that you don’t own. Then friends of yours have a stock that has doubled; or if you have one that has doubled, they have one that has tripled. This is what produces bull market tops. Obviously no one rationally would want to buy at the top, and yet enough people do to produce a top. It is really quite amazing how time horizons and money goals can change when there are stocks around that are going up 100 percent in six months. Finally it all turns into a marvelous carmagnole that is great fun if you leave the party early.”
– Adam Smith (GJW Goodman), The Money Game, 1967
A recent opinion in the Financial Times asked “Is it possible to be in an equity market bubble when near-record amounts of capital are flowing into cash? I’m not sure it is. One definition of a stock market crash is a bull market for cash.”
If I’ve done my job over time, you already know why the phrase “flowing into cash” is incoherent. If not, the section titled “There are no Sidelines” in the August comment will get you there. The short answer is that every dollar of base money created by the Fed, every Treasury bill issued by the Treasury, must be held by someone at every moment in time until the liabilities are retired. The “cash” can change hands, but it’s not coming “off the sidelines” because there are no “sidelines.” The precise moment a buyer puts the cash “into” the stock market, a seller takes it “out.” Even bank lending doesn’t create more cash. It creates new liabilities called “bank loans” that memorialize the fact that funds have been intermediated. The cash that previously backed a deposit liability goes to the borrower’s bank, and the deposit liability is now backed by the loan.
It’s a bit distressing that professionals who advise and write about the financial markets don’t recognize that in equilibrium, every security that has been issued (including “cash”) must be held by someone. Meanwhile, the aphorism that “a market crash is a bull market for cash” is a statement about the price of cash in terms of stocks – specifically, as stock prices plunge, one needs more stock to “buy” one dollar of cash.
We’re going to continue to hear lots of noise about “cash on the sidelines,” so it’s important to remember that the cash is there because the Fed put it there. The same is true for cash-equivalents like T-bills that the Treasury has issued to finance government deficits. All that “cash” isn’t going away, or “into” something else. It can only be itself. Presently most of it is earning about 4.3%. I’ve demonstrated in prior comments that even when cash and equivalents earn nothing, their capacity to “support” stocks relies on the presence of speculative psychology, which is best gauged by the uniformity of market internals. Nothing about this “sideline cash” or “liquidity” does anything to prevent a market collapse save for speculative psychology. That’s how the market could collapse during 2000-2002 and 2007-2009 even as the Federal Reserve eased aggressively the whole way down.
Amid all the definitions of bubbles and crashes swirling around, it’s useful to remember that there is actually a mathematically precise way to describe a bubble:
What defines a bubble is that investors drive valuations higher without simultaneously adjusting expectations for returns lower. That is, investors extrapolate past returns based on price behavior, even though those expectations are inconsistent with the returns that would equate price with discounted cash flows. The defining feature of a bubble is inconsistency between expected returns based on price behavior and expected returns based on valuations.
John P. Hussman, Ph.D., How to Spot a Bubble, March 2021
When one juxtaposes the most extreme valuations in U.S. history with among the most extreme levels of bullish investor sentiment on record, the conclusion is nearly inescapable. The chart below shows the percentage of respondents surveyed by the Conference Board who believe that the stock market will be higher 12 months from today – a reasonable proxy for “extrapolative” expectations. The current level of bullish sentiment is easily the most extreme in the history of this survey.
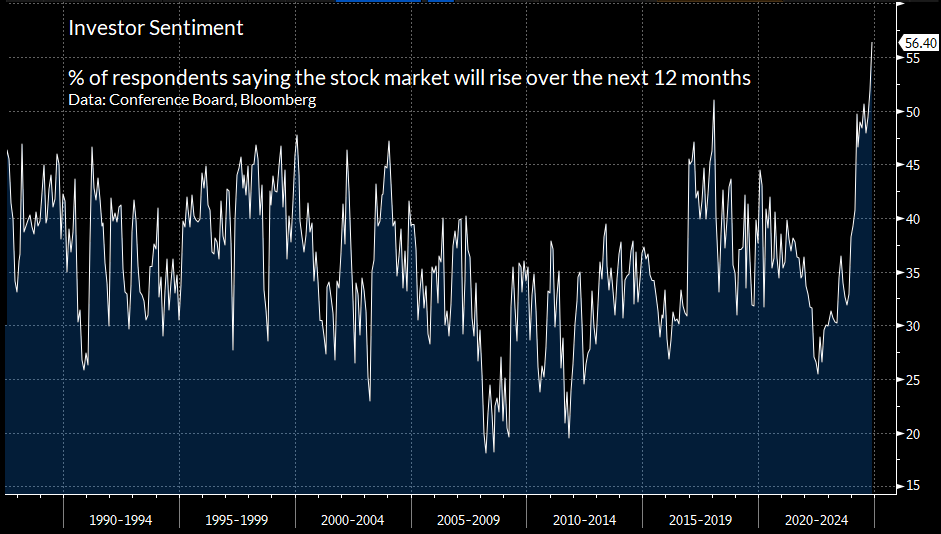
Put simply, investors are relying on everything to go in their favor and are demanding the lowest compensation on record for the risks they are taking.
To get a sense of what I mean by “inconsistency between expected returns based on price behavior and expected returns based on valuations,” recent surveys by Natixis found that U.S. investors expect their investments to return 15.6% above inflation over the long-term, and even U.S. investment professionals believe that 7.1% is realistic. As a quick reality check, the chart below shows our Weighted Price/Fundamental measure in data since 1940, versus actual subsequent 10-year real, after-inflation total returns for the S&P 500. There’s a lot of disappointment baked into the expectation of 7.1% – 15.6% long-term real returns.
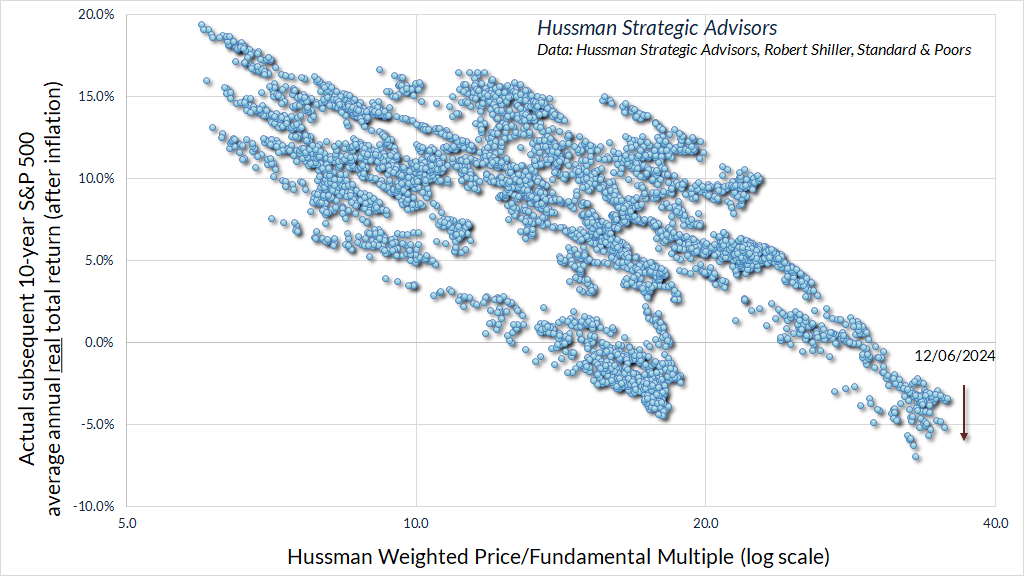
Between the optimistic extremes in investor expectations for future returns, and valuations implying precisely the opposite, there is an enormous bubble in the gap, hiding in plain sight.
I’ve often described a market crash as “risk-aversion meeting a market that is not adequately priced to tolerate risk.” That perspective may be particularly relevant given that prevailing S&P 500 valuations and Treasury yields easily imply the most negative estimated risk-premium in history, based on estimates that are tightly correlated with actual subsequent S&P 500 total returns in excess of Treasury returns across a century of data – and there are lots of estimates that have little or no such reliability.
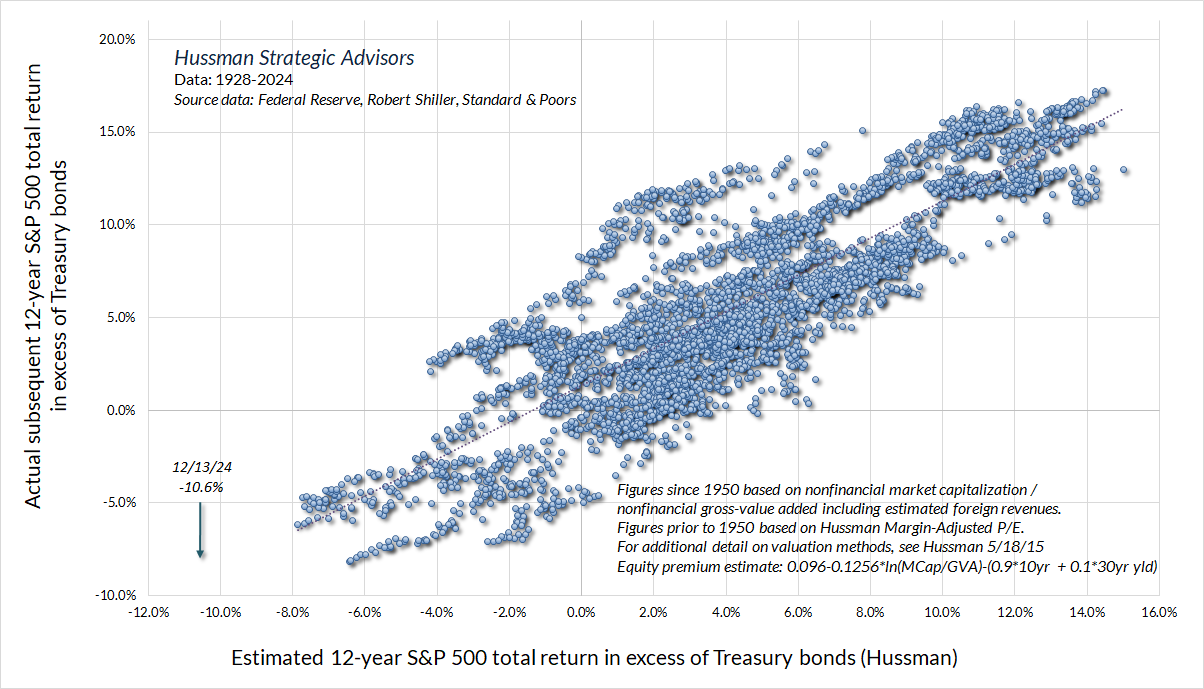
Apollo Global Management notes that a record low percentage of investors believe there is even a 10% risk of a market crash over the coming six months, and credit spreads on both Baa and junk corporate debt are scraping the lowest levels in history. Put simply, investors are relying on everything to go in their favor and are demanding the lowest compensation on record for the risks they are taking.
Interest rates, precious metals, and economic prospects
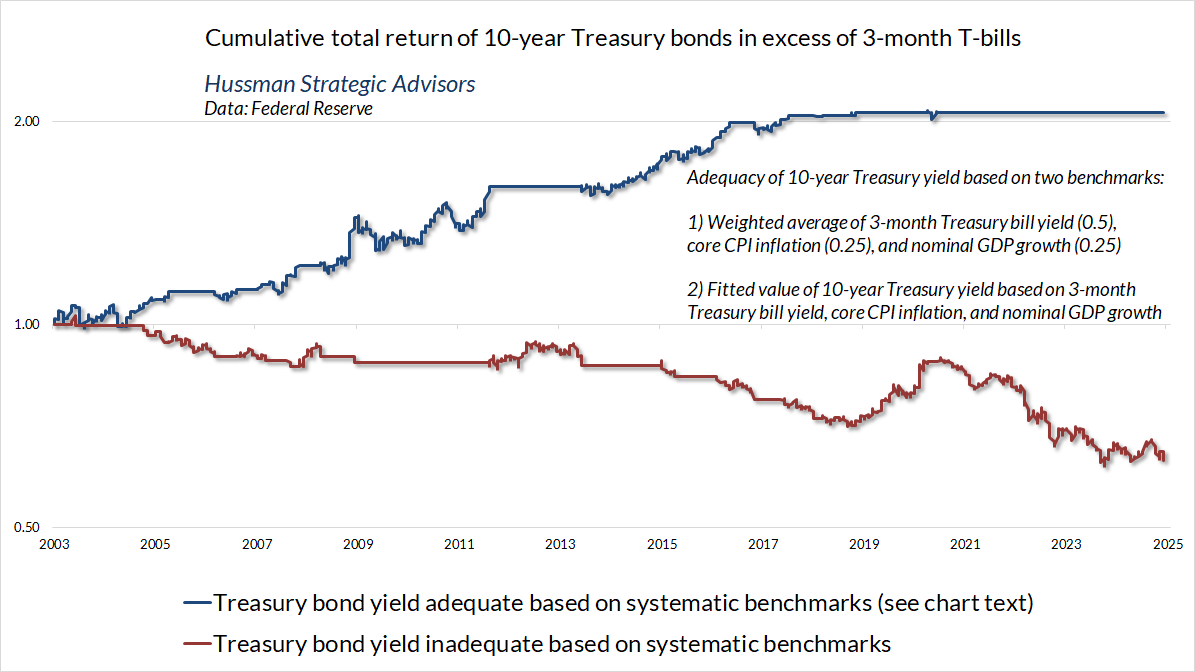
On the interest rate front, the yield on 10-year Treasury bonds is finally at a level that we view as “adequate” relative to simple benchmarks that have historically been an effective guide to investment.
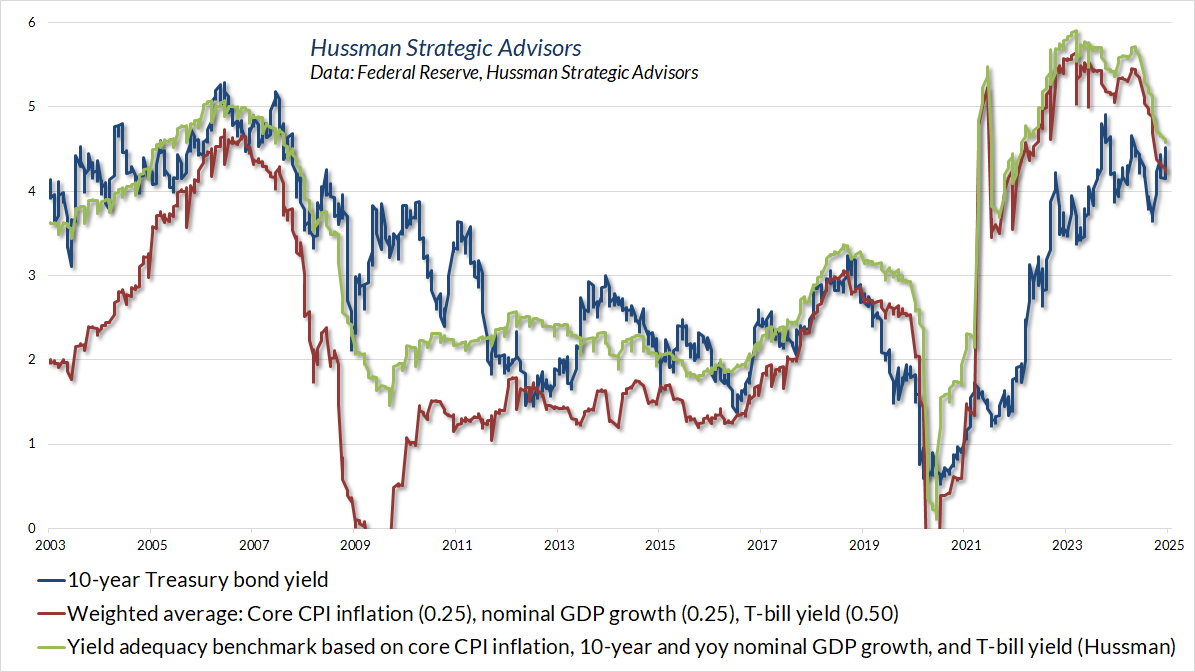
The chart below shows the total return of 10-year Treasury bonds over-and-above T-bill returns based on yield adequacy, as gauged by the benchmarks above.
In contrast to the freshly constructive market conditions we view in the bond market (finally), we became rather defensive toward precious metals in recent weeks, largely due to the combination of upward pressure on nominal and real interest rates, along with a broader set of valuation and economic conditions. For now, our view toward precious metals stocks is very restrained, but as always, that will change with market conditions.
On the economic front, despite some surface resilience in various measures like non-farm payrolls and initial unemployment claims, we continue to estimate “structural” GDP growth (demographic labor force growth plus productivity growth) at just 2% annually. As I noted last month, given that the current level of real GDP is also about 2.6% beyond estimated potential, as is common late in economic expansions, our baseline expectation for 4-year real GDP growth is only about 1.5% annually, and even a full resumption of pre-2000 productivity trends would bump that estimate to just 2% annually.
Whatever ‘innovation-led’ bubble we choose to examine, the result is the same. The bubbles collapse, the innovations create a new and useful layer of economic activity, the early profits erode, and most of the benefits ultimately accrue as consumer surplus. Speculators screaming ‘this time is different!’ are begging to be steamrolled by their own disregard for economic history.
Meanwhile, as I’ve noted regularly in recent months, we observe deterioration in leading measures of economic activity despite the surface appearance of strength. As discussed at greater length in the November comment, I’ve always observed that recessions are first and foremost periods when a mismatch emerges between what the economy has been producing, and what the economy now demands. Those mismatches can be driven by shifts in consumer preferences, interest-sensitive investment, technology, government spending, credit strains, or crises like the pandemic. Disruptions triggered by these mismatches take time to resolve, absent massive bailouts and deficit spending. My impression is that we may experience more than a bit of mismatch and disruption in the next few years.
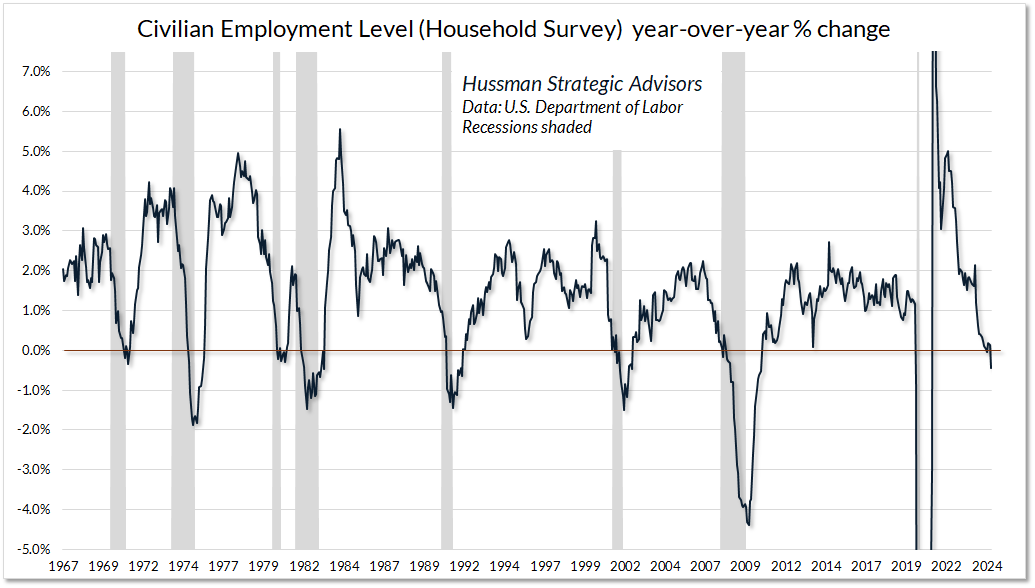
Even here, it’s notable that nearly nobody has picked up on the deterioration in civilian employment growth, which has already gone negative on a year-over-year basis. Civilian employment is part of the “household survey” that determines the unemployment rate, as opposed to the “establishment survey” that provides the headline month-to-month “non-farm payroll” figure. Given our emphasis on signal extraction and noise reduction, our preference is always to extract the common signal from a very broad range of independent or partially correlated sensors. In my view, we would still need more evidence to expect a recession with confidence, but we certainly shouldn’t rule out that outcome even in response to the possibly sizeable disruptions that may be just ahead.
Wishing you wonderful holidays – a Merry Christmas, a bright Hanukkah, a joyful Kwanzaa, a happy New Year, and whatever your traditions – amidst it all – wishing you peace, kindness, compassion, hope, and light. The world needs those things in all of us. – John
Keep Me Informed
Please enter your email address to be notified of new content, including market commentary and special updates.
Thank you for your interest in the Hussman Funds.
100% Spam-free. No list sharing. No solicitations. Opt-out anytime with one click.
By submitting this form, you consent to receive news and commentary, at no cost, from Hussman Strategic Advisors, News & Commentary, Cincinnati OH, 45246. https://www.hussmanfunds.com. You can revoke your consent to receive emails at any time by clicking the unsubscribe link at the bottom of every email. Emails are serviced by Constant Contact.
The foregoing comments represent the general investment analysis and economic views of the Advisor, and are provided solely for the purpose of information, instruction and discourse.
Prospectuses for the Hussman Strategic Market Cycle Fund, the Hussman Strategic Total Return Fund, and the Hussman Strategic Allocation Fund, as well as Fund reports and other information, are available by clicking Prospectus & Reports under “The Funds” menu button on any page of this website.
The S&P 500 Index is a commonly recognized, capitalization-weighted index of 500 widely-held equity securities, designed to measure broad U.S. equity performance. The Bloomberg U.S. Aggregate Bond Index is made up of the Bloomberg U.S. Government/Corporate Bond Index, Mortgage-Backed Securities Index, and Asset-Backed Securities Index, including securities that are of investment grade quality or better, have at least one year to maturity, and have an outstanding par value of at least $100 million. The Bloomberg US EQ:FI 60:40 Index is designed to measure cross-asset market performance in the U.S. The index rebalances monthly to 60% equities and 40% fixed income. The equity and fixed income allocation is represented by Bloomberg U.S. Large Cap Index and Bloomberg U.S. Aggregate Index. You cannot invest directly in an index.
Estimates of prospective return and risk for equities, bonds, and other financial markets are forward-looking statements based the analysis and reasonable beliefs of Hussman Strategic Advisors. They are not a guarantee of future performance, and are not indicative of the prospective returns of any of the Hussman Funds. Actual returns may differ substantially from the estimates provided. Estimates of prospective long-term returns for the S&P 500 reflect our standard valuation methodology, focusing on the relationship between current market prices and earnings, dividends and other fundamentals, adjusted for variability over the economic cycle. Further details relating to MarketCap/GVA (the ratio of nonfinancial market capitalization to gross-value added, including estimated foreign revenues) and our Margin-Adjusted P/E (MAPE) can be found in the Market Comment Archive under the Knowledge Center tab of this website. MarketCap/GVA: Hussman 05/18/15. MAPE: Hussman 05/05/14, Hussman 09/04/17.

