
Humpty Dumpty Was Pushed

John P. Hussman, Ph.D.
President, Hussman Investment Trust
April 2025
The U.S. economy and financial markets rest on a house of cards. The faith in a New Era is exemplified by a recent advertisement from Robertson Stephens, which asks “Do you really believe that technology can make hundreds of years of economic rules obsolete? So do we.” Well, count us out. One of the most devastatingly accurate of these economic rules is this: anytime the term “New Era” becomes widely accepted, get the hell out of the stock market.
The most reliable leading indicators have moved to a clear warning of U.S. recession. This signal includes our own composite of leading indicators (credit spreads, maturity spreads, S&P 500, and NAPM Purchasing Managers Index), as well as reliable confirming indicators such as housing starts and real liquidity growth. Our investment position does not require a recession to be effective, and we do hope that these warnings are incorrect. In a stock market priced for rapid earnings growth and economic perfection, the downside risk will be extreme even if this economic slowing stops short of an actual contraction.
– John P. Hussman, Ph.D., Hussman Investment Research & Insight, November 15, 2000
The technology-heavy Nasdaq 100 index was already -36% below its March 2000 peak. It would go on to lose another -74% of its value by October 2002, for a cumulative loss of -83%
In recent months, I’ve repeatedly noted that while recession risks were gradually increasing, there was not sufficient evidence to expect an imminent economic downturn. Most economists still believe this. On Saturday, the consensus of economists surveyed by Blue Chip Economic Indicators indicated expectations that growth will be sluggish into next year, but that there will be no recession. Unfortunately, the economic consensus has never accurately anticipated a recession. For my part, the outlook has changed. I expect that a U.S. economic recession is immediately ahead.
This conclusion is based on the combined weight of several classes of indicators, including asset prices, reliable survey measures, and measures of labor market activity. One way to understand this change in outlook is to examine our 4-indicator “rule of thumb” – a simple composite of readily obtainable indicators that have been observed in every U.S. recession. It is a syndrome of conditions that are logically and historically related to economic weakness, none particularly informative when observed individually, but important when they occur together.
They are: widening credit spreads, a moderate or flat yield curve, falling stock prices, and a weak ISM Purchasing Managers Index. Notice that we are not interested in the behavior of any single indicator, but rather in a group of indicators that collectively indicate deteriorating growth expectations and rising credit risks.
– John P. Hussman, Ph.D., Expecting a Recession, November 12, 2007
In recent years, our most reliable measures of stock market valuation have pushed beyond their 1929 and 2000 peaks, and I’ve described the period since early 2022 as the extended peak of the third great speculative bubble in U.S. history. In my view, that process is now complete. The stock market faces severe downside risk ahead, and the U.S. is constrained in the unsystematic monetary and fiscal expansion that both amplified that bubble and fueled record but wholly impermanent corporate profit margins. Meanwhile, the U.S. economy now faces an imminent recession, and if we fail to be vigilant, we, once united Americans, risk losing what is far greater and more valuable than money.
Recession Warning
For more than a year – particularly during the second quarter of 2024 as Wall Street analysts substantially raised their recession expectations – I’ve observed that while many of our leading economic gauges were hovering near recession thresholds, more evidence would be required to expect a recession with confidence. In our view, signal extraction and noise reduction calls us to examine more than one measure, because the most reliable information is almost always embedded in the common signal conveyed by multiple “sensors,” each that might be imperfect or only slightly reliable taken alone.
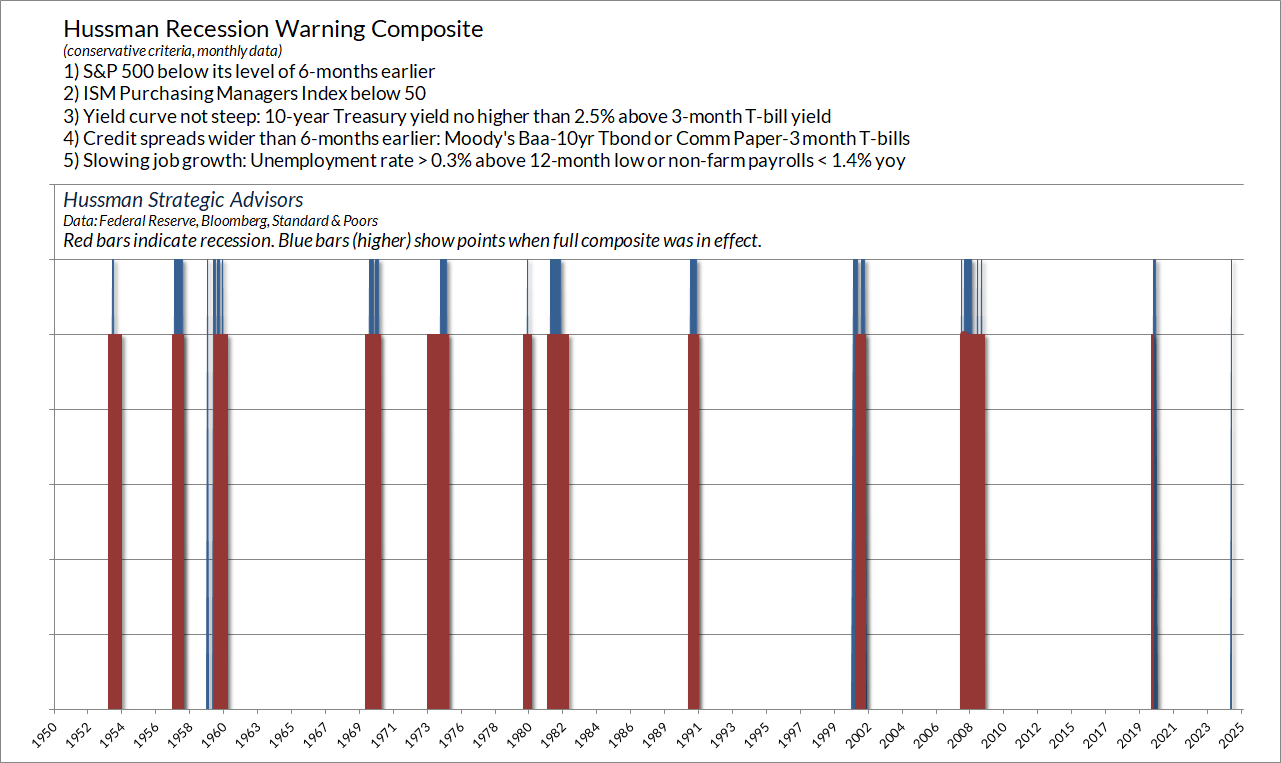
The chart below shows our Recession Warning Composite. The Composite became unfavorable on Tuesday, April 1 with the latest purchasing manager’s report. Wednesday’s tariff announcement only amplifies recession risks that have been developing for months. Humpty Dumpty has been wobbling on that high wall for a while now. On Wednesday, Humpty Dumpty was pushed.
As I noted in my recession projections in 2000 and 2007, the Composite is based on our 4-indicator rule-of-thumb reflecting credit spreads, maturity spreads, the S&P 500, and the ISM survey of purchasing managers. It’s intentionally based on “soft” measures that capture a syndrome of economic psychology that tends to precede “hard” data like GDP (a coincident indicator) and unemployment (a lagging indicator). Because investors and businesses became quite sensitive to emerging risks after the global financial crisis, I added an additional criterion requiring either an initial uptick in unemployment or slowing jobs growth, to make the composite more conservative and avoid false signals, which more sensitive measures experienced in 2011 and 2016.
To be clear, the composite below is not the sole basis of my recession expectations. Rather, it alerts us to features of economic activity that have historically been observed only in the context of recessions. As a result, this particular syndrome acts as an amplifier for signals that we draw from a much broader set of considerations, many which I described last November. Taken together, yes, we now expect a recession in the U.S. economy. The blue bars in the chart below show points when the full composite was in effect. The red bars indicate U.S. recessions.
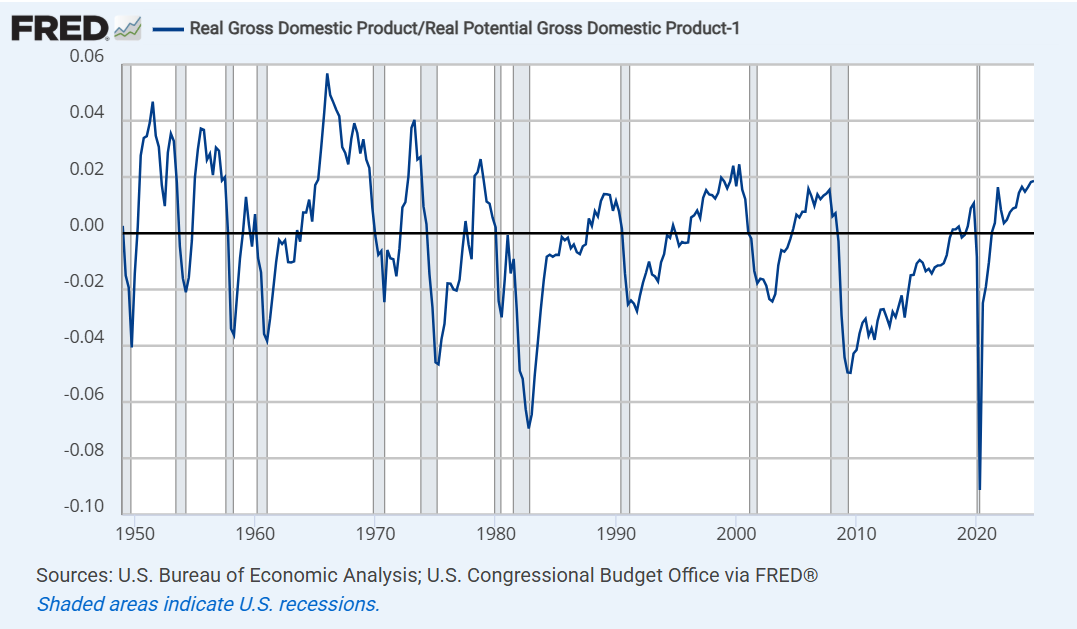
In recent months, I’ve described the ongoing wave of economic policy disruptions as akin to “rocking a perched boulder.” Just as steep valuations invite the risk of market losses, the ratio of real U.S. GDP to potential GDP is a useful measure of downside economic risk.
As I’ve detailed previously, the CBO estimate is closely aligned with our own estimates that simply use productivity and labor force demographics, so while one might find a little bit of wiggle room in the estimates, real potential GDP has generally been a reliable guide to the general position of the U.S. economy within the economic cycle.
Presently, U.S. real GDP stands nearly 1.9% above estimated sustainable full-employment potential, which is typical of late-stage economic expansions.
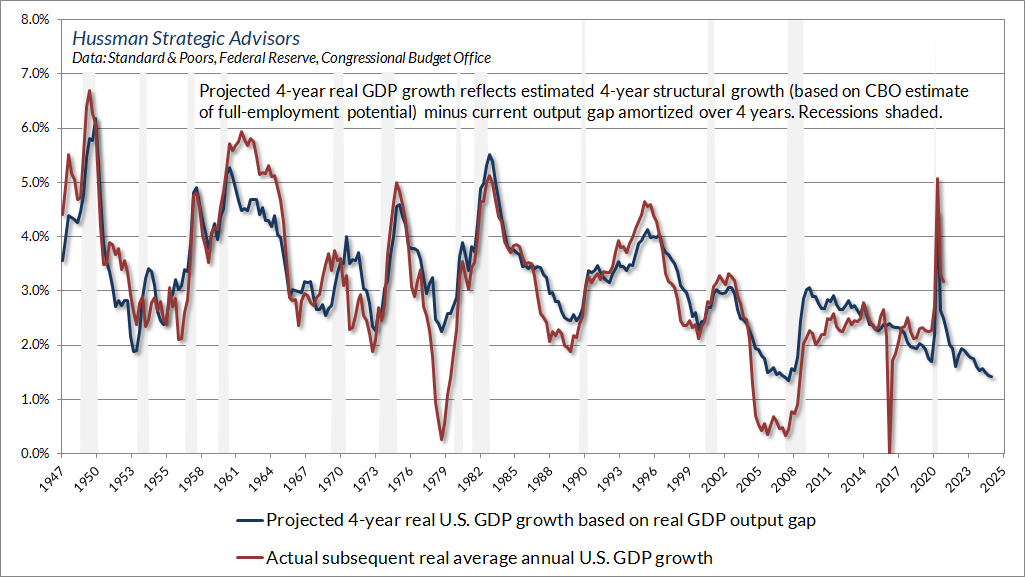
A useful way to think about prospects for future growth is to consider both the “structural” trends, as well as the gradual elimination of accumulated extremes. The chart below shows this approach, applied to the baseline prospects for real U.S. GDP growth over the coming 4-year period.
The blue line in the chart below reflects the estimated 4-year structural GDP growth, minus the current output gap, amortized over 4 years. The red line shows actual subsequent 4-year real annual U.S. GDP growth. At present, our baseline estimate for average real U.S. GDP growth over the coming 4 years is about 1.4% annually, with the caveat that recessions typically induce a striking shortfall from these estimates.
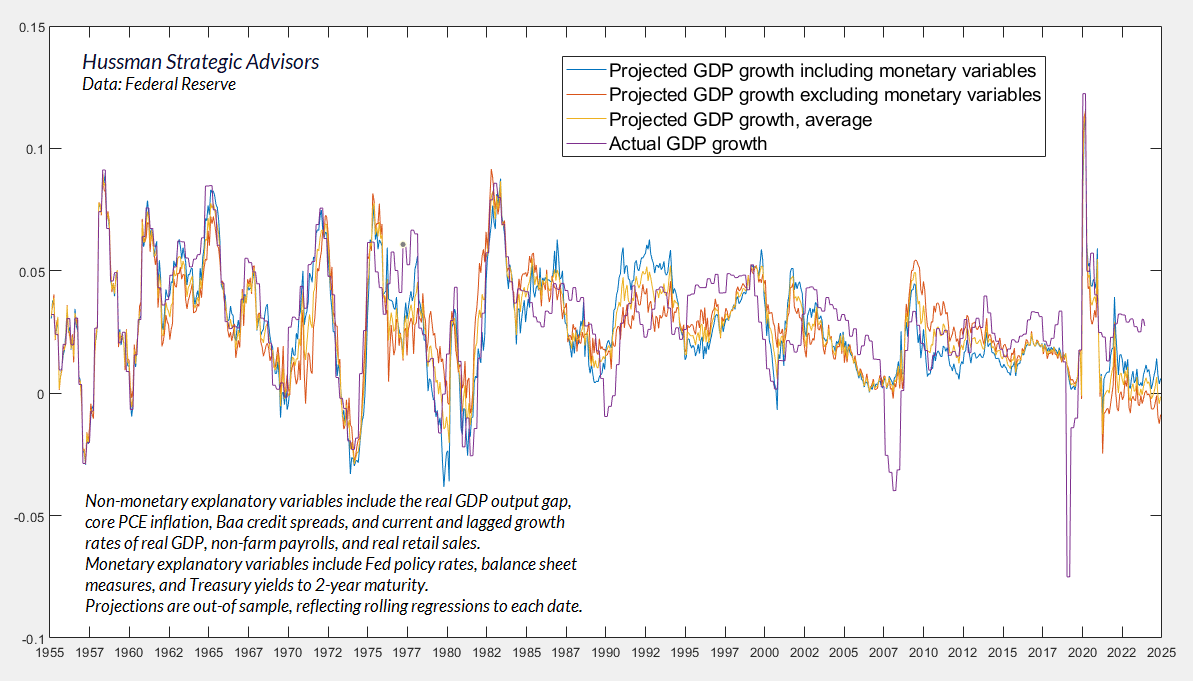
While we don’t rely on forecasts, we do use a broad range of estimation methods to benchmark our expectations. The chart below shows our current estimate of year-ahead GDP growth. Nothing in our investment approach relies on a recession, and even recessions don’t always produce a year-over-year decline in real GDP. Presently, however, our average estimates for year-ahead GDP are negative.
The combination of a 1.9% output gap and a core inflation rate still well above the 2% target places at least some restraint on further rate cuts by the Federal Reserve. John Taylor, one of my dissertation advisors at Stanford, based his “Taylor Rule” on these measures as a benchmark for systematic monetary policy. Based on the Taylor Rule, as well as broader systematic benchmarks that have historically described Fed policy, the Fed Funds rate is already running below the level consistent with prevailing economic conditions. Given what we now view as the likelihood of an oncoming recession, we do expect further cuts, but any further persistence in inflation will require greater levels of economic deterioration to force the Fed’s hand.
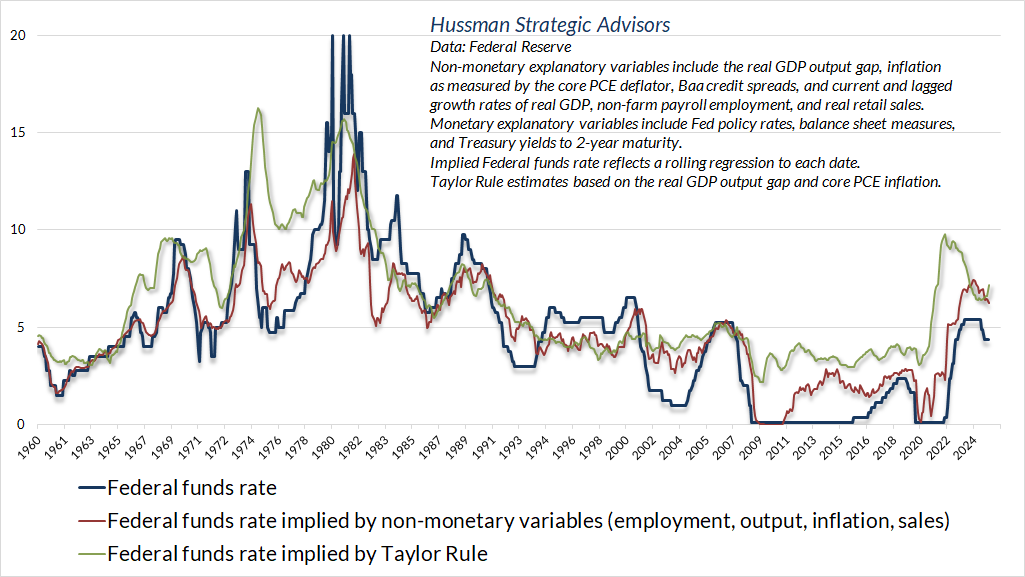
Fortunately, from an investment standpoint, we need not rely on any particular expectation regarding Fed policy. As I’ve detailed in past comments (see for example, You’re Soaking In It), easy money reliably supports stock prices when investors are inclined to speculate, which we gauge based on measurable, observable market internals. Indeed, the entire cumulative benefit of Fed easing for the stock market, both historically and during QE, is captured by periods when our key gauge of market internals has been favorable. In contrast, even during periods of easy money, the cumulative total return of the S&P 500 has lagged Treasury bills when internals have been unfavorable. The reason is simple. When investors are inclined to speculate, they view safe liquidity as an inferior asset. When they become risk-averse, safe liquidity becomes a desirable asset, so creating more of the stuff doesn’t provoke speculation.
On deficits, corporate profits, and subversion masquerading as statesmanship
It’s striking how little Wall Street analysts recognize the extent to which the government deficits of recent decades have contributed, directly and indirectly, to record corporate profits. As I discussed in last month’s comment, The Government Deficits Land in the Deepest Pockets, from 2016 through 2020, $8.4 trillion in new 10-year deficit spending was approved – a combination of tax cuts and net spending increases, with about $3.6 trillion of that related to pandemic response. From 2020 through 2024, another $4.3 trillion in 10-year deficit spending was approved, about $2.1 trillion of that being pandemic response (Committee for a Responsible Federal Budget).
Government deficits are always matched by surpluses in other sectors (income in excess of consumption and net investment). The chart below shows how this works from an accounting standpoint. This is a version of a chart I presented last month. In this case, the blue line shows U.S. corporate free cash flow (after tax profits minus net investment) as a share of GDP. The red line shows the combined surplus (deficit) of other sectors, where the largest component is the federal deficit.
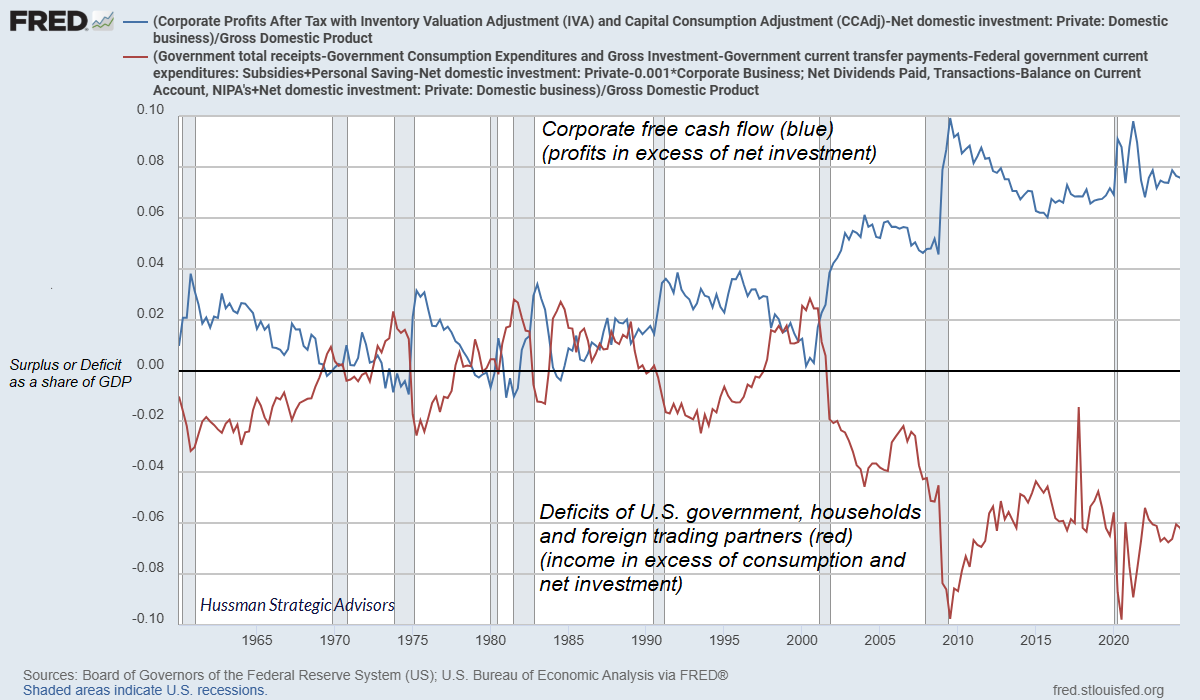
The deterioration in that red line isn’t driven by the 0.1% of GDP the U.S. spends on humanitarian aid, nor the 0.3% of GDP the U.S. spends on supplemental nutrition assistance (SNAP) for the poor. It’s driven by a repeated, persistent tendency to respond to recessions and financial crises with “stimulus” plans that combine tax cuts (as in 2017) with massive, indiscriminately targeted rescue packages (as during the global financial crisis and the pandemic). These crisis-related deficits have been far and away the largest source of expansion in the Federal debt in recent decades. Military spending, particularly in the years following 9/11, has been a secondary contributor.
Whether directly or indirectly, this deficit spending has ultimately emerged in the form of record corporate profits, even while middle-class households accumulate consumer debt and rely on cheap imports in order to make ends meet. Raising tariffs on imports, cutting spending for the poor, minimizing corporate tax rates, and firing all the Inspectors General makes none of this better.
The chart below shows the year-over-year change in the U.S. federal debt to GDP ratio. Notice where the spikes are. The shaded areas are recessions. If we are truly interested in a sustainable federal debt, the first orders of business are to discourage policy distortions that encourage speculation and its inevitable collapse, to ensure that bank capital requirements are sufficient to limit the risk of financial crises, and to demand better targeted stimulus packages, when necessary, that directly encourage capital investment and target lower- and middle-class households with the highest propensities to consume.
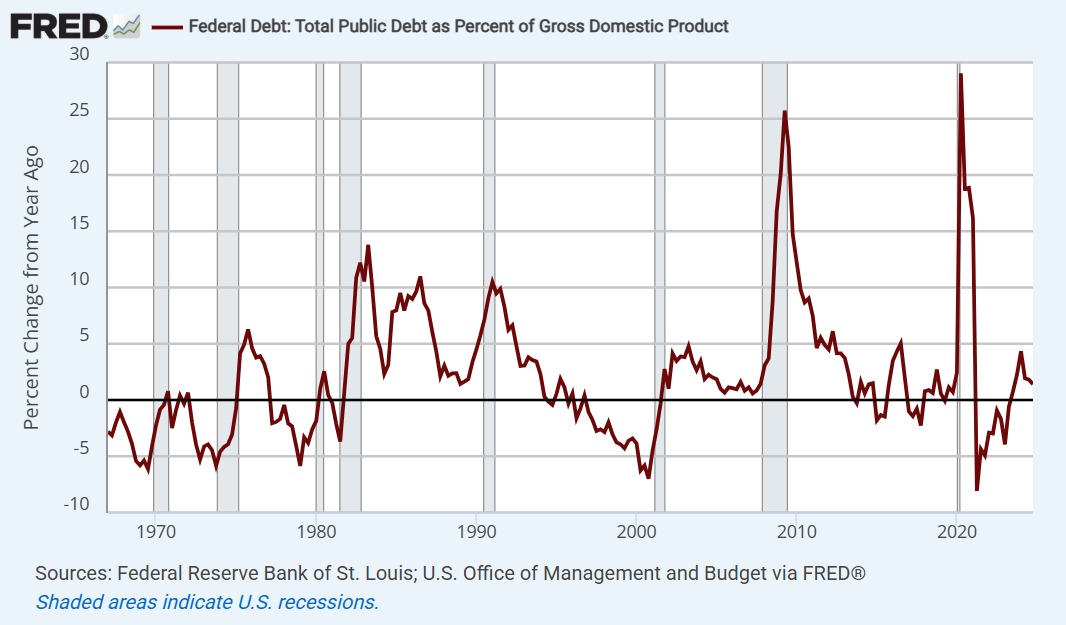
As we look to improve our economic future, we should consider that it’s not the poor or the vulnerable that have profited most from “crisis responses” that feature profligate fiscal “stimulus” and deranged “monetary support”. The clear winners are U.S. corporations, and the 1% of Americans that own 50% of all corporate equities.
The tragedy is that the public is so easily played by isolated stories that provoke outrage, by inaccurate reports, and by misrepresentations of fact, that they’ve become willing to gut the U.S. civil service, humanitarian aid, medical research, even Social Security staffing, and to accept – even celebrate – the installation of unaccountable loyalists throughout the U.S. government. All under the pretext of reducing “waste, fraud, and abuse.”
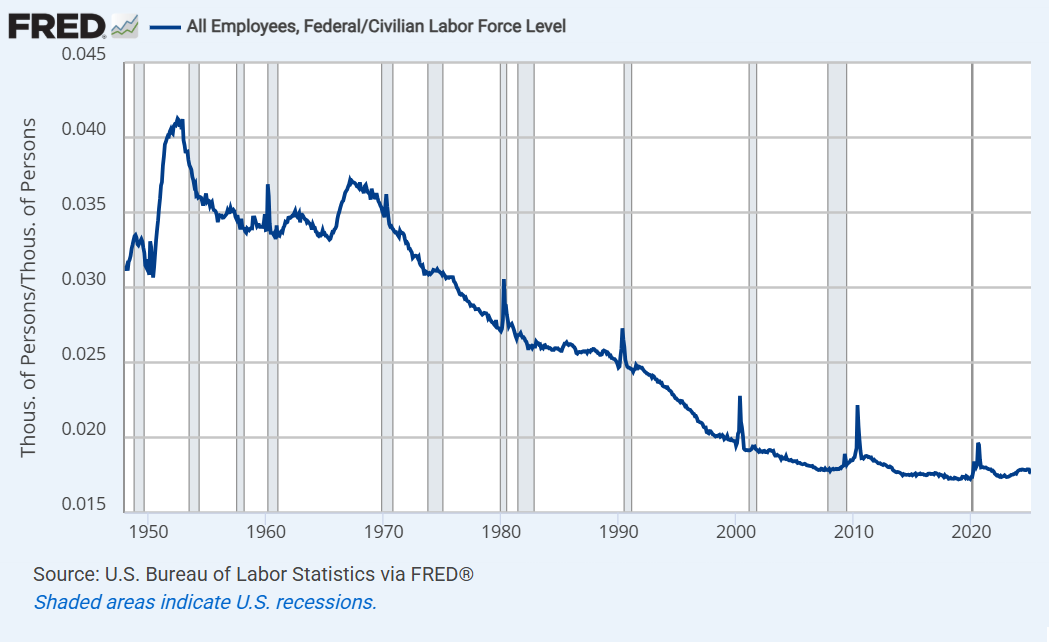
The fact is that U.S. federal employment as a share of the civilian labor force is already near the lowest level in history. Indeed, compensation of federal workers amounts to just 4% of the federal budget, and only about 1% of GDP.
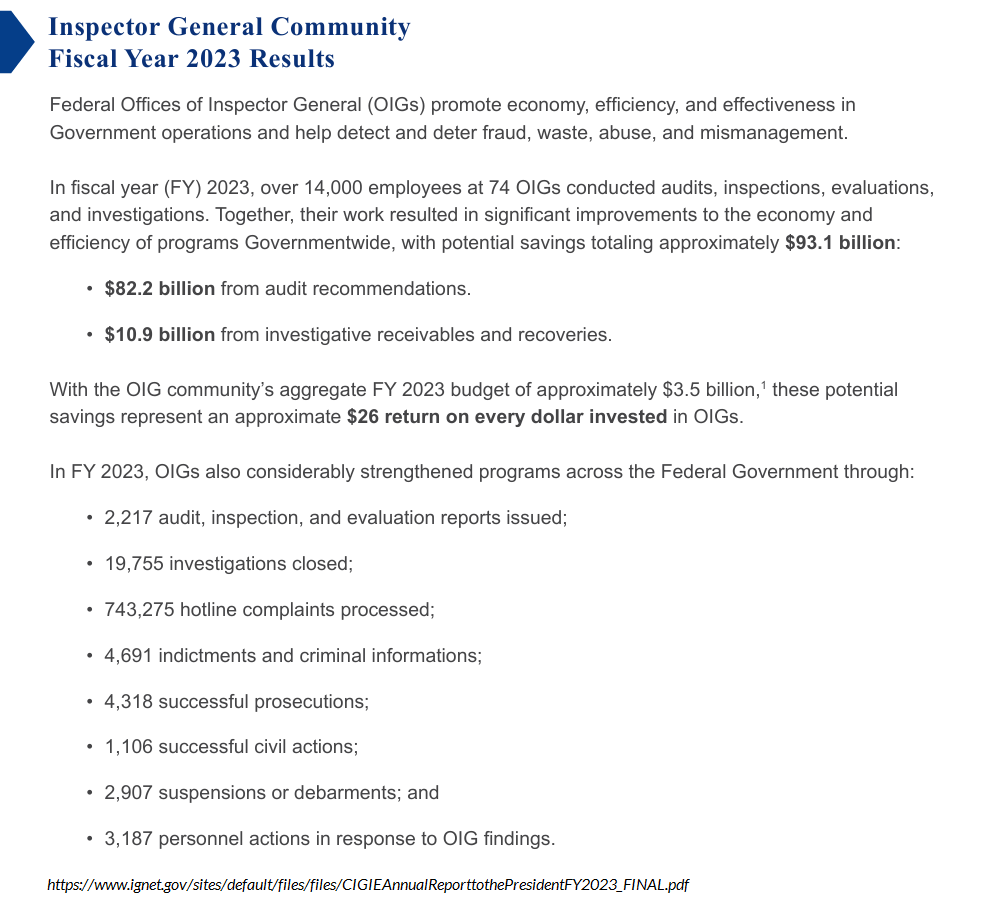
If one’s goal is to detect waste, fraud, and abuse, your first act in office would not be to expel the independent Inspectors General, who serve as watchdogs against waste, fraud, and abuse. Their latest report includes thousands of investigations and successful prosecutions.
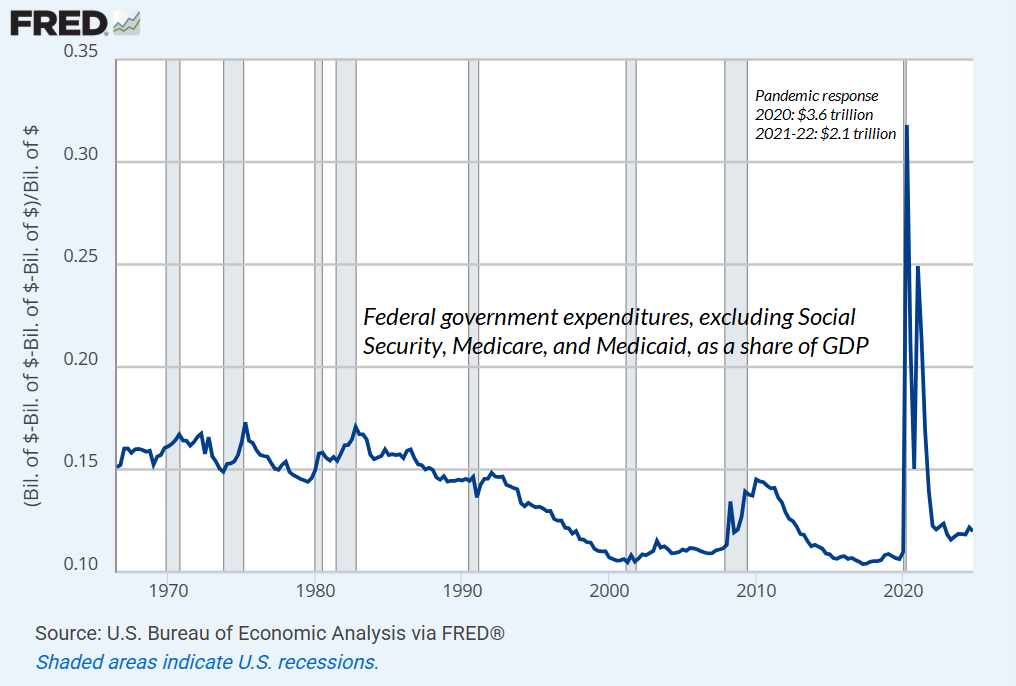
Meanwhile, apart from the massive pandemic response ($3.6 trillion in 2020, $2.1 trillion in 2021-22), federal spending outside of Social Security, Medicare, and Medicaid, as a share of GDP, is actually well below the norm prior to the mid-1990’s.
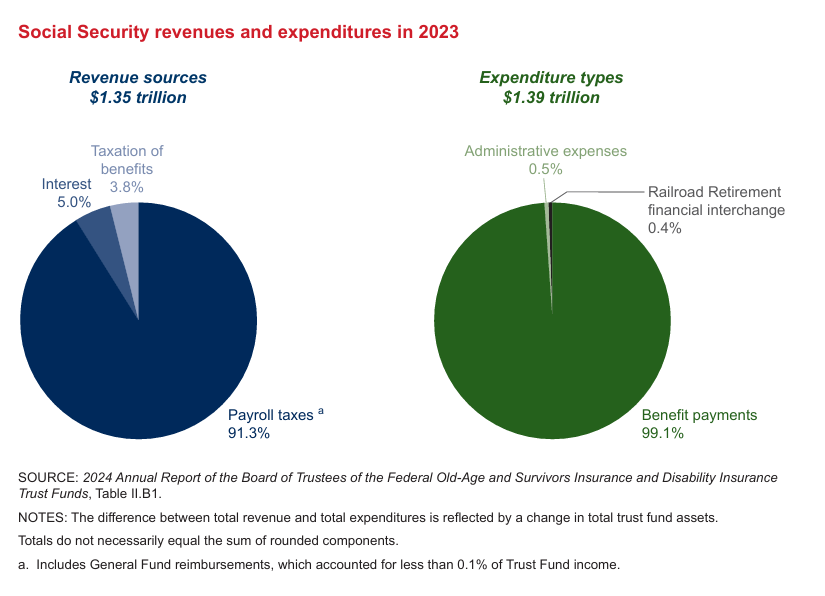
Keep in mind that 90% of Social Security and Medicare Part A spending is funded by taxes and premiums paid by people who benefit. Medicaid does cover the disabled and the poor (about 60% federal and 40% state funding). Meanwhile, the Social Security Administration has administrative expenses of just 0.5%. There’s no question that demographics will become increasingly skewed in the coming years, with a progressively higher ratio of retirees to working Americans. There’s also no question, however, that the U.S. income distribution is even more skewed, yet Social Security tax applies to a maximum of $176,000 of income, and not a dollar of profits or capital gains, even for billionaires. These simple facts are just waiting for people to put two and two together.
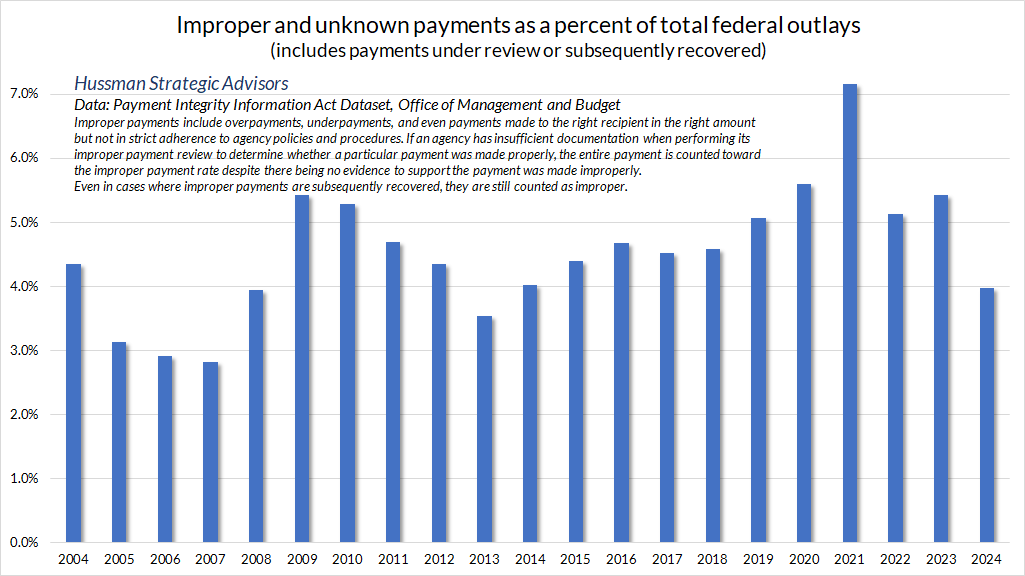
Of course, given the number of disbursements involved in Social Security, Medicare and Medicaid, a key area of potential waste, fraud and abuse is improper payments. Here’s a summary of that data, including all payments under review even if cleared as proper or later recovered. Even payments to the correct recipient in the correct amount, but not in strict adherence to agency procedures are reflected here. Somehow, a kakistocracy of demagogues has misled the public into imagining that none of this review takes place.
While it has somehow become acceptable to rely on the ten-minute assessments of people bearing chainsaws in preference to independent, career Inspectors General bound to GAGAS auditing standards, it is also a patent fabrication that “40% of all calls to Social Security are fraudulent.” Rather, the correct data point is that “40% of deposit fraud, amounting to a tiny 0.00625% of payments, is done by phone” – despite the same security and customer identification protocols typically used in the U.S. banking system.
Separately, the bipartisan Government Accountability Office reports the amount of confirmed fraud – about $4 billion annually in recent years – identified based on these multiple layers of audit.
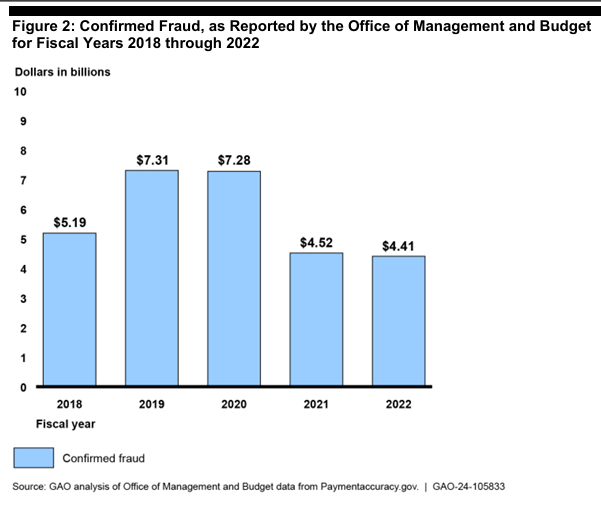
As I’ve noted previously, estimates of larger-scale fraud and abuse have either been disproved and taken off the DOGE website, or reflect assumption-laden “simulations” that explicitly reject informed input, valid sampling, or data analytics.
Beyond confirmed fraud are the audit recommendations by the Inspectors General: about $10 billion in questioned costs, and about $11 billion in investigative recoveries in 2023. The IG community also made recommendations last year focused on stronger program integrity and efficient use of funds. These recommendations, comprising $75 billion of potential savings, are the first place that an informed administration would start if the actual goal was to improve efficiency and reduce waste. Instead, the Inspectors General – whose job it is to provide public accountability and to detect waste, fraud, and abuse – were fired on day 3.
Ultimately, noise reduction is about drawing a common signal from measurable data. It’s fine to examine alternate data, but one should at least require it to reflect audit and analysis, and not just opinion, cynicism, simulations, demonstrable falsehoods, uninformed assertions, or retracted “receipts.”
Michael Lewis – the author of Liars Poker, Moneyball, and The Big Short, shares a similar perspective below:
Michael Lewis on @DOGE
From his interview with @dmoses34 pic.twitter.com/3kvR9ZTwg6
— dharmafi (@dharmatrade) March 6, 2025
The gestalt psychologist Kurt Koffka wrote “The whole is something else than the sum of its parts.” In any form of analysis, the way to draw useful signals is to examine evidence not piece by piece, but in the context of syndromes that convey more information, taken together, than any one piece might convey individually. In the present context, consider the full syndrome of behaviors we are now observing – eliminating the individuals responsible for oversight, gutting the civil service, installing loyalists at every level of government, abandoning and betraying allies, canceling USDA funding toward food banks for the poor – as if the cruelty is the point, suspending surveillance for Russian cyber-threats, halting funding for election security initiatives, announcing third term aspirations, silencing the Voice of America, violations of the right of all persons to due process (which throughout history has always cracked the egg by starting with those who are least defensible), imposing a global tariff structure with no mapping to any logical framework but chaos, suppressing viewpoints deemed to be “improper ideology”, pardoning loyalists who violently attacked the Capitol Police, $5 million one-to-one business meetings, self-dealing across everything from government agency contracts to self-distributed crypto, territorial aspirations to annex sovereign countries coupled with thinly veiled threats – consider the full syndrome, and it should be clear that this consolidation of power has crossed dangerously beyond the ordinary dysfunction of partisan politics.
The Russian-American dissident Masha Gessen described the Russian regime as “consolidation of power for the sake of power, the destruction of civil society, and the creation of a mafia state.” In the words of U.S. intelligence expert Fiona Hill, the system operates as “a highly personalized autocracy centered on a kleptocratic system of governance, based on loyalty and suppression of dissent.” One might consider the possibility that we are ceding every branch of government to people who do not oppose autocrats because they openly admire and quietly hope to become them.
Even in the early moments when we recognize subversion but it doesn’t yet sting, silence is corrosive. One is reminded of Martin Niemöller – “first they came for … and I did not speak out.”
Unlimited power in the hands of limited people always leads to cruelty. It is not that evil people seize power, but that the system selects for mediocrity and loyalty. The result is a government that cannot correct itself, cannot hear its citizens, and cannot change course without collapse. It lives only to preserve itself.
Alexander Solzhenitsyn, The Gulag Archipelago, 1973
Authoritarianism is not always born in a coup or with jackboots in the street – it arrives disguised as order, as security, as tradition. It hollows out institutions from within, replaces law with loyalty, and trades truth for narrative. It centralizes wealth and power, erodes the public good, and demands obedience in exchange for stability. What it fears most is accountability – and what it destroys first is the capacity to demand it.
– Anne Applebaum, author of Twilight of Democracy
As for broader aspects of economic policy, including tariff policies, my November comments continue to stand.
I don’t really expect tax policies that will promote either increased labor force participation (which would primarily involve expansion of policies like the earned income tax credit, child and dependent care credits, transportation access, and availability of affordable housing), nor increased net domestic investment (which would primarily involve policies to directly encourage investment, rather than hoping to indirectly influence it by cutting tax rates on profits, high incomes, and financial gains). The problem is that economies don’t enjoy sustained growth without labor force growth or investment-led productivity growth. That’s not politics. It’s just arithmetic.
In contrast, I’ve always observed that recessions are first and foremost periods when a mismatch emerges between what the economy has been producing, and what the economy now demands. Those mismatches can be driven by shifts in consumer preferences, interest-sensitive investment, technology, government spending, credit strains, or crises like the pandemic. Disruptions triggered by these mismatches take time to resolve, absent massive bailouts and deficit spending. My impression is that we may experience more than a bit of mismatch and disruption in the next few years.
Provided complementary policies are in place to encourage labor participation and investment, tariff protection for a period of time can sometimes benefit strategic and infant industries that are critical for self-sufficiency. But policies focused on broader tariffs are among the sources of disruption and mismatch that tend to harm economies, as we should have learned from the Smoot-Hawley tariffs passed in June 1930. The economy and financial markets were already enormously vulnerable after years of speculative malinvestment, and until the FDIC was created in 1933, there was no formal way to take failing banks into receivership, which clearly also contributed to the Depression. The vast majority of financial and economic collapse emerged between mid-1930 and mid-1932. Indeed, while the stock market lost 89% during the Depression, the 1932 market bottom represented an 80% loss from the lowest level reached in late-1929 after the initial October crash.
– John P. Hussman, Ph.D., The Turtle and the Pendulum, November 17, 2024
Market Conditions
The best way of reading the market is to read from the standpoint of values. The market is not like a balloon plunging hither and thither in the wind. To know values is to comprehend the meaning of movements in the market.
– Charles Dow, founder and first editor of the Wall Street Journal, ~1902
While Charles Dow is largely remembered as the originator of Dow Theory, which investors and technical analysts often view as focused solely on price behavior, Dow himself would disagree. When he wrote “to know values is to comprehend the meaning of movements in the market,” he clearly understood that two forces operate simultaneously in the markets. One is focused on values, on the cash flows that investors receive over time in return for what they pay. The other is focused on investor psychology – the relative eagerness of buyers versus sellers. As the markets fluctuate, one should frequently consider whether prices are moving toward historically normal valuations or are instead being driven further away from them.
We regularly emphasize that extreme valuations alone don’t necessarily imply imminent market losses. Most of the information carried by valuations relates to likely market returns on a 10-12 year horizon, as well as the depth of potential losses over the completion of any given market cycle. If rich valuations were enough to drive immediate market losses, valuations could never have reached the extremes of 1929, 2000 and today. These bubbles required extended periods of speculation that ultimately convinced investors, at the worst possible time, that valuations were useless.
In 1934 after the 89% market collapse of the Great Depression, Benjamin Graham and David Dodd described the error of investors as the market approached its 1929 market peak, writing that investors had abandoned their attention to valuations because “the records of the past were proving an undependable guide to investment… It was only necessary to buy ‘good’ stocks, regardless of price, and then to let nature take her upward course. The results of such a doctrine could not fail to be tragic.”
As Robert Rhea wrote in 1932, recounting the 1929 peak, “Veteran traders look back at those months and wonder how they could have become so inoculated with the ‘new era’ views as to have been caught in the inevitable crash.”
Numerous previous market comments detail the relationship between valuations, subsequent returns, and full-cycle market losses, as well as the mitigating or amplifying impact of market internals and monetary policy (see in particular the July 21, 2024 comment You’re Soaking In It).
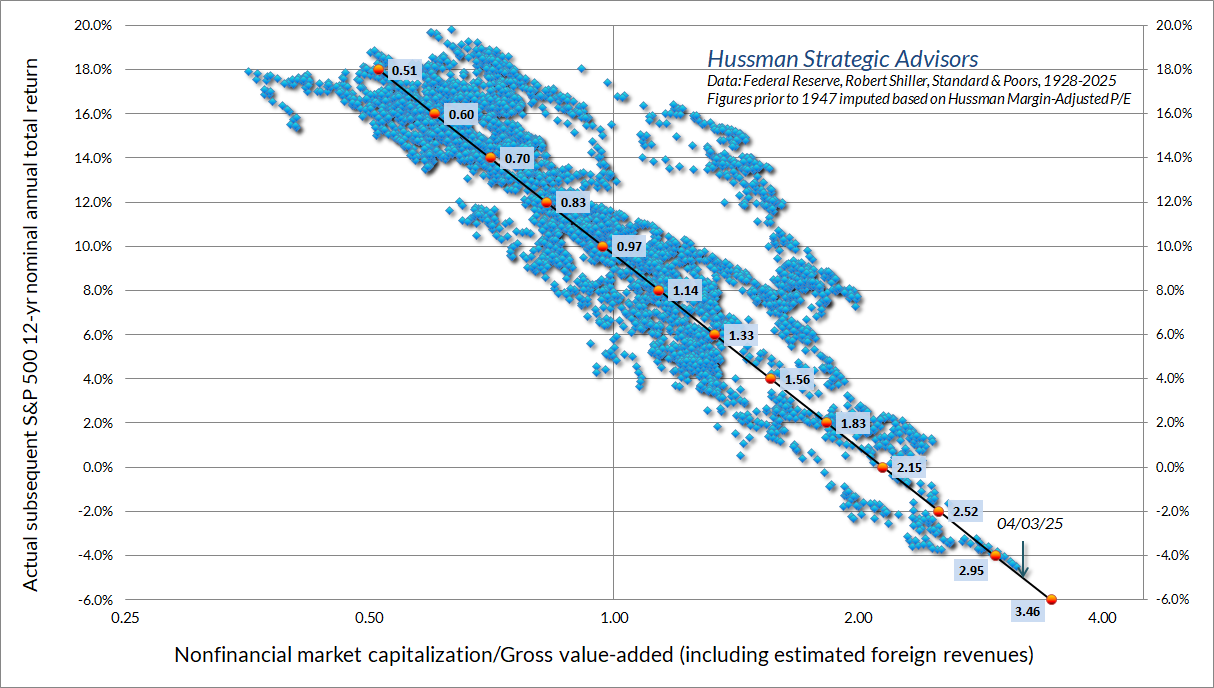
Presently, our primary gauge of market internals might best describe market behavior as ragged and unraveling. Valuations remain beyond the 1929 and 2000 extremes, implying 10-12 year S&P 500 total returns on the order of -5% annually by our estimates, while being permissive of a full-cycle loss on the order of 73% in the S&P 500 simply to restore valuation norms historically associated with run-of-the-mill expected returns of 10% annually. Meanwhile, monetary policy – though in an objectively easing stance – is likely to have relatively weak impact on the market, aside from announcement pops, until a shift to favorable market internals indicates a return to robust speculative investor psychology, which would treat safe liquidity as an inferior asset rather than a desirable one.
The chart below shows our most reliable valuation measure, based on its correlation with actual subsequent S&P 500 total returns in market cycles across history, in data since 1928. The blue line shows the market capitalization of U.S. nonfinancial equities as a ratio to their gross value-added, including our estimate of foreign revenues. MarketCap/GVA presently remains beyond both the 1929 and 2000 extremes.
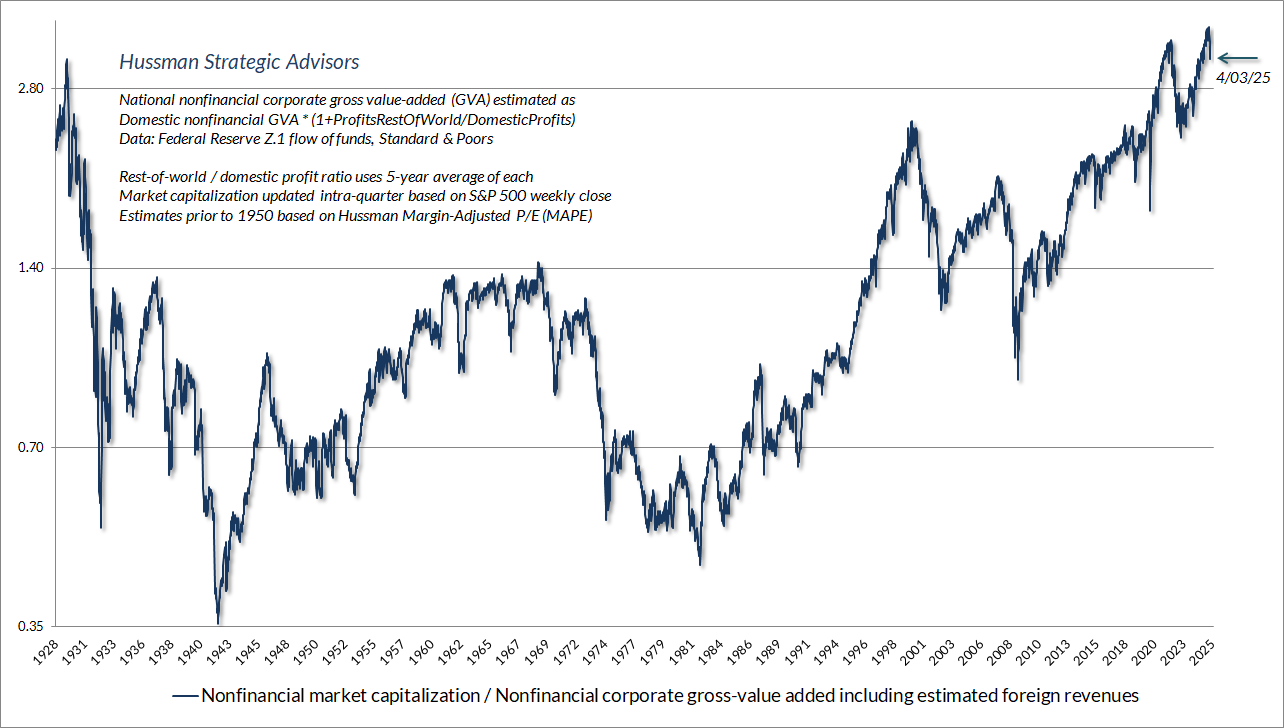
The chart below shows the relationship between MarketCap/GVA and actual subsequent 12-year S&P 500 average annual nominal total returns, in data since 1928. Across a century of market cycles, the valuation level associated with 10% annual returns has been just 0.97 (see prior comments for the discounted cash flow arithmetic behind this relationship). MarketCap/GVA peaked at a level of 3.6 on February 19, hence the preposterous estimate of the market loss that would be required to restore run-of-the-mill valuation norms.
It will be no particular comfort that this basic arithmetic has been strikingly useful in prior market cycles. On March 7, 2000, for example, I observed, “Over time, price/revenue ratios come back in line. Currently, that would require an 83% plunge in tech stocks (recall the 1969-70 tech massacre). The plunge may be muted to about 65% given several years of revenue growth. If you understand values and market history, you know we’re not joking.” As it happened, the tech-heavy Nasdaq 100 would go on to lose an improbably precise -83% by the October 2002 market low.
Emphatically, nothing in our investment discipline relies on any of the above risks being realized. Our discipline is to align our investment stance with prevailing, measurable, observable market conditions, and to change our investment stance as those conditions change. No forecasts are required. We can accept the prospect of a collapse to run-of-the-mill valuations just as easily as the prospect of record valuations and endless monetary interventions. History has a great deal to say about the likelihood of one versus the other, and arithmetic has a great deal to say about the very different long-term returns that investors could expect in those different situations. Still, we’ll take good care of the future by taking good care of the present moment, again, and again. That’s where we focus our attention.
I’m happy to note that my enthusiasm about the hedging implementation we introduced in September has been well-placed in recent quarters (for more, see Asking a Better Question, Subsets and Sensibility, and the section titled “The Martian” in The Turtle and the Pendulum). The “eureka moment” was realizing it was the wrong question to ask how we might cleverly dart between a defensive outlook and a bullish one amid historically ominous market conditions. The better question was how to vary the intensity of a valid defensive outlook, in a way that can be expected to benefit even in a further advance, provided only that the market fluctuates along the way.
Though that September 2024 hedging implementation is mainly rooted in options mathematics and the hedging element of our investment discipline, it turns out that the method is also strikingly useful in responding to various “compression syndromes” I’ve described over the years, as well as identifying periods when mega-cap stocks – regardless of valuation – tend to systematically outperform the broad market, on average. So I got that goin’ for me… which is nice. My hope is that the impact of this implementation is becoming apparent, particularly in a market that has gone “nowhere in an interesting way” since June of last year.
A turn of the tide
I’ve often said that asking us whether stocks are in a bull market or a bear market is a bit like asking Christopher Columbus what sort of trees are planted at the edge of the earth. The question doesn’t really compute, because it’s not how we think about the world. Our discipline is firmly rooted in the present moment, and in the measurable, observable elements of our discipline. Various measures certainly have implications about the likely distribution of market returns, but our discipline is still to align our investment position with prevailing conditions, just as we would align the canvas of a sailboat in response to the prevailing, measurable, observable wind.
William Peter Hamilton, who beautifully articulated and expanded Charles Dow’s methods of market analysis, often emphasized that the market fluctuations take the form of primary movements in the direction of the major trend, and secondary reactions in the opposite direction (typically on the order of 5-8%, comprising 1/3 or 2/3 of the preceding move). Unlike us, Dow and Hamilton were perfectly content with labeling the major trend as a bull or bear market. They observed that the turn of the tide was typically marked at the point when the Dow Industrials and the Dow Transports jointly break below the lows of the secondary reactions that initially followed their prior “bull market” highs – even if one average breaks to further lows before the other.
As Hamilton wrote, “All we assume is that the market has turned, with the two averages confirming, even though one of the averages subsequently makes a new low point or a new high point, but is not confirmed by the other. The previous lows or highs made by both averages may best be taken as representing the turn of the market.”
While our own discipline is not at all based on Dow Theory, we do monitor its framework, and we share its respect for the full-cycle context provided by valuations, and its emphasis on uniformity and confirmation in the interpretation of market action. In the context of a late-stage economic expansion and a stock market at record valuations, my impression is that Dow and Hamilton would view recent market behavior as follows:
The high point of the recent cycle was set by the Dow Industrial Average on November 25, 2024, confirmed shortly thereafter by a fresh high in the Dow Transportation Average on December 4. The Industrials then had a secondary reaction to a closing low of 41,938.45 on January 10. The Transports also had a reaction, but the low was set a bit earlier, on December 19 at 15,859.45. Following these secondary reactions, the Industrials attempted an advance to fresh highs, but failed on a closing basis. The Transports enjoyed only a modest advance during that attempt at new highs. Following that failed attempt and non-confirmation, the first blow to the major trend, from a Dow Theory perspective, was on February 27, when the Transports broke their prior reaction low, closing at 15,762.80. The Industrials then confirmed the break on March 10, 2025, breaking through the prior reaction low, and closing at 41,911,71. That’s the date I believe both Dow and Hamilton would have warned of “a turn of the tide.”
Observing similarly extreme valuations in 1929, Hamilton wondered aloud “if people are not buying upon hope which may be at least deferred long enough to make both the heart and the pocketbook sick.” This question is worth considering today, because considering the market loss that would be required to restore historically run-of-the-mill valuations, to quote Bachman-Turner Overdrive, “You ain’t seen nothin yet.”
Of all the bull markets recorded by the Dow-Jones averages since 1897, never were the averages as easy to read as the turn after the peak of 1929 was attained. Any student of the theory sufficiently skilled in its use to have learned to trade successfully on secondary reactions would have unloaded stocks in September. Without exception, those who did not have since wished that they had trusted the Dow theory more and their own judgment less.
– Robert Rhea, The Dow Theory, 1932
Even here, keep in mind that nothing in our investment discipline relies on a recession or a major retreat in market valuations. Our discipline is to respond to shifts in measurable, observable market conditions. Even severe market downturns include numerous “fast, furious, prone-to-failure” advances to clear oversold compression, so we continue to monitor those conditions as well. My hope is that valuations, market internals, economic tools, and the numerous syndromes we regularly discuss are helpful in giving context to the day-to-day noise. My intent is never to convince others, but to contribute something that may be useful in their thinking.
Keep Me Informed
Please enter your email address to be notified of new content, including market commentary and special updates.
Thank you for your interest in the Hussman Funds.
100% Spam-free. No list sharing. No solicitations. Opt-out anytime with one click.
By submitting this form, you consent to receive news and commentary, at no cost, from Hussman Strategic Advisors, News & Commentary, Cincinnati OH, 45246. https://www.hussmanfunds.com. You can revoke your consent to receive emails at any time by clicking the unsubscribe link at the bottom of every email. Emails are serviced by Constant Contact.
The foregoing comments represent the general investment analysis and economic views of the Advisor, and are provided solely for the purpose of information, instruction and discourse.
Prospectuses for the Hussman Strategic Market Cycle Fund, the Hussman Strategic Total Return Fund, and the Hussman Strategic Allocation Fund, as well as Fund reports and other information, are available by clicking Prospectus & Reports under “The Funds” menu button on any page of this website.
The S&P 500 Index is a commonly recognized, capitalization-weighted index of 500 widely-held equity securities, designed to measure broad U.S. equity performance. The Bloomberg U.S. Aggregate Bond Index is made up of the Bloomberg U.S. Government/Corporate Bond Index, Mortgage-Backed Securities Index, and Asset-Backed Securities Index, including securities that are of investment grade quality or better, have at least one year to maturity, and have an outstanding par value of at least $100 million. The Bloomberg US EQ:FI 60:40 Index is designed to measure cross-asset market performance in the U.S. The index rebalances monthly to 60% equities and 40% fixed income. The equity and fixed income allocation is represented by Bloomberg U.S. Large Cap Index and Bloomberg U.S. Aggregate Index. You cannot invest directly in an index.
Estimates of prospective return and risk for equities, bonds, and other financial markets are forward-looking statements based the analysis and reasonable beliefs of Hussman Strategic Advisors. They are not a guarantee of future performance, and are not indicative of the prospective returns of any of the Hussman Funds. Actual returns may differ substantially from the estimates provided. Estimates of prospective long-term returns for the S&P 500 reflect our standard valuation methodology, focusing on the relationship between current market prices and earnings, dividends and other fundamentals, adjusted for variability over the economic cycle. Further details relating to MarketCap/GVA (the ratio of nonfinancial market capitalization to gross-value added, including estimated foreign revenues) and our Margin-Adjusted P/E (MAPE) can be found in the Market Comment Archive under the Knowledge Center tab of this website. MarketCap/GVA: Hussman 05/18/15. MAPE: Hussman 05/05/14, Hussman 09/04/17.

