

Skating By The Trap Door (Motherlode II)


John P. Hussman, Ph.D.
President, Hussman Investment Trust
Interim Comment: Late-May 2024
Brief Observations
There are certain features of valuation, investor psychology, and price behavior that emerge, to one degree or another, when the fear of missing out becomes particularly extreme and the focus of speculation becomes particularly narrow. We’ve suddenly hit a motherlode of those conditions. Emphatically, this is not a forecast. It’s a statement about current, observable conditions.
“Noise reduction is always a process of drawing a common signal from multiple, partially correlated sensors, even if each individual sensor might be imperfect. The reason that we follow boatloads of these syndromes is the same reason we base our gauge of market internals on thousands of securities – uniformity conveys information.”
– John P. Hussman, Ph.D., Motherlode, November 20, 2021
Our investment discipline is to align our outlook with current, measurable, observable market conditions – particularly valuations and market internals – and to change that outlook as conditions change. In prior market cycles across history, one could also respond immediately to “overvalued, overbought, overbullish” market extremes, which provided a kind of “limit” to speculation even before market internals deteriorated explicitly. Amid speculation driven by zero interest rate policies, speculation lost its “limits,” and we abandoned our bearish response to overextended syndromes except in periods when market internals are also unfavorable. It’s the striking uniformity of hostile conditions – extreme valuations, unfavorable market internals, and a preponderance of overextended syndromes, that prompts an interim comment.
Measured from the January 2022 market peak, the total return of the S&P 500 lagged behind the return of Treasury bills through April of this year. Meanwhile, our own measures of valuations and market internals have remained unfavorable. With the market seeming to skate by the trap door of extreme valuations and unfavorable internals without consequence, the push to new highs in the past few weeks has created the impression of a runaway advance.
As I noted in late-2021, there are certain features of valuation, investor psychology, and price behavior that tend to emerge when the fear of missing out becomes particularly extreme and the focus of speculation becomes particularly narrow. Last Friday, we hit a fresh “motherlode” of these conditions. Since the mid-1980’s, I’ve developed and collected scores of interesting syndromes and relationships that help to gauge overextended conditions, in both directions. I’ll occasionally add, discard, or tweak one or two, but for the most part, I’ve used the same set for years. The most important change in 2021 was to require deterioration in our gauge of market internals, regardless of how overextended conditions might be otherwise.
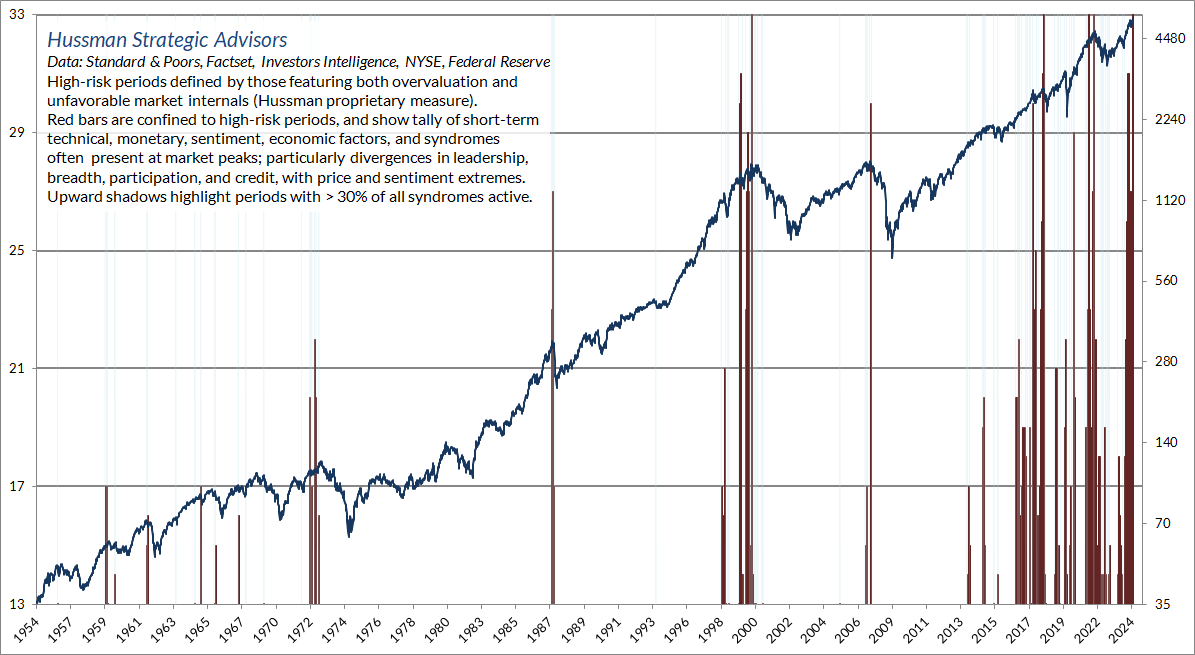
We keep the specifics of market internals and many technical measures proprietary, but we’re very open about the general features. A red flag is typically some combination of: overextended valuations and price/volume behavior; lopsided sentiment or speculative positioning; and divergence among individual stocks, industries, sectors, or security-types such bonds or lower-grade credit. The chart below shows the current tally of overextension syndromes, in weekly data. The blue line is the S&P 500 (right scale). The thin blue lines indicate periods when at least 30% of these syndromes were active.
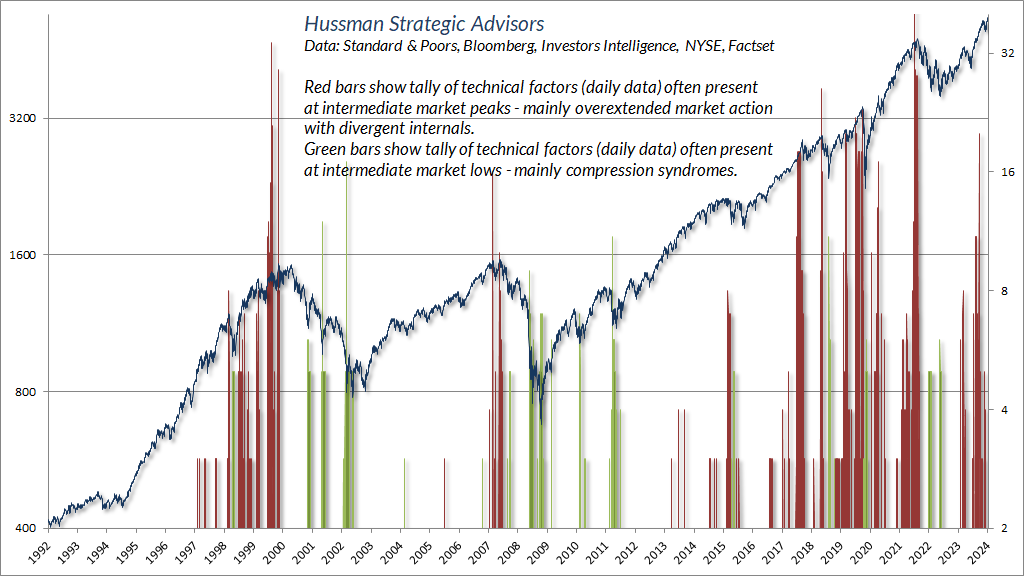
In recent months, I’ve expanded the set of comparable syndromes we monitor in daily data, including downside compression syndromes, which I’ve periodically discussed in special updates over the years. The red bars show a tally of technical factors – mainly featuring overextended market action coupled with divergent internals – that are often present at intermediate market peaks. The green bars show technical factors, mainly compression syndromes, that are often present at intermediate lows. The blue line is the S&P 500 (left scale)
At present, the “last straw” of market action that deserves monitoring in daily data relates to “leadership.” Expansion in the number of stocks hitting fresh 52-week lows (even 2.5-3% of issues traded) amid new highs in the major indices, tends to be a feature of market exhaustion. The reason is the same one I noted approaching the 2007 market peak:
One of the best indications of the speculative willingness of investors is the ‘uniformity’ of positive market action across a broad range of internals… I’ve noted over the years that substantial market declines are often preceded by a combination of internal dispersion, where the market simultaneously registers a relatively large number of new highs and new lows among individual stocks, and a leadership reversal, where the statistics shift from a majority of new highs to a majority of new lows within a small number of trading sessions.
“This is much like what happens when a substance goes through a ‘phase transition,’ for example, from a gas to a liquid or vice versa. Portions of the material begin to act distinctly, as if the particles are choosing between the two phases, and as the transition approaches its ‘critical point,’ you start to observe larger clusters as one phase takes precedence and the particles that have ‘made a choice’ affect their neighbors. You also observe fast oscillations between order and disorder in the remaining particles. So a phase transition features internal dispersion followed by a leadership reversal. My impression is that this analogy also extends to the market’s tendency to experience increasing volatility at 5-10 minute intervals prior to major declines.”
– John P. Hussman, Ph.D., Market Internals Go Negative, July 30, 2007
I continue to view the market advance of recent months as an attempt to “grasp the suds of yesterday’s bubble” rather than a new, durable bull market advance. I also believe that the S&P 500 could lose something on the order of 50-70% over the completion of this cycle, simply to bring long-term expected returns to run-of-the-mill norms that investors associate with stocks. Yet as I also note in nearly every market comment, typically with the word “emphatically,” nothing in our investment discipline relies on any forecast of near-term market action, nor on a reversion of valuations to their long-term historical norms.
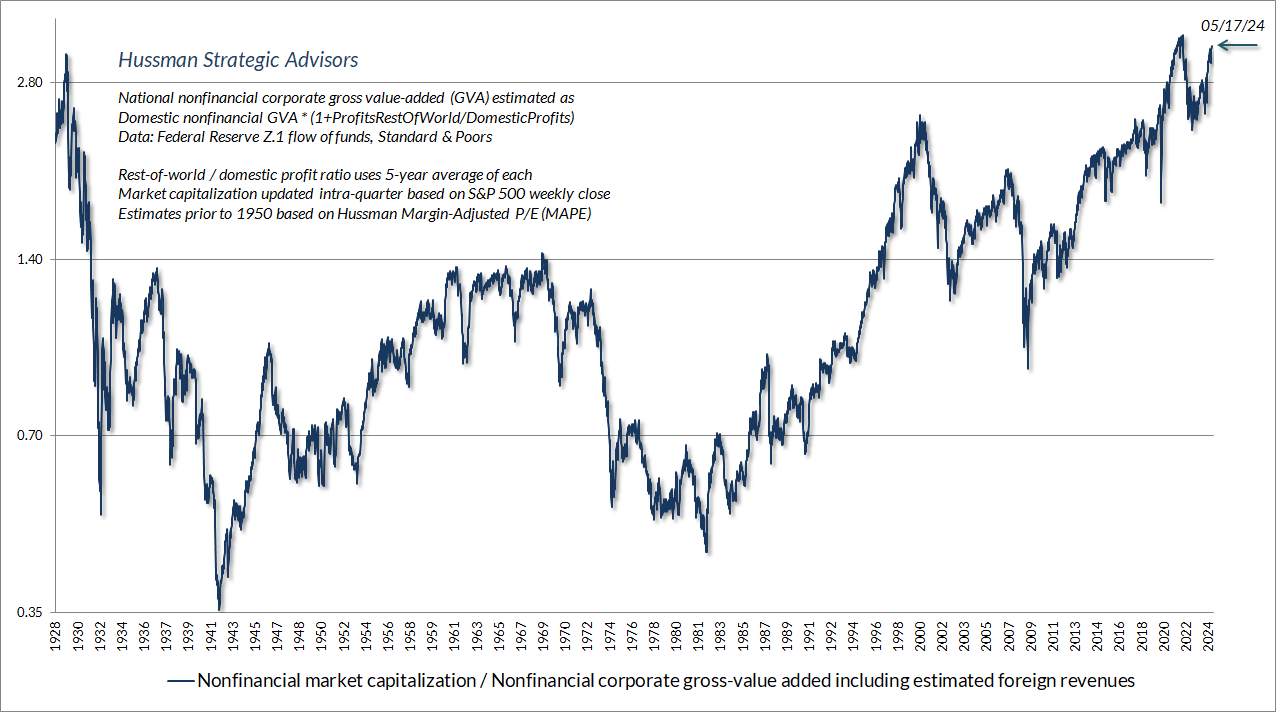
The chart below shows our most reliable valuation measure: the ratio of nonfinancial market capitalization to corporate gross-value added, including estimated foreign revenues. The present level exceeds the 1929 and 2000 extremes, and indeed every point in U.S. history except those closely surrounding the early 2022 peak. Even the more conventional (but less reliable) S&P 500 price/forward operating earnings multiple is at levels that have no rivals except surrounding the 2000 and 2022 peaks. Put simply, my impression is that the period since early-2022 comprises the extended peak of one of the three great speculative bubbles in U.S. history.
The S&P 500 has enjoyed average annual nominal total returns of nearly 7.3% since 2000. That outcome represents 4.3% from nominal revenue growth, plus an average dividend yield of 1.9%, plus an extra 1.1% annually, achieved by driving the S&P 500 price/revenue multiple from its 2000 extreme of 2.2 to the even more extreme level of 2.8.
At current valuation extremes, it is almost unfathomable how much the popularity of passive investing and the expectation of satisfactory long-term stock market returns relies on the assumption of permanently high and ever-increasing valuations.
That’s how the math works. Price = Price/Revenue x Revenue. Shake those two ingredients. Add dividends. Chill and serve. Since 2000, investors have squeezed more return from 4.3% revenue growth plus 1.9% dividends only by driving the price/revenue multiple to record extremes. Now move valuations the other direction, and the retreat in valuations acts as a subtraction to long-term returns. The math is the same for any other valuation multiple you prefer. It’s just noisier for fundamentals like earnings, where much of that noise is driven by variation in profit margins – reflecting impermanent changes in interest costs and cyclical fluctuations in real unit labor costs.
Clearly, nothing requires investors to demand historically normal long-term returns. Assuming continued nominal revenue growth of 4.3% annually and adding the current S&P 500 dividend yield of 1.4%, a “permanently high plateau” in valuations implies estimated long-term expected S&P 500 nominal total returns of about 5.7% annually. Probably needless to say, I view that estimate as wildly optimistic, particularly based on how history has disabused the notion of a “permanently high plateau.”
With our most reliable valuation measures between 2.8 and 3.2 times their historical norms, even briefly touching those norms a decade from today would subtract between 9.8-11.0% annually from that 5.7% baseline, implying total returns in the range of -4.1% to -5.3% annually. Again, this is just arithmetic. Even a slight retreat from a “permanently high plateau” would be enough to pull 10-year estimated total returns into the low single digits. At current valuation extremes, it is almost unfathomable how much the popularity of passive investing and the expectation of satisfactory long-term stock market returns relies on the assumption of permanently high and ever-increasing valuations.
Meanwhile, if one expects higher returns to result from nominal growth due to unchecked inflation, it’s useful to examine the behavior of valuations during inflationary periods, both in the U.S. and elsewhere. In general, stock prices durably benefit from high inflation only after valuations have been driven to depressed levels. At present, the Consumer Price Index would have to triple for the positive impact of inflation on nominal fundamentals to outweigh the likely negative impact of rapid and sustained inflation on valuations.
For more on the arithmetic that links valuations, cash flows, and long-term investment returns, see The Structural Drivers of Investment Returns. For a deep dive into profit margins and the dynamics of mega-cap glamour stocks, see Universal Capitulation and No Margin of Safety.
Finally, a note on the “innovation” story that encourages investors to believe “This time is different,” as it has in every speculative episode in history. As Business Week wrote in 1929, “This illusion is summed up in the phrase ‘the new era.’ The phrase itself is not new. Every period of speculation rediscovers it.” Amid wild extrapolations from every corner, a few observations may provide a useful reality check:
1) The largest driver of margin expansion in recent decades has not been technological innovation but falling interest rate costs, temporarily locked in by massive refinancing in 2020 and 2021;
2) The growth rates and operating margins of mega-cap glamour stocks are not fixed numbers but trajectories.
3) Long-term, economy-wide growth is, and has always been, driven by innovation and productivity, with companies at the cutting edge enjoying initially high profits and growth rates that experience recurring cycles of creative destruction as the new industries expand.
4) If total S&P 500 revenues and U.S. GDP have averaged real annual growth of less than 2.5% annually for the past 30 years, even with the benefit of all that innovation (they have), and one can demonstrate that the increase in corporate profit margins during that period is largely tied to lower interest costs (one can), it is a mistake to value the entire market at record multiples just because some of the companies enjoy network effects that give them the ability to hoard market share. The cash flows are just concentrated in fewer hands.
5) Network effects and near-monopoly can slow and defer the erosion of profit margins, but they don’t eliminate longer-term competition (every fallen mega-cap in history teaches that).
Our own investment discipline is to respond to market conditions as they change over time. The adaptations we introduced in 2021 encourage an aggressive outlook (I was frequently leveraged, for example, in the early-1990’s) or a constructive outlook (possibly with position limits or safety nets) in about two-thirds of historical periods, and over half of periods since the 2009 market low. Constructive market conditions will emerge soon enough, if only locally and sporadically at first. We do not observe those conditions here at all.
Keep Me Informed
Please enter your email address to be notified of new content, including market commentary and special updates.
Thank you for your interest in the Hussman Funds.
100% Spam-free. No list sharing. No solicitations. Opt-out anytime with one click.
By submitting this form, you consent to receive news and commentary, at no cost, from Hussman Strategic Advisors, News & Commentary, Cincinnati OH, 45246. https://www.hussmanfunds.com. You can revoke your consent to receive emails at any time by clicking the unsubscribe link at the bottom of every email. Emails are serviced by Constant Contact.
The foregoing comments represent the general investment analysis and economic views of the Advisor, and are provided solely for the purpose of information, instruction and discourse.
Prospectuses for the Hussman Strategic Growth Fund, the Hussman Strategic Total Return Fund, and the Hussman Strategic Allocation Fund, as well as Fund reports and other information, are available by clicking “The Funds” menu button from any page of this website.
Estimates of prospective return and risk for equities, bonds, and other financial markets are forward-looking statements based the analysis and reasonable beliefs of Hussman Strategic Advisors. They are not a guarantee of future performance, and are not indicative of the prospective returns of any of the Hussman Funds. Actual returns may differ substantially from the estimates provided. Estimates of prospective long-term returns for the S&P 500 reflect our standard valuation methodology, focusing on the relationship between current market prices and earnings, dividends and other fundamentals, adjusted for variability over the economic cycle. Further details relating to MarketCap/GVA (the ratio of nonfinancial market capitalization to gross-value added, including estimated foreign revenues) and our Margin-Adjusted P/E (MAPE) can be found in the Market Comment Archive under the Knowledge Center tab of this website. MarketCap/GVA: Hussman 05/18/15. MAPE: Hussman 05/05/14, Hussman 09/04/17.