

How To Survive Falling Markets


Bill Hester, CFA, CMT
Senior Research Analyst
Hussman Strategic Advisors
March 2025
One of the biggest challenges investors face today is navigating the most concentrated U.S. stock market in history, where the largest stocks represent a record share of total market value. In Slimming Down a Top-Heavy Market, I explored several long-term approaches to address this challenge, including diversifying beyond the largest stocks, adjusting sector weightings, and using the overvaluation of large growth stocks as an advantage. Some of these approaches can also be useful during periods of market loss and heightened volatility — and often outpace traditionally defensive assets like bonds and commodities.
In evaluating how well an asset can protect portfolios during stock market downturns, we will focus on two key factors. The first, not surprisingly, is performance during the downturn. Some investments may retain their value during these periods, while others may move inversely to stock market returns, providing additional protection. The second factor we’ll look at is the consistency of those returns. If an investment proves defensive in one stock market downturn but fails to provide protection in others, our confidence in its reliability should diminish.
We’ll explore these two questions across asset classes (like bonds and commodities), investment factors (like value and quality), as well as sectors and industries. When analyzing groups of stocks, we’ll net out the performance of the S&P 500 Index – essentially reflecting a hedged-equity strategy that goes long a portfolio of stocks with certain characteristics while hedging market risk with a corresponding short sale in the large cap index.
To illustrate the investment performance of various approaches during significant stock market downturns, two sets of charts will be useful. The first chart in each section measures what I call the Bear Market Cumulative Return (BMCR).
To calculate the BMCR, I’ve combined the major market downturns of the past 25 years, allowing us to determine an annualized cumulative return over a consolidated period of declining stock market performance. The horizontal axis in each BMCR chart shows the cumulative number of trading days. Replacing calendar dates with cumulative trading days can be unfamiliar, so each distinct market selloff is also color-coded: the 2000-2002 collapse of the technology bubble is in blue, the 2007-2009 financial crisis is in orange, the 2011, 2018, 2020, and 2022 downturns are in green, red, purple, and tan, respectively.
The second chart in each analysis is a color-coded grid displaying performance data. Commonly known as heatmaps, these charts are often used to illustrate calendar-year performance across different investments. Here, they will show how each investment performed during individual market retreats. Together, the BMCR graph and the performance heatmap provide a comprehensive view of how various investments have behaved during market downturns. These charts highlight both the cumulative returns of different investments and strategies through these periods, as well as their consistency over time.
Before continuing, it’s important to emphasize that the phrase “Bear Market” is used here as shorthand for steep market corrections on the order of 20%, regardless of valuations, as well as severe declines (such as 2000-02 and 2007-09) that approach or restore historically normal valuations. When we combine consecutive market declines, the analysis has the benefit of hindsight. We start from the first day of each downturn and end on its last day. The resulting returns could not be achieved in practice without knowing those dates. However, they can provide valuable insights into how different asset classes and stock groups tend to perform during periods of market decline.
While the phrase “Bear Market” is a common way to discuss significant market declines of the past, we try to avoid that term when discussing prevailing conditions. In our own discipline, we focus on aligning our investment positions with measurable characteristics such as valuation and the quality of market action that we can actually observe at each point in time.
Second, it’s important to emphasize that the performance characteristics of various securities, industries, sectors, and asset classes are not fixed. There are certain regularities that occur during deep market declines, but no investment should be considered apart from its valuation and other characteristics. As Howard Marks wrote in The Most Important Thing, “No asset is so good that it can’t be overpriced, and few assets are so bad that they can’t be underpriced.”
The wide range of “bear market” outcomes across various investments — both in total cumulative returns and consistency — can help investors tasked with understanding the performance of equity long-short strategies. As the data below suggest, the returns generated from hedged-equity approaches – holding a portfolio of stocks weighted toward certain characteristics, while hedging its market risk, can play an important role, particularly during market downturns.
Focusing our analysis on the past 25 years of market history allows us to consider a broad range of investments and strategies as alternatives to passively holding the S&P 500 Index. It also encompasses several distinct market declines, each with unique drivers: the 2000–2002 collapse caused by unsustainable valuations during the dot-com bubble, the 2007–2009 downturn triggered by the global financial crisis, the 2011 decline amidst a U.S. credit downgrade and the European debt crisis, the decline in the fourth quarter of 2018 during a period the Federal Reserve was raising short-term rates and the yield curve approached inversion, the sharp market plunge during the COVID-19 pandemic in 2020, and the 2022 decline driven by fears of rising inflation and interest rates. Together, these varied market environments will help us evaluate how different investments have performed under diverse conditions.
Asset Classes
We begin with investments generally regarded as diversifiers or defensive in nature, including global stocks, commodities, and both intermediate- and long-term debt. Specifically, the list includes U.S. Treasuries (long-term, intermediate-term, and inflation-protected), corporate credit (both investment-grade and high-yield), commodities (with gold tracked separately), and global stocks (including both developed markets outside the U.S. and emerging markets). For reference, the performance of the S&P 500 Index is also included. In this initial analysis of asset classes, returns are presented without subtracting out the performance of the S&P 500 Index.
Below is our first BMCR graph. Among the investments listed, long-term U.S. Treasuries have generally been among the best performers during stock market downturns, with an annualized BMCR of 11.8%. This represents the annualized return of holding a long-term Treasuries index throughout the five and half years of combined stock market downturn since 2000. The 2022 downturn, which began from a 10-year Treasury yield of just 1.6%, was a clear exception.
The second-best performer was intermediate-term Treasuries, with a BMCR of 7.4%. Gold and Treasury Inflation-Protected Securities (TIPS) also had positive BMCRs over the last six downturns
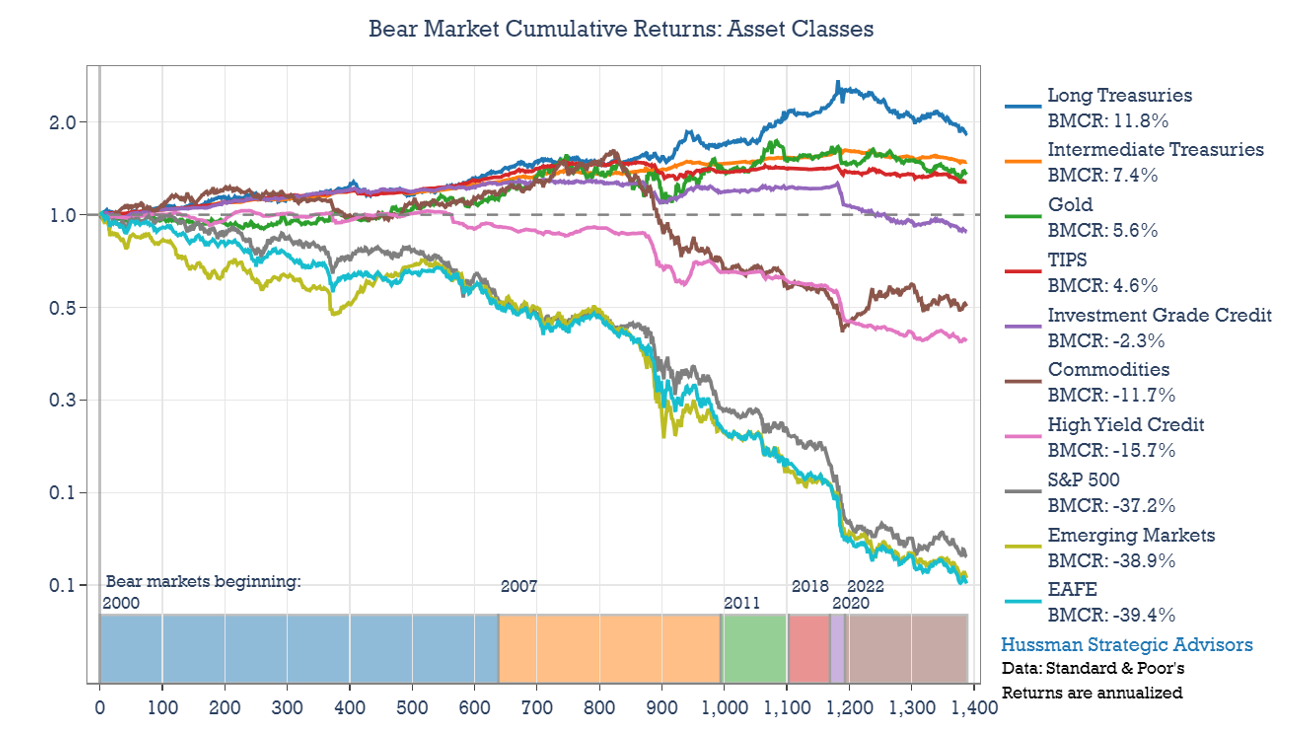
During the combined bearish periods, the S&P 500 Index declined at an annualized rate of -37.2%. Other global developed stocks and emerging markets experienced similar levels of drawdown. Investment Grade Credit, Commodities and High Yield Bonds had annual BMCRs of -2.3%, -11.7% and -15.7%, respectively.
Below is the performance heatmap for asset classes. Each column illustrates how individual asset classes performed during the last six bearish downturns. Long-term U.S. Treasuries performed well in the first five. However, the 2022 downturn was an exception, as long-term U.S. Treasury bonds fell by 28%. To put that decline into perspective, emerging market equity indexes fell by less than long-term U.S. Treasuries during the 2022 swoon. Intermediate Treasuries, TIPS, Investment-Grade Credit, and Gold regularly finished near the top of the best performing assets during the last six bear downturns.
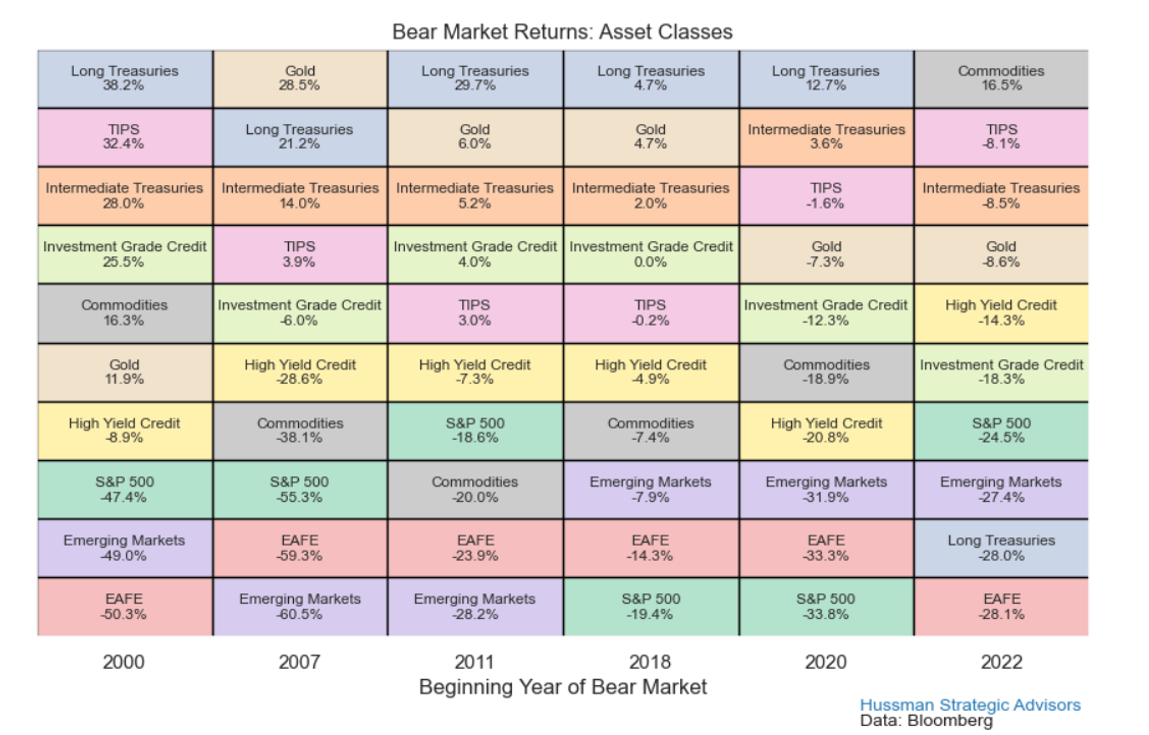
To summarize performance across asset classes during steep market declines: long-term Treasuries had the strongest overall returns but were among the worst performing assets during the 2022 decline. Intermediate-term Treasuries had a BMCR of 7.4% with good consistency, ranking among the top three performers in each bear market. Inflation-protected Treasuries also performed well and were relatively consistent. Gold demonstrated similar consistency, finishing in the top half of investments in five of the six declining markets. However, it experienced a 31% drawdown in the second half of the financial crisis after an initial strong rally.
Commodities and corporate bonds experienced negative returns overall. Commodities and High Yield bonds had significant drawdowns from peak levels during the financial crisis. High-yield credit declined 35% from its peak, while commodities dropped 57%. Meanwhile, the EAFE and Emerging Markets indexes suffered losses at rates comparable to the S&P 500 Index and consistently ranked among the worst-performing investments.
Investment Styles
In Slimming Down a Top-Heavy Market, I showed that during periods that followed elevated stock market valuations, portfolios that were long groups of undervalued stocks and short a large-cap index like the S&P 500 Index exhibited strong long-term return-to-risk characteristics. These kinds of “hedged equity” strategies can also be remarkably effective during bear markets. While this concept may not be surprising, the extent of their historical outperformance during downturns may be.
We will begin with investment styles like Value, Momentum, and Quality. Leading this list are low volatility stocks, which had a BMCR of 26.7%. This is our first look at how robust some of these results can be. The Quality Index – typically made up of stocks with high profitability and consistent earnings – was ranked second with a BMCR of 14%. An index of high dividend payers had a BMCR of 8.2%, roughly in line with investments in intermediate-term Treasuries. Mid-caps, small-caps, and an equal-weighted version of the S&P 500 Index had modestly positive BMCR’s.
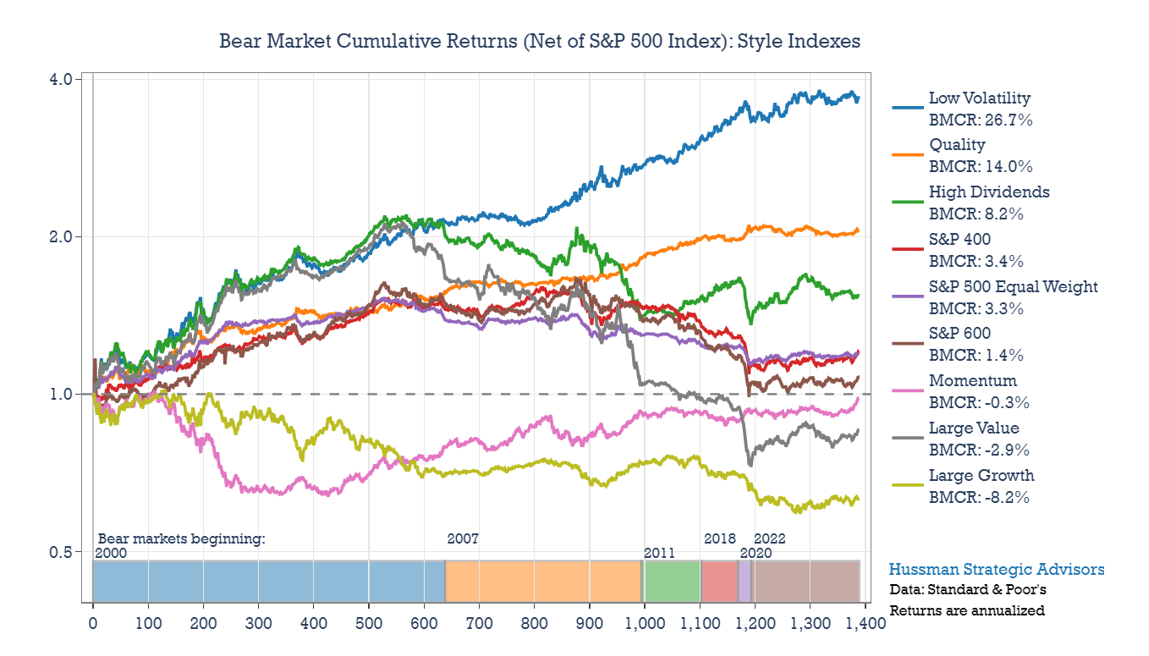
Not surprisingly, Large Growth stocks had the lowest BMCR, at -8.2%. Large Value stocks demonstrated strong relative performance in the first and last market selloffs but struggled during the four in-between. Over the full period, the momentum strategy lagged the S&P 500 Index. But most of its under-performance occurred during the initial phase of the Tech Bubble collapse. In the last five steep market declines, however, it has performed in line with other investment styles.
Low volatility stocks not only achieved the highest BMCR but also demonstrated impressive consistency. This category of stocks finished as the top-performing strategy in the first four market selloffs and held the third spot during the last two downturns. Quality stock indexes were also consistent, finishing in one of the top four spots in all of the bear markets except for the most recent one. High dividend stocks were more consistent than holding mid-cap or small-cap stocks, or an equal-weighted version of the S&P 500 Index. The consistency of those latter groups has been middling.
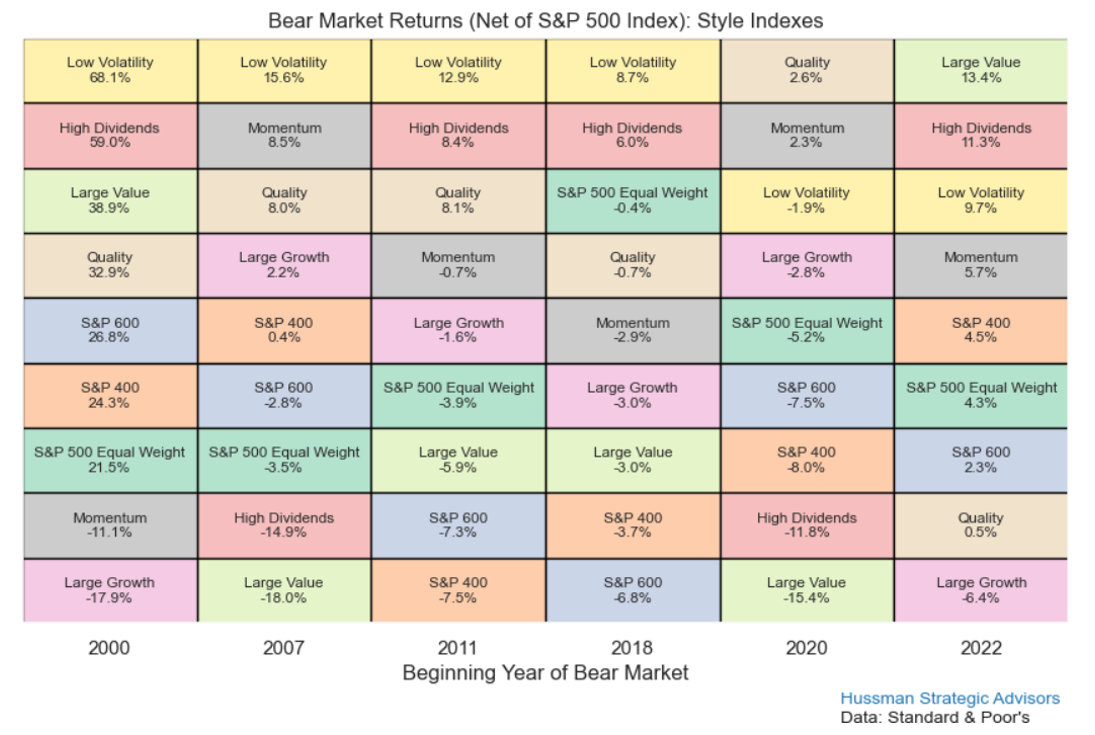
To summarize performance across investment styles during steep market declines: a long position in low-volatility stocks hedged with a short position in the S&P 500 Index resulted in a BMCR of 26.7% — a significant increase compared to holding Treasuries. Quality stocks also performed well, with a BMCR of 14%. Large value stocks were less consistent. They enjoyed strong relative returns in the bear markets beginning in 2000 and 2022 but struggled during the 2007–2009, 2011, 2018, and 2020 downturns.
Sectors
Shifting from investment styles to sectors, BMCRs become even more divergent. Consumer staples stocks had a BMCR of 36.4% over-and-above the performance of the S&P 500 Index, the highest among the sectors. Healthcare followed, with a BMCR of 23.5% measured relative to the S&P 500. Underperforming sectors include the financials and technology groups. The financial sector, which was at the center of the financial crisis, posted the second-lowest BMCR at -11.2%. Information Technology, a sector which regularly gets bid up to unsustainable valuations prior to major market declines, was the worst performer, with a BMCR of -16.2%. For portfolios heavily weighted in tech stocks this is a crucial figure – even hedging the technology stock portion of a portfolio with a short position the S&P 500 Index during the last major market declines still resulted in an annualized loss of 16%.
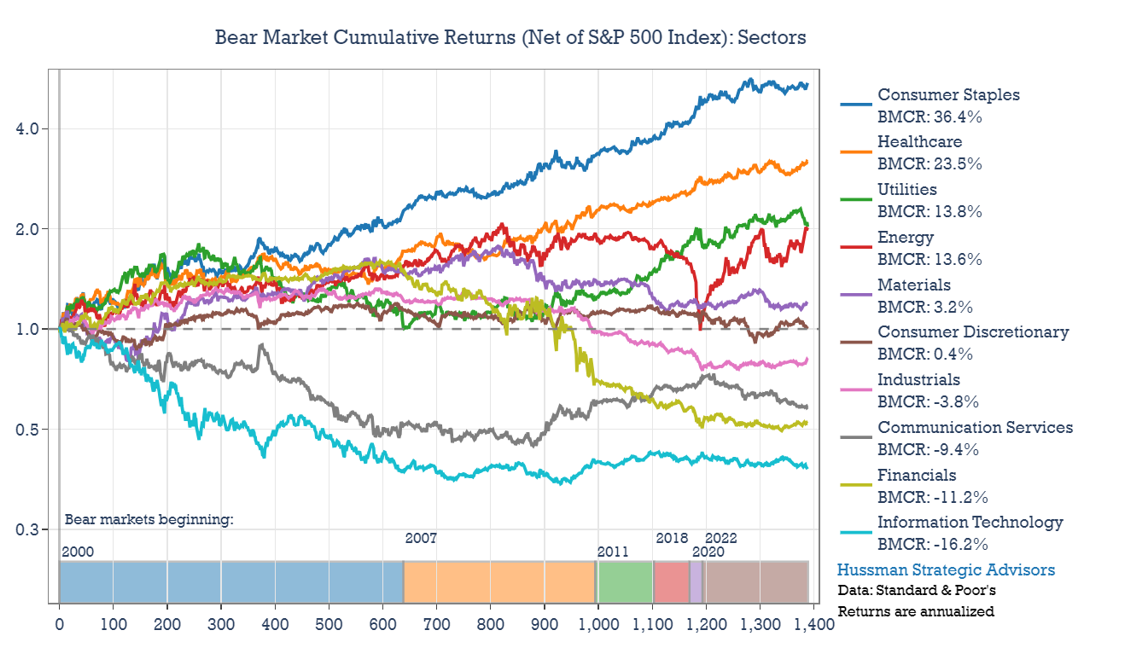
A 36.4% BMCR over the S&P 500 is reason enough to consider a hedged allocation to Consumer Staples during market downturns. Moreover, this strategy achieved strong returns with impressive consistency. It finished in first or second place in all 6 declines. During the 639-day tech bust from 2000 to 2002, while technology stocks plummeted 82%, telecom stocks dropped 74%, and the S&P 500 Index declined 47%, the Consumer Staples Index gained 31% – outperforming the large-cap benchmark by a remarkable 78%.
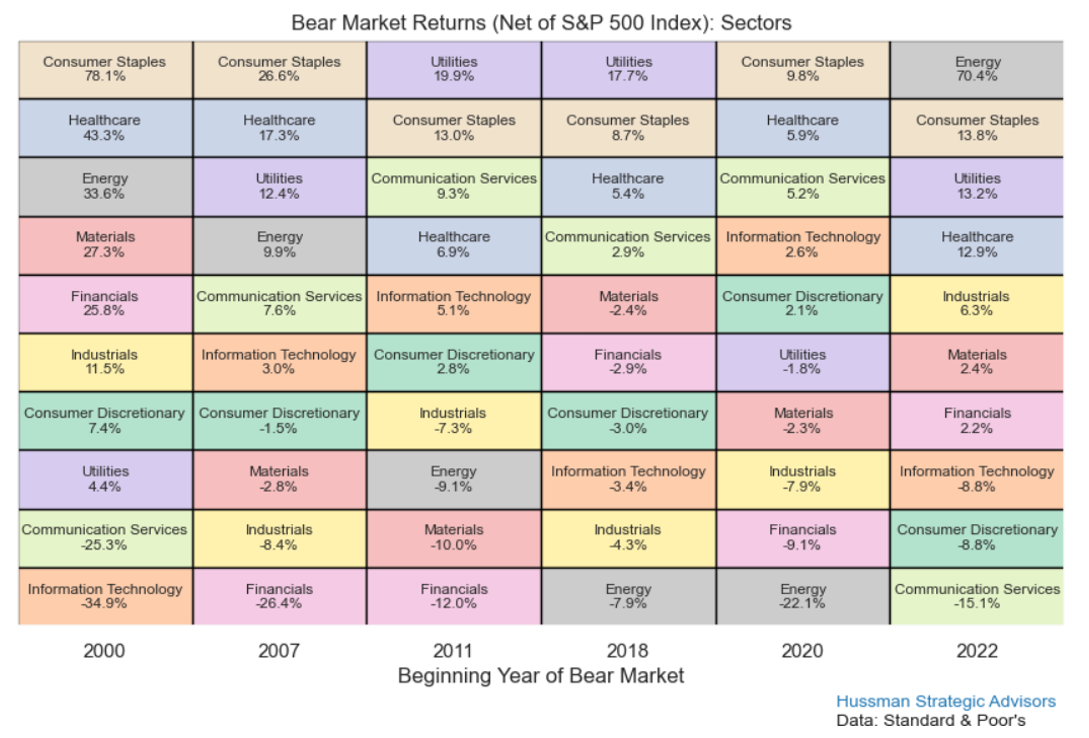
During steep market declines, investors seem to particularly favor Consumer Staples stocks, relative to investment styles such as low volatility and dividend payers. Another standout has been the Healthcare sector. In contrast, energy has been one of the most erratic sectors, finishing last in 2018 and 2020 before claiming the top spot in 2022. Technology and financial stocks not only posted particularly weak BMCRs overall, but were also inconsistent.
This analysis can also be extended to industries. With 24 industries, the BMCR graph and performance heatmap can become unwieldy, but certain industries stand out and are worth mentioning. Leading the list is the Food, Beverage, and Tobacco Index, with a BMCR of 38.5%. Next is the Household and Personal Products Index, posting a BMCR of 33.5%. Rounding out the top three is the Healthcare Equipment and Services Index, with a BMCR of 20.6%.
Why Hedged Equity Strategies Often Perform Well in Down Markets
One of the key reasons some of the hedged equity strategies discussed above generate strong returns during steep market declines lies in the concept of return contribution. This concept is straightforward: the performance of a market-cap weighted index over a given period of time is typically driven by its largest constituents – whether categorized by style, sector, industry, or individual stocks. This dynamic holds true in both rising and falling markets. However, when the largest stocks become oversized and overvalued, strong relative value opportunities often emerge elsewhere. And because stocks typically decline more rapidly in bear markets than they rise in bull markets, the effects of relative return contribution often go into over-drive during stock market downturns.
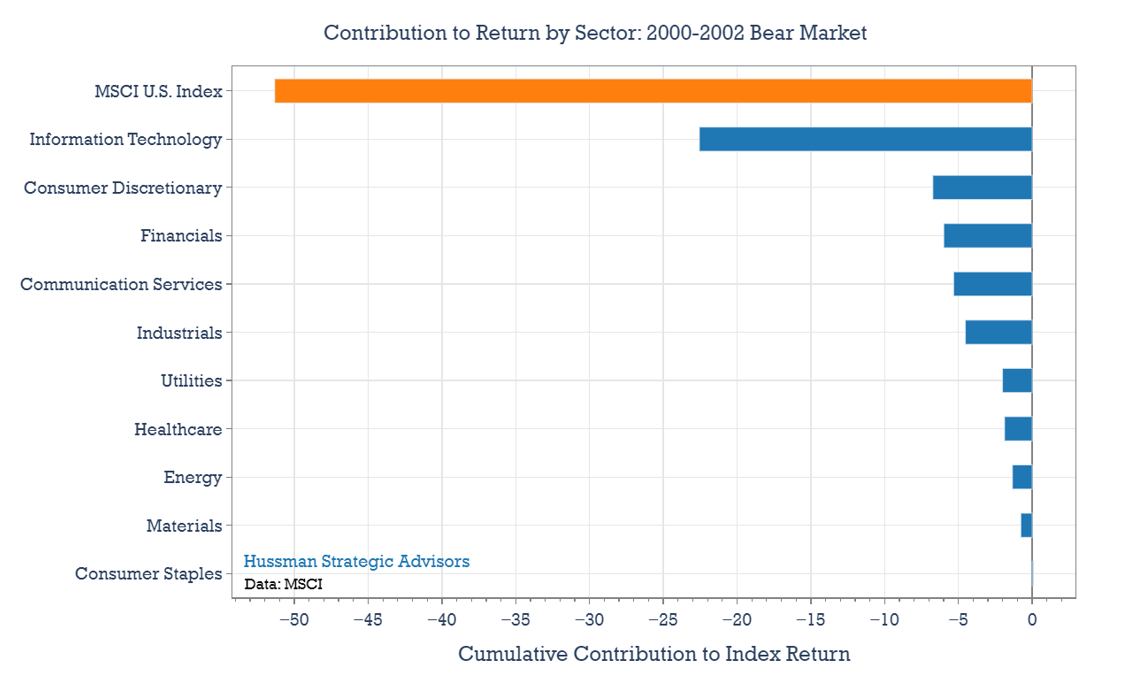
When the technology bubble burst in 2000, the MSCI U.S. Index declined 51% by its October 2002 low. The orange bar in the chart below highlights this overall performance, while the blue bars represent the contribution of each sector to the index’s total return – illustrating how much each sector drove the 51% decline. Unsurprisingly, the largest contributor was the Information Technology sector, which fell 82% during this bear market and accounted for nearly 23 percentage points of the index’s overall decline.
At the market’s peak, the Information Technology sector made up about a third of the index. Yet, it was responsible for 44% of the index’s total decline. That’s what can happen when “return contribution” goes into reverse.
It’s not just a sector’s weight that matters — starting valuations play a crucial role as well. This is why speculative market advances that end with certain sectors being both oversized and overvalued can create particularly strong entry points for hedged equity strategies.
The graph below illustrates the relationship between beginning valuations and each sector’s eventual contribution to the overall decline in the MSCI U.S. Index. The vertical axis represents starting valuations, which are measured by each sector’s price-to-sales ratio in March 2000 relative to its own prior 10-year median. The horizontal axis shows each sector’s subsequent contribution to the overall index decline, expressed as a percentage of total sector contributions.
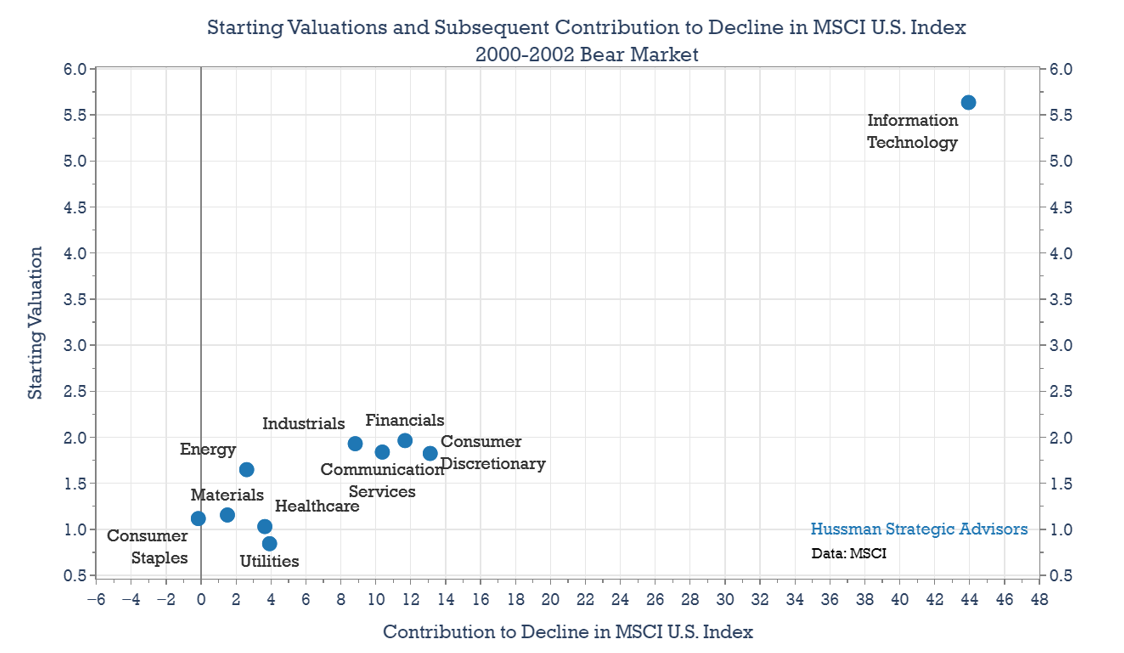
This relationship between starting sector valuation and return contribution doesn’t hold in every market downturn. During short, steep market downturns most stocks take on a beta of one (losing roughly the same amount as the overall index) because selling tends to be fairly uniform. However, when significant market declines begin with wide disparities in relative valuations — such as today — and unfold gradually over months or quarters, as seen in 2000–2002 and 2022, the relationship between starting valuations and downside return contribution tends to hold surprisingly well.
With these concepts in mind, we can get a sense of what the internal dynamics of the next significant market decline might look like. A sector’s weight offers an initial estimate of its potential impact on the overall index’s return during a market decline. Valuations then help determine whether a sector punches above or below its starting weight.
The chart below compares each sector’s weight at the start of the 2000-2002 market collapse with its contribution to the subsequent decline in the index (expressed as a percentage of total sector contributions). The blue dots represent sector weights as of March 2000, while the red dots indicate each sector’s share of the total loss by the end of the market decline. If a red dot appears to the right of its corresponding blue dot, the sector contributed more to the decline than expected based on its initial share of index capitalization. If a red dot appears to the left, the sector’s decline was less than its starting weight would have suggested.
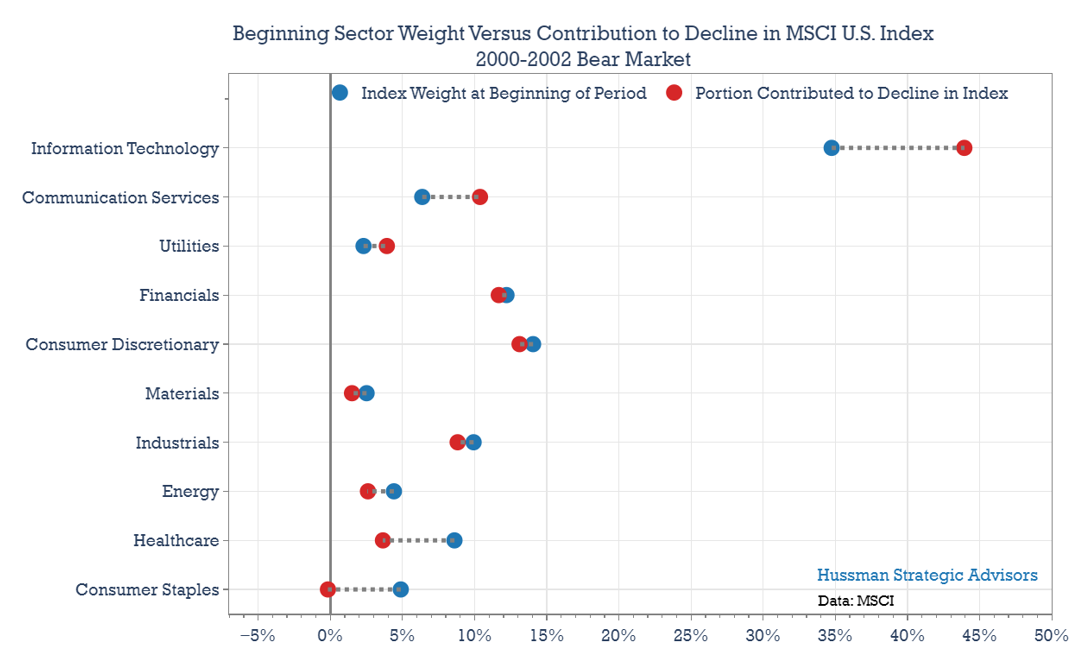
In the 2000–2002 market plunge, Information Technology had an outsized impact, contributing significantly more to the decline than its initial weight suggested. It entered the downturn making up 34% of the index but accounted for 44% of the total decline. Similarly, Communication Services, which made up 6% of the index at the start, contributed 11% to the overall drop. Conversely, sectors that have historically been more resilient during bear markets — such as Consumer Staples and Healthcare — held up better than their initial weights would have suggested. And as shown in the sector performance heatmap above, this pattern of relative outperformance has remained surprisingly consistent across individual bear markets.
Current sector weights are remarkably similar to the weights at the peak of the market in 2000 (and in 2022). The Information Technology Index made up 33% of the MSCI U.S. Index at its peak this year, in line with the 35% of the index it reached in 2000. Together, Technology, Communication Services, and Consumer Discretionary made up 55% of the Index at this year’s peak. Consumer staples stocks make up just 5% of the Index.
Although the charts above focus on the 2000–2002 market plunge, similar patterns emerged during the 2022 downturn. Of the MSCI U.S. Index’s 26% decline in 2022, the technology sector alone accounted for 40% of the drop. Collectively, the Technology, Communications Services, and Consumer Discretionary sectors were responsible for 71% of the total decline.
Current sector valuations suggest that the relative contributions to the next stock market decline may be similar to the 2000-2002 and 2022 selloffs. The Consumer Staples Index now trades at 1.6 times sales, compared with 2.1 times sales back in 1999. While neither number is cheap for this sector on a historical basis, Consumer Staples stocks are currently trading at lower valuations than they did at their peak in 2000. Meanwhile, the Information Technology Index peaked at a vertigo-inducing 10 times sales in December, surpassing it’s 2000 peak of 7.8. The 7.8 times price-to-sales ratio proved unsustainable, and over the following 13 years the sector averaged a price to sales ratio of just 2.5.
Considering all of this, the internal dynamics of the next significant market decline could reasonably mirror those of the 2022 and 2000–2002 downturns, with the Technology, Communication Services, and Consumer Discretionary sectors accounting for approximately 70% of the decline — significantly more than their 55% weight. Meanwhile, the Consumer Staples and Healthcare sectors could end up contributing less to the decline than their initial weights would suggest. In recent weeks, Consumer Staples have declined by about 4% and Healthcare stocks are down 1%. Tech stocks have fallen by about 12%.
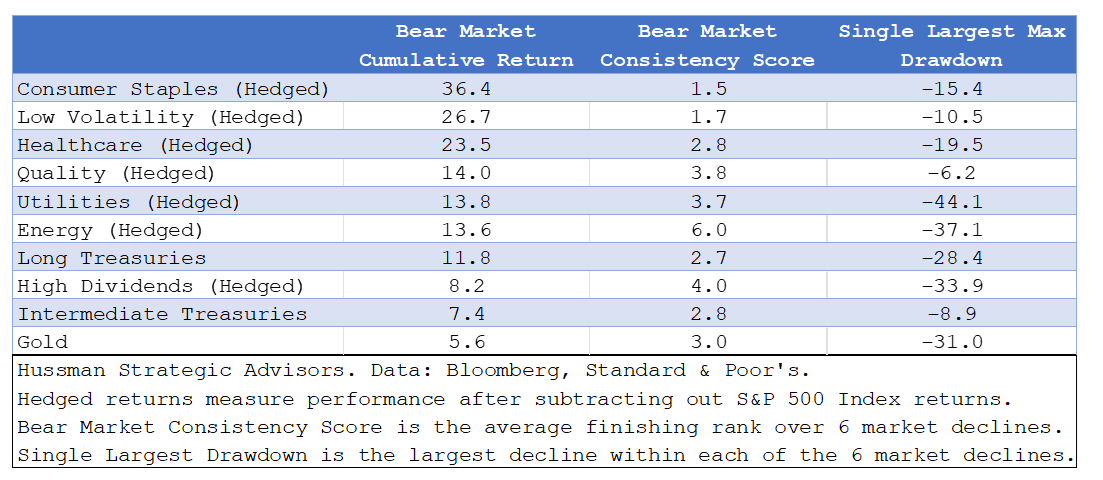
The table below ranks the overall performance ranking of the strategies discussed above. It includes the results of our analysis of asset classes and hedged positions in investment styles and sectors. Again, it’s important to emphasize that the performance characteristics of various securities, industries, sectors, and asset classes aren’t fixed. The table simply shows certain regularities that tend to occur during deep market declines.
The first column shows the BMCR for each investment or strategy. The second column, the Bear Market Consistency Score, represents the average finishing position of each investment across the six bear markets – a lower number indicates more consistent performance. The final column displays the worst maximum drawdown for each investment over the six significant market declines.
Navigating challenging market conditions requires an understanding of how different asset classes, investment styles, and sectors perform during periods of heightened volatility. While traditional defensive assets like Treasuries have provided protection in some downturns, their effectiveness has been inconsistent. Hedged-equity strategies that hold stable, reasonably-valued, high-quality stocks — particularly weighted toward defensive sectors like Consumer Staples and Healthcare, can be particularly useful to investors during periods of market loss and heightened volatility.
Keep Me Informed
Please enter your email address to be notified of new content, including market commentary and special updates.
Thank you for your interest in the Hussman Funds.
100% Spam-free. No list sharing. No solicitations. Opt-out anytime with one click.
By submitting this form, you consent to receive news and commentary, at no cost, from Hussman Strategic Advisors, News & Commentary, Cincinnati OH, 45246. https://www.hussmanfunds.com. You can revoke your consent to receive emails at any time by clicking the unsubscribe link at the bottom of every email. Emails are serviced by Constant Contact.
The foregoing comments represent the general investment analysis and economic views of the Advisor, and are provided solely for the purpose of information, instruction and discourse.
Prospectuses for the Hussman Strategic Market Cycle Fund, the Hussman Strategic Total Return Fund, and the Hussman Strategic Allocation Fund, as well as Fund reports and other information, are available by clicking Prospectus & Reports under “The Funds” menu button on any page of this website.
The S&P 500 Index is a commonly recognized, capitalization-weighted index of 500 widely-held equity securities, designed to measure broad U.S. equity performance. The Bloomberg U.S. Aggregate Bond Index is made up of the Bloomberg U.S. Government/Corporate Bond Index, Mortgage-Backed Securities Index, and Asset-Backed Securities Index, including securities that are of investment grade quality or better, have at least one year to maturity, and have an outstanding par value of at least $100 million. The Bloomberg US EQ:FI 60:40 Index is designed to measure cross-asset market performance in the U.S. The index rebalances monthly to 60% equities and 40% fixed income. The equity and fixed income allocation is represented by Bloomberg U.S. Large Cap Index and Bloomberg U.S. Aggregate Index. You cannot invest directly in an index.
Estimates of prospective return and risk for equities, bonds, and other financial markets are forward-looking statements based the analysis and reasonable beliefs of Hussman Strategic Advisors. They are not a guarantee of future performance, and are not indicative of the prospective returns of any of the Hussman Funds. Actual returns may differ substantially from the estimates provided. Estimates of prospective long-term returns for the S&P 500 reflect our standard valuation methodology, focusing on the relationship between current market prices and earnings, dividends and other fundamentals, adjusted for variability over the economic cycle. Further details relating to MarketCap/GVA (the ratio of nonfinancial market capitalization to gross-value added, including estimated foreign revenues) and our Margin-Adjusted P/E (MAPE) can be found in the Market Comment Archive under the Knowledge Center tab of this website. MarketCap/GVA: Hussman 05/18/15. MAPE: Hussman 05/05/14, Hussman 09/04/17.