|
|
||||||
|
|

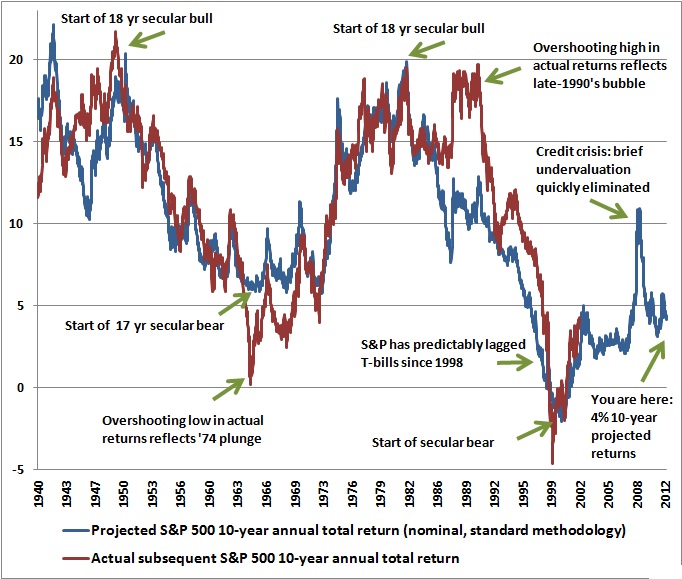
March 26, 2012 A False Sense of Security "The world economy has stepped back from the brink and we have causes to be a little bit more optimistic. But optimism should not give us a sense of comfort and certainly should not lull us into a false sense of security." IMF Managing Director Christine Lagarde, March 17, 2012 As we examine the present evidence relating to both the financial markets and the global economy, the aspect that strikes us most is the extent to which Wall Street continues to emphasize superficially positive data in preference for deeper analysis, to extrapolate short-term distortions as if they were long-term trends, and to misconstrue freshly printed wallpaper and thin supporting ice as if they were solid walls and floors. Two propositions we heard last week were characteristic of this false sense of security. One was a remark by an analyst that stocks were in a "secular bull market" here. The other was a Wall Street "factoid" being passed around, suggesting that the "equity risk premium" on stocks has never been higher. Let's address these in turn. When people talk about bull and bear markets, they often use the terms "cyclical" and "secular." One cyclical bull and one cyclical bear market comprise the normal garden-variety market cycle of about 5 years in duration (though with quite a bit of variation around that norm, see "notes on secular and cyclical markets" in Hanging Around, Hoping to Get Lucky ). Taking very broad averages, a cyclical bull market lasts about 3.75 years, averaging a trough-to-peak gain of about 150%, and a cyclical bear market lasts about 1.25 years, averaging a decline of just over 30% from peak-to-trough. If you do the compounding, you'll observe that the typical bear market wipes out more than half of the preceding bull market gain. However, those averages mask an additional source of variation, which depends on "secular" conditions. If you examine market history as far back as the late-1800's, you'll find that market valuations have moved in broad advancing and declining phases, with each phase lasting about 17-18 years in duration (that still should be treated only as a tendency, and there's no reason I know for treating it as a magic number). As an example, stocks moved from extremely low valuations in 1947 to quite rich valuations by 1965, producing a long "secular" bull market where each successive cyclical bull market topped out at higher and higher valuation multiples. In contrast, from 1965 to 1982, valuation multiples went through a long contraction, where each successive cyclical bear market bottomed out at lower and lower valuation multiples. The effect of these longer valuation "waves" is this: during long secular bull phases, the cyclical bull markets tend to be longer and more rewarding, and the cyclical bear markets tend to be shorter and less damaging. In secular bulls, the market is running with the wind at its back. The secular bull market period from 1982 through 2000 was a good example of this tendency. In contrast, during long secular bear phases, the cyclical bull markets tend to be shorter and less rewarding, while the cyclical bear markets tend to be longer and more violent. In secular bears, the market is swimming against the tide. The secular bear period that began in 2000 has been a good example of this tendency. As Nautilus Capital observes, the average cyclical bull market in a secular bear market period has produced an average gain of only about 85%, lasting less than 3 years on average. In contrast, the average cyclical bear in a secular bear has been unusually violent, averaging a 39% loss over a span of about a year and a half. Compound the two, and that's enough damage to drag the cumulative full-cycle return down to just 13%, on average. Needless to say, the assertion that stocks are in a "secular" bull market is really an assertion that investors can let down their guard, in the sense that downturns are likely to be muted and advances will be extended. But from our standpoint, if you're going to pick a secular team, it would be best to have reliable data to back up the choice. So what distinguishes a secular bull from a secular bear? Valuations. Not just any valuation measure however - it's important to demonstrate that the valuation measure you choose actually has a strong and demonstrable long-term relationship with subsequent market returns (which is where Wall Street's disingenuous use of toy models like simple price-to-forward earnings multiples and the "Fed Model" makes us nearly apoplectic). Below, I've annotated our usual valuation chart to provide a better sense of what drives the long "secular" movements in the stock market. The chart uses our standard valuation methodology to estimate prospective market returns. It should be quickly evident that secular bull markets don't simply come out of the blue. They emerge precisely because stocks become priced to achieve extraordinarily high long-term returns. Both the 1947-1965 secular bull and the 1982-2000 secular bull began at points where stocks were priced to achieve 10-year returns of close to 20% annually. In contrast, the 1965-1982 secular bear began with prospective 10-year returns of just 5.9% (though slightly higher than the 4.4% yield on Treasury bonds at the time), and of course, the secular bear that began in 2000 emerged from bubble valuations, where we projected negative 10-year total returns at the time.
It seems to be an article of faith among some analysts that the 2009 low represented the start of a new secular bull market, but two features are noteworthy. The first is that the valuation achieved in 2009 was nowhere near the valuation that typically ushers in a new secular bull market. The second is that the brief undervaluation we observed in 2009 was quickly eliminated. At present, we project total returns for the S&P 500 of just over 4% annually over the coming decade. This is even worse than the valuation where the 1965-1982 secular bear started (though certainly less extreme than the 2000 peak). Though interest rates are lower today than in the 1965-1982 period, satisfactory returns from present levels will require investors to sustain rich valuations indefinitely. Again, it's worth emphasizing that our standard valuation methods are (and have remained) well-correlated with subsequent market returns - a very basic criterion that is painfully lacking among many popular valuation measures such as the Fed Model. It strikes me as absolutely bizarre that so many Wall Street "professionals" offer up the Fed Model and the "forward operating earnings times arbitrary multiple" approach so freely, when it takes nothing but some data and a few hours of effort to demonstrate that those approaches are nearly worthless (see for example the August 20, 2007 comment Long Term Evidence on the Fed Model and Forward Operating P/E Ratios - not that many analysts agreed with our valuation concerns at that point either). A related assertion we've heard a lot lately is that "the equity risk premium on stocks has never been higher." In the finance literature, the "equity risk premium" is essentially the return that stocks are priced to achieve, in excess of the risk-free interest rate. Of course, these estimates vary wildly depending on the method you use (many common ones which, again, have virtually no correlation with actual subsequent returns). A few popular methods include 1) the Fed Model (forward operating earnings yield minus the 10-year Treasury yield); 2) dividend yield plus projected earnings growth, minus the 10-year Treasury yield; 3) historical stock returns minus the 10-year Treasury yield, which is a particularly misleading measure of the returns stocks are priced to achieve in the future, or; 4) any of the above using the prevailing T-bill yield instead of 10-year yields. Among the problems with these typical approaches is that stocks are not 3-month or 10-year instruments, but have a duration that is essentially the inverse of the dividend yield (so at present, the duration of stocks is roughly 50 years, compared with a 10-year Treasury, which has a duration closer to 7 years). So the appropriate "risk free" return in these estimates should really be either a Treasury yield of equivalent maturity - none which are available, or at least an estimate of the average expected short-term risk free rate expected over the same horizon. Needless to say, estimates of the equity risk premium get a false benefit if you use today's unusually suppressed, short-duration risk-free rates. The larger difficulty is the estimate of the prospective return on stocks. If you want to use a 10-year Treasury yield as a benchmark, you would also want to use a 10-year projected return for the S&P 500. On that note, and using reliable valuation methods (see above), the difference between the expected 10-year total return on stocks and the 10-year Treasury yield is presently less than 2% (nominal). How does this compare historically? It's notable that the estimated equity risk premium was severely negative during the late-1990's market bubble. Not surprisingly, stocks have performed terribly versus risk-free Treasuries as a result. Excluding bubble-era data, we estimate that the normal historical equity risk premium (on a 10-year horizon) has been just over 6%, reaching 17% in the late-1940's as a secular bull market was beginning, and holding in the 5-9% range even during the high-inflation 1970's. Including the late-1990's bubble period in the calculation brings the average down to just over 4.5%. When has the equity risk premium been as low as it is today? Prior to the late-1990's bubble period, the estimated equity risk premium has been below 2% only during the two-year period leading up to the 1929 peak, between 1968-1972 (when the equity risk premium finally normalized as a result of the 1973-1974 market plunge), and briefly in 1987, before the market crash of that year. We know how each of these periods ended. The only real variation is in how long the preceding overvaluation was sustained. Profit margins and a false sense of security One of the aspects of the market that is most likely to confuse investors here is the wide range of opinions about valuation, with some analysts arguing that stocks are cheap or fairly valued, and others - including Jeremy Grantham, Albert Edwards, and of course us - arguing that valuations are very rich. The following chart may help to bridge that gulf. Essentially, analysts who view stocks as "cheap" here are invariably basing that conclusion on current and year-ahead forecasts for earnings. In contrast, analysts who view stocks as richly valued are typically those who view stocks as a claim not on this years' or next years' earnings, but instead are a claim on a long-term stream of deliverable cash flows. Simply put, there is presently a massive difference between short-horizon earnings measures and longer-term, normalized earnings measures. What's going on here is that profit margins have never been wider in history. But profit margins are also highly cyclical over time. The wide margins at present are partly the result of deficit spending amounting to more than 8% of GDP - where government transfer payments are still holding up nearly 20% of total consumer spending, and partly the result of foreign labor outsourcing (directly, and also indirectly through imported intermediate goods) which has held down wage and salary payouts. Indeed, the ratio of corporate profits to GDP is now close to 70% above its long-term norm. Now, if you look at the red line (right scale, inverted), you'll notice that unusually high profit shares are invariably correlated with unusually low growth in corporate profits over the following 5-year period. Thanks to continuing deficits and extraordinary monetary interventions, this effect has been largely postponed in recent years, allowing profits to expand to present extremes. We are not arguing that profit margins necessarily have to decline over the near-term, and our concerns don't rest on the assumption that they will. It is sufficient to recognize that the bulk of the value of any stock is not in the early years of earnings, but in the long tail of future cash flows - especially if payouts are low. Stocks are essentially 50-year instruments here in terms of the cash flows that are relevant to their valuation. There are a lot of factors and quiet math that affect the P/E multiple that can be appropriately applied to earnings. Slapping an arbitrary multiple onto elevated earnings reflecting extraordinarily inflated profit margins ignores all of it.
The upshot is that if investors are willing to believe (without the use of off-label hallucinogens) that current profit margins are the new normal, and will be sustained indefinitely, then Wall Street's valuations based on current and forward earnings estimates can be taken at face value. This assumption of a permanently high plateau in profit margins is quietly embedded into every discussion of "forward earnings" here. As a side note, analysts continue bemoan the "inexplicable" gap between the economic malaise of "Main Street" and the optimism of Wall Street. Compare the previous graph to the one below, which shows how the "Muppets" are doing (and people wonder why I'm cynical about corporate culture). An economy that is this far out of balance is one that is unlikely to avoid toppling over to some extent. Capitalism and free markets work, and America remains the most creative and innovative nation on the planet, but until policy makers and regulators wake up, it will be impossible to escape the long-term consequences of distorted markets, reckless bubble-seeking Fed Chairmen, repressively low interest rates that penalize saving and lower the bar for productive investment, a self-serving financial system, and bailouts that remove all consequences for misallocating capital that could otherwise create jobs and raise living standards.
The iron law of equilibrium A final observation. We continue to hear endless variations of this comment - "The Fed is creating huge amounts of money, and all of that money has to go somewhere." Actually no, it does not. The iron law of equilibrium is that once a security is issued - whether that piece of paper is a share of stock, a bond certificate, or a dollar bill - that security has to be held by someone in exactly that form, and in no other form, until it is retired. If IBM issues one share of stock, that share of stock can change hands between any number of people, but someone has to hold that share until it is retired. If the Fed creates a dollar of base money, that base money can change hands between any number of people, but someone has to hold that dollar until it is retired. There is no "getting out" of cash and into stocks in aggregate. There is only an exchange of ownership between existing pieces of paper that will each continue to exist until each is retired. So the proper question isn't where all of these pieces of paper will go - they still have to be held by someone exactly as they are. They may change hands, but in equilibrium, they don't go anywhere. They can't go anywhere in aggregate. The only real question is this: how low do you have to drive the returns on all other competing assets until the "someone" holding that dollar bill has no incentive to try to trade it for some other piece of paper? This, precisely this, and only this, is what the Fed is manipulating with its massive interventions. By creating enormous amounts of paper, and hoarding higher duration securities like Treasury securities, the Fed is trying to force investors into risky assets until the prospective returns on all competing assets are driven so low that investors and banks holding cash are willing to just sit on it. In short, the Fed has focused its efforts on creating a bubble in risky assets, on the misguided, semi-psychotic, and empirically disprovable notion that this will make people feel wealthier and get them to spend and borrow - despite the fact that their incomes can't support it without massive government transfer payments. Aside from periodic jolts of enthusiasm that release some amount of pent-up demand for a few months at a time, what this policy has actually produced is near-zero prospective returns on nearly every class of assets. These assets will now go on to actually achieve tepid returns for an extended period of time, provided that things work out well, and a collapse in the prices of risky assets if investors ever get the inclination to demand a normal return as compensation for the risk they are taking. Market Climate The Market Climate for stocks remains characterized by an unusually hostile set of indicator syndromes, most notably, an "overvalued, overbought, overbullish, rising-yields" syndrome that has historically been unfavorable for stocks regardless of prevailing Fed policy or trend-following indicators. Even in recent years, the effect of Fed policy and other interventions has been evident after significant market weakness (essentially limiting the follow through and helping to re-establish rich valuations), but those interventions have not prevented the weakness itself - not in 2007-2009, not in 2010, and not in 2011. Our primary risk estimates are now in the worst 0.5% of what we observe in historical data. We have increasingly used the word "warning" in our weekly comments for that reason. Strategic Growth and Strategic International remain fully hedged. Strategic Dividend Value is hedged at 50% of the value of stocks held by the Fund, which is its most tightly hedged stance. Strategic Total Return maintains a generally conservative stance as well, with a duration of just under 3 years in Treasuries, and about 5% of assets allocated between precious metals shares, utility shares, and foreign currencies. I strongly expect that we will have significantly better opportunities to accept financial risk in expectation of return than the near-zero prospects the Federal Reserve has forced upon investors at present. Meanwhile, our economic concerns persist, as detailed last week and in prior comments. Despite a low-level rebound in various coincident measures, we continue to observe general weakness in the most informative leading measures (as we saw again in data from Europe and China last week as well). Based on the typical lead-time of these measures, we are now in a window where we would expect deteriorating coincident data over the coming 2-3 months. As I've noted in prior comments, to the extent that we observe economic data coming in better than expected during this window, the inferred state of the economy is likely to improve, and we would then be able to suspend our recession concerns. Regardless, it's important to recognize that our defensiveness about the stock market here is distinct from those economic concerns, and our risk estimates would remain quite high (based on factors including the prevailing overvalued, overbought, overbullish, rising-yields syndrome), even if we were to zero out our recession concerns.--- The foregoing comments represent the general investment analysis and economic views of the Advisor, and are provided solely for the purpose of information, instruction and discourse. Prospectuses for the Hussman Strategic Growth Fund, the Hussman Strategic Total Return Fund, the Hussman Strategic International Fund, and the Hussman Strategic Dividend Value Fund, as well as Fund reports and other information, are available by clicking "The Funds" menu button from any page of this website. |
|||||||||||||||||||||||||
|
For more information about investing in the Hussman Funds, please call us at
1-800-HUSSMAN (1-800-487-7626) 513-326-3551 outside the United States Site and site contents © copyright Hussman Funds. Brief quotations including attribution and a direct link to this site (www.hussmanfunds.com) are authorized. All other rights reserved and actively enforced. Extensive or unattributed reproduction of text or research findings are violations of copyright law. Site design by 1WebsiteDesigners. |