|
|
||||||
|
|

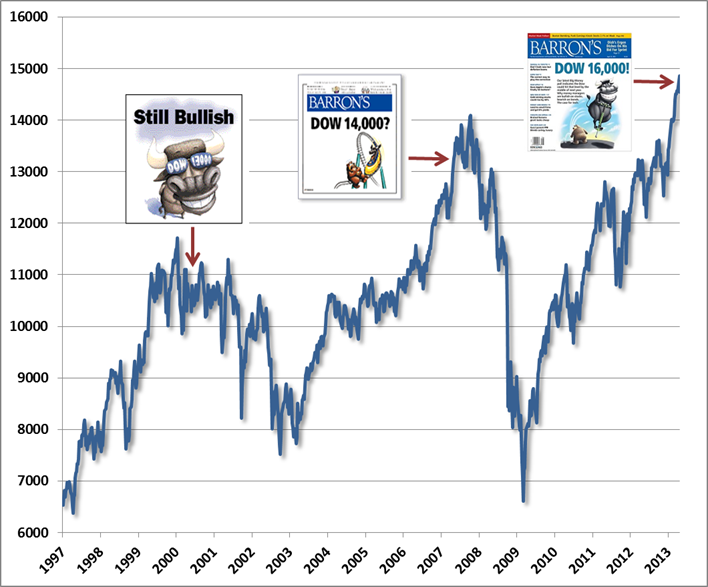
April 22, 2013 The Endgame is Forced Liquidation “The stock market isn't the only thing that has set records this spring. Barron's semiannual Big Money poll of professional investors also is setting a record -- for bullishness, that is. In our latest survey, 74% of money managers identify themselves as bullish or very bullish about the prospects for U.S. stocks -- an all-time high for Big Money, going back more than 20 years.” “Dow 16000!” – Barron’s Magazine Big Money Poll 4/20/2013 A few reminders... “Still Bullish! (Dow 13000)” – Barron’s Magazine Big Money Poll, May 1, 2000 The May 2000 Big Money Poll was published with the Dow Jones Industrial Average at 10733.91. The Dow had already peaked nearly a thousand points higher in January of 2000, and would go on to lose about 40% of its value in the 2000-2002 bear market, with the S&P 500 and Nasdaq faring far worse. “Dow 14000?” – Barron’s Magazine Big Money Poll, May 2, 2007 The May 2007 Big Money Poll was published with the Dow at 13264.62. The Dow did advance another 6% to reach 14000 by October 2007. By November (the poll is semi-annual), bulls were outnumbering bears by 2-to-1, and the headline ran “The Party’s Not Over.” In fact, the market had already peaked, and proceeded to lose over half its value in the 2007-2009 bear market. The Barron’s Big Money Poll is typically bullish, on balance. This is Wall Street, after all. But variations in the tone and extent of that bullishness can be informative, especially when the consensus is extremely optimistic at new highs of mature bull markets, and defensive at new lows of mature bear markets. I can’t really throw stones about 2009, as I had my own concerns at the time (relating to the need to stress-test against Depression era outcomes, despite our favorable views of valuation). But it’s worth noting that the 2009 Big Money Poll questioned the advance from the March lows, noting “good reason not to jump in with both feet yet.” The 2003 Big Money Poll – already well into a new bull market – was bullish on balance, and up from just 43% bulls in an October 2002 poll near the market lows. Still, the 2003 poll noted “the bulls’ views have been tempered by the market’s losses in recent years. Consequently their expectations for the Dow, the Standard & Poor’s 500 stock index, and the Nasdaq Composite have been ratcheted down from past surveys.” This certainly isn’t a criticism of Barron’s itself. I grew up on Barron’s Magazine, and will remain a devoted reader at least as long as Alan Abelson provides a worthy counterbalance to the more short-sighted views of Wall Street and the Market Lab section remains in print. Still, the Big Money Poll is most useful as a contrary indicator. Rule o’ Thumb: When the cover of a major financial magazine features a cartoon of a bull leaping through the air on a pogo stick, it’s probably about time to cash in the chips.
While the attention of investors is focused on the short-run market outlook in what is already a mature bull market advance, it’s crucial to understand the endgame to this overvalued, overbought, overbullish, overleveraged episode of market history. That endgame will be forced liquidation, as declining prices force leveraged investors to sell – voluntarily or otherwise. I noted back in January that margin debt had surged above 2% of GDP for the fourth time in history (the other three being 2000, 2007, and February 2011 - less severe, but still followed by an 18% market correction). In February, NYSE margin debt (the amount that investors have borrowed to purchase NYSE-traded stocks on margin) reached $366 billion, and there’s a fair chance that given the continuation of that advance in the subsequent weeks, more recent margin debt will have accumulated to a total that eclipses the July 2007 record of $381 billion.
Clearly, the dollar value of margin debt has experienced a secular increase over time, so the levels aren’t as important as the cyclical variations. In particular, note that rapid and nearly parabolic increases in leverage tend to appear as the market approaches major peaks and bullishness feeds on itself. There are a number of series that can be used to normalize the long-term uptrend and to put the amount of margin debt in context. Notice that one would not want to normalize using the market value of stocks themselves. The reason is that margin debt surges near market peaks and collapses at market troughs, so to divide by the level of prices at those points would actually destroy much of the information content of margin debt (though you still typically observe debt rising much faster than prices as the market peaks). Below, margin debt is presented as a percentage of GDP. Presently, margin debt is more than 2.3% of GDP, the highest level in history with the exception of the approaches to the 2000 and 2007 market peaks. Clearly, there have been changes in market structure over time, such as the emergence of hedge funds, long-short strategies and the like. So the long-term increase in margin debt certainly has some “structural” features to it. Again, however, the important feature to observe is not so much the absolute level, but the cyclical tendency for spikes in margin debt to accompany overvalued, overbought, overbullish market peaks. The subsequent market collapses are typically worsened by the inability of investors to simultaneously exit overleveraged positions that were all based on the same investment thesis.
There is no question that objective, careful, historically-informed analysis has had enormous challenges in the context of monetary interventions and fiscal deficits that have suppressed yields, temporarily boosted profit margins, and encouraged speculative leverage. Unfortunately, however effective these interventions have been in achieving speculative outcomes and kicking cans beyond their normal resting places, the endgame is still the same. Again, the endgame of overvalued, overbought, overbullish, overleveraged markets is forced liquidation. Margin debt is soaring, valuations are now elevated even on the assumption that profit margins 70% above their historical norms will be sustained indefinitely, yields are compressed on nearly every asset class, and there is increasing evidence that Fed “stimulus” is incapable of exerting meaningful effects on the real economy and is exerting only speculative effects on an already overspeculative market. With a record 74% of Wall Street strategists now bullish, who is left to embrace further speculation, and how deep will the required losses be to induce the conservative 26% to absorb the overleveraged exposure of the exuberant 74% when forced liquidation becomes necessary? On the temptation to disregard proven indicators As a side-note, it’s important for investors to be wary of “structural” arguments intended to discard indicators that have very reliable cyclical records. For example, hardly a day goes by that we don’t see an attempt to harness some long-term structural factor, such as increasing globalization of trade, to explain away the spike in profit margins over the past few years – in the hope of proving that these margins will be permanent this time. Some of these arguments are discussed in recent weekly comments. But these factors don’t explain the cyclical fluctuations in profit margins at all, and can’t be used to discard the accounting relationships and decades of evidence that corporate profits have a strong secular and tight cyclical mirror-image relationship with the combined total of government and household savings. Investors get themselves in trouble when they embrace “new economy” theories not because those new theories can be demonstrated in the data; not because existing approaches fail to fully explain the subsequent historical outcomes; but solely because time-tested approaches suggest uncomfortable outcomes in the present instance. The same sort of structural second-guessing is evident in the gold market here – a good example of what forced liquidation looks like, as my impression is that leveraged longs have been forced into a fire-sale in recent weeks, creating good values for longer-term investors, but with continued near-term risks. If we look at the ratio of gold prices to the Philadelphia gold index (XAU), we do believe there are structural factors that affect that ratio (primarily the increasing cost of extracting gold over time). But these don’t explain away or eliminate the strong cyclical relationship between the gold/XAU ratio and subsequent returns on the XAU over the following 3-4 year periods. So while we don’t believe that the record high gold/XAU ratio can be taken entirely at face value, there’s no question that it is elevated even on a cyclical basis (that is, even allowing for a gradual structural increase over time), and there’s no question in the data that cyclically elevated gold/XAU ratios have been associated with strong subsequent gains in the XAU index over a 3-4 year period on average, though certainly not without risk or volatility. As a final example, some analysts (such as the Dow 36,000 authors) have argued that the proper risk premium on stocks, relative to Treasury securities, should be zero. This line of argument was used in 2000 to suggest that stocks were still cheap despite high apparent valuations. But this “secular” argument for high valuations ultimately did not weaken the long-term evidence and tight cyclical relationship between valuations and subsequent market returns. Despite all the new economy arguments about productivity growth, the internet, globalization, the great moderation, and the outdated relevance of risk premiums, stocks still went on to lose half their value over the next two years, and to produce negative returns over the decade that followed. The bottom line is that it becomes very tempting – both in speculative markets and fearful ones – to discard well-proven indicators as meaningless by arguing that some “structural” change in the market or the economy makes things different this time. True, those arguments can sometimes be used to explain very long-term changes in the level of an indicator. But even then, new economy arguments are typically ineffective at explaining away the informative cyclical variations in good indicators. Be particularly hesitant about ignoring indicators whose cyclical variations have been effective even in recent data, as is true of the ability of time-tested valuation approaches to explain subsequent 10-year market returns even during the period since the late-1990’s, and the ability of government and household savings to tightly explain cyclical swings in profit margins and subsequent profit growth, even in the most recent economic cycle. Notes from the Wine Country Conference A year ago, my friend Mike Shedlock (Mish) lost his wife Joanne to ALS (Lou Gehrig’s disease). Mike called with the idea of hosting a conference in Sonoma, California to benefit the Les Turner ALS Foundation. I thought that this would be something special, and it certainly proved to be just that. I finally met an old friend, John Mauldin, who I’ve corresponded with for years, and who was every bit as engaging, enthusiastic and insightful I expected. Chris Martenson was enormously likeable, not to mention brilliant – giving a powerful presentation on resource use and its present and likely future impact. Jim Chanos and Michael Pettis gave clear-sighted presentations focusing on the growth “miracle” in China and the on-the-ground realities there. Mish finished the day of presentations with historical insights on inflation and fiat currencies. Participants came from around the country and internationally, and joined us for dinner and a tour of Sonoma wineries. Jim added a generous donation in addition to his presentation. Michael Pettis flew in from China to present at the conference, and immediately back, which was a remarkable act of support for the charitable goal. Mish and his partners at Sitka Pacific, JJ Abodeely and Brian McAuley were wonderful hosts. In all, their efforts raised nearly $500,000 for ALS. The presentations and panel discussions were videotaped, and are being posted to the Wine Country Conference website, along with slide decks (see the left menu of the site). If you find them interesting or useful, please consider even a small gift to the Les Turner ALS Foundation. Even modest gifts, across thousands of visitors, will make a real impact. Thanks. A quick side note – a question relating to corporate profits demanded more time in the Q&A than I was able to properly devote to it – a more complete response is in the footnote of last week’s market comment (see Increasingly Immediate Impulses to Buy the Dip). Again, the reason that the (Investment – Foreign Savings) term adds little variation to profits over the business cycle is that variations in gross domestic investment as a share of GDP are tightly and inversely correlated with variations in the current account deficit (a chart is presented in Taking Distortion at Face Value). Nor do dividends add material variation to the profits relationship over the economic cycle. The upshot is that there is an extremely strong inverse relationship, both in terms of levels – and more importantly, in terms of variations – between corporate profits and the combined total of government and household savings. There are a million ways to deny this relationship, and many seem perfectly convincing until one works out the arithmetic and examines the data. The significant retreat in corporate profits over the next several years will take investors by surprise – it should not. The foregoing comments represent the general investment analysis and economic views of the Advisor, and are provided solely for the purpose of information, instruction and discourse. Only comments in the Fund Notes section relate specifically to the Hussman Funds and the investment positions of the Funds. Fund Notes As of last week, the market remained characterized by an overvalued, overbought conditions, complicated by extremely high leverage through margin debt, and record bullishness among institutional investors, according to the Barron’s Big Money Poll. Unfortunately, similarly exuberant sentiment did not work out well at all for the market in 2000 or 2007. I doubt that the present instance will be much different. Yields are compressed across investment sectors, with the yield on the Dow Jones Corporate Bond Index setting a record low last week, and a spread over Treasury yields that I doubt will even compensate for a very, very low level of corporate defaults – much less what one might anticipate should the U.S. join the recession that is already evident among much of the developed world (which I expect it will). As investors reach for yield due to the “hot potato” of zero-interest money created by the Federal Reserve, they seem to believe that they have found a reliable "earnings yield" in stocks. But corporate profit margins are 70% above their historical norms, and the deviation is – painfully – well explained by its mirror image: the combined deficit in the government and household sectors (the deficit of one sector must, in equilibrium, emerge as the surplus of another). The apparent earnings yield in stocks is largely illusory for that reason. Stocks seem reasonable or only slightly elevated "on the basis of forward operating earnings” – despite being strikingly overvalued on measures that account for the variability of profit margins over the economic cycle (measures that have historically had a much stronger relationship with subsequent returns on the S&P 500 – see Investment, Speculation, Valuation, and Tinker Bell). The unfortunate menu of depressed prospective returns and high investment risk will change, as it always has over the course of the economic cycle. Already, the severe liquidation of precious metals shares is beginning to alter the menu of prospective returns, though it is important to recognize that even the historically low valuation of gold shares relative to spot gold prices does not remove risk or ensure returns, particularly over the near-term. As always, we try to align our investment positions in proportion to the return that we expect per unit of risk at each point in time. As long-term investors, the ideal case would actually be for both gold stocks and the equity market as a whole to decline (though with the overall market declining more significantly). Looking across history, we’ve tended to observe peaks in gold shares well in advance of peaks in the general market, plunges in gold shares slightly in advance of plunges in the general market, and new advances in gold shares several months in advance of troughs in the general market (see, for example, the lows of 1982, 2000 and 2008). I suspect that the weakness we are seeing in the gold sector is something of a precursor in this case as well. Investors should note that when the Philadelphia gold index (XAU) has plunged by more than 20% over the prior 6-month period, the general stock market has often experienced significant losses over the following 6-12 month period (see, for example, the losses in the XAU in mid-1990 just before the general 1990 bear market, in late-2000 just before the 2000-2002 bear market, and in August 2008 – when the S&P 500 was still at 1300 – just before the general market collapsed). This is certainly no assurance of the market outcome in the present instance, but in the context of an overvalued, overbought, overbullish market with margin debt near record highs, it’s also not a feature of the present environment that we’re inclined to overlook. Strategic Growth Fund is fully hedged, with a "staggered strike" position where the Fund’s index put option strikes are near present market levels, owing to the recent market decline. Notably, those staggered strike puts have not yet provided a great deal of benefit, as they were still out-of-the-money during the recent market decline. When that is the case, day-to-day fluctuations in Fund value are primarily driven by differences in performance between the stocks held by the Fund and the indices it uses to hedge. In contrast, a signficant market decline from here would allow us to be less concerned about any tendency toward indiscriminate weakness in individual stocks, as we would expect the higher-strike put options to compensate. Needless to say, we would also look for opportunities to roll those put option strikes lower in the event that a market decline was to put them significantly “in the money.” Meanwhile, Strategic International remains fully hedged, and Strategic Dividend Value is hedged at about 50% of the value of its stock holdings. In Strategic Total Return, we continue to view the prospective return/risk profile in fixed income securities as relatively weak, but that will change over time. For now, continued economic risks are sufficient to hold us to a duration of about 3 years, meaning that a 100 basis point change in bond yields would be expected to impact Fund value by about 3% on the basis of bond price fluctuations. We’re not terribly concerned about a general advance in bond yields here, but even in the event of a secular increase in yields over time, it would seem unlikely to be an uncorrected diagonal move. So we would expect enough fluctuation in yields over time to create good opportunities to vary our duration in response to those fluctuations. We don’t observe adequate compensation for taking on credit risk here, as credit spreads have become enormously depressed due to yield-seeking speculation. Again, this will change over time. We do estimate strong 3-4 year prospective returns in precious metals shares, and have recently accumulated a 20% exposure in this sector. Even here, however, we can expect significant day-to-day volatility, and our view is decidedly on a horizon of a year or more. In short, I view the menu of prospective returns to be extremely limited at present, but also expect that to change significantly over the coming quarters. While the earliest shift has been in the precious metals market, it seems unlikely that the precious metals market will entirely detach from other sectors. Until the shoe drops for other markets, I believe that it’s best to stay limited to an adequate but still moderate position in precious metals; enough to benefit from potential returns, but also able to tolerate potential risks. Soon enough, I expect that investors will be relieved of the need to desperately reach for yields that are hardly distinguishable from zero. This is not the time to swing at pitches so low that they brush the grass. --- The foregoing comments represent the general investment analysis and economic views of the Advisor, and are provided solely for the purpose of information, instruction and discourse. Prospectuses for the Hussman Strategic Growth Fund, the Hussman Strategic Total Return Fund, the Hussman Strategic International Fund, and the Hussman Strategic Dividend Value Fund, as well as Fund reports and other information, are available by clicking "The Funds" menu button from any page of this website. |
|||||||||||||||||||||||||
|
For more information about investing in the Hussman Funds, please call us at
1-800-HUSSMAN (1-800-487-7626) 513-326-3551 outside the United States Site and site contents © copyright Hussman Funds. Brief quotations including attribution and a direct link to this site (www.hussmanfunds.com) are authorized. All other rights reserved and actively enforced. Extensive or unattributed reproduction of text or research findings are violations of copyright law. Site design by 1WebsiteDesigners. |