|
|
||||||
|
|

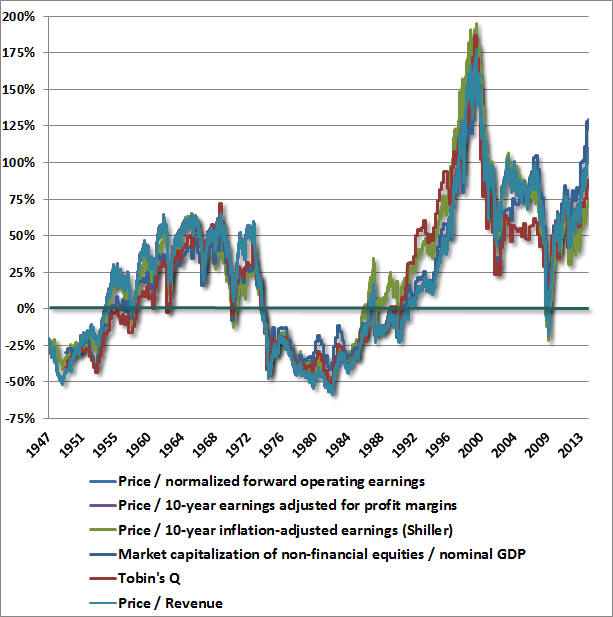
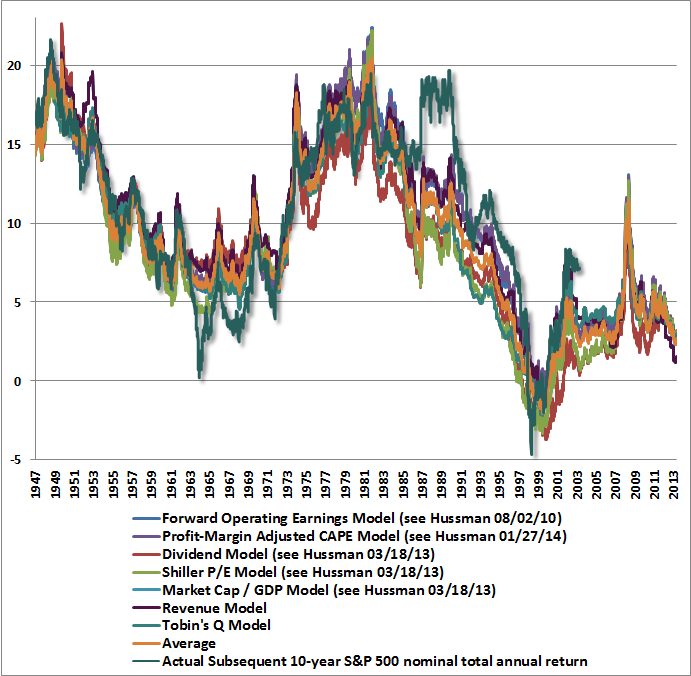
March 10 2014 It Is Informed Optimism To Wait For The Rain Based on valuation metrics that have demonstrated a near-90% correlation with subsequent 10-year S&P 500 total returns, not only historically but also in recent decades, we estimate that U.S. equities are more than 100% above the level that would be associated with historically normal future returns. We presently estimate 10-year nominal total returns for the S&P 500 averaging just 2.2% annually over the coming decade, with zero or negative nominal total returns on every horizon of less than 7 years. Regardless of very short-term market direction, it is urgent for investors to understand where the equity markets are positioned in the context of the full cycle. Importantly, this expectation fully embeds projected nominal GDP growth averaging over 6% annually over the coming decade. To the extent that nominal economic growth persistently falls short of that level, we would expect U.S. stock market returns to fall short of 2.2% nominal total returns (including dividends) over this period. These are not welcome views, but they are evidence-based, and the associated metrics have dramatically higher historical correlation with actual subsequent returns than a variety of alternative approaches such as the “Fed Model” or various “equity risk premium” models. We implore investors (as well as FOMC officials) to examine and compare these historical relationships. It is not difficult – only uncomfortable.
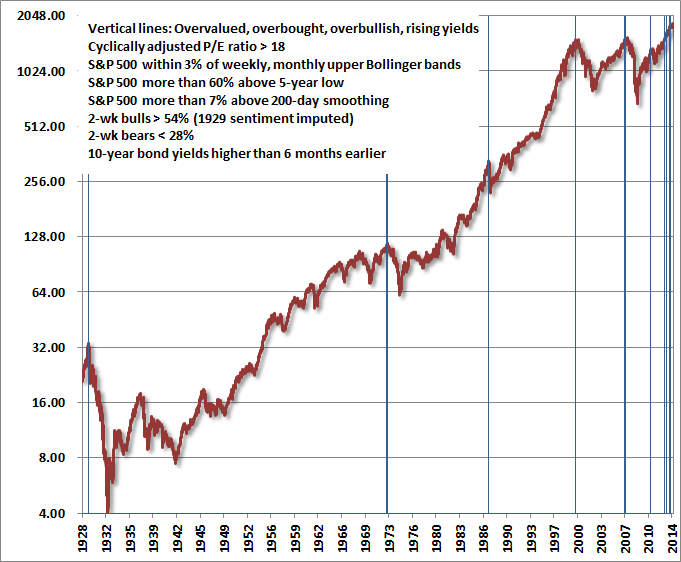
The depressed level of short-term interest rates does not change the arithmetic here. It simply offers investors additional discomfort – the choice of accepting risk in equities that are already intolerably overvalued, or to instead accept the certain prospect of near-zero near-term returns. For our part, we expect dramatically better investment opportunities to emerge over the completion of the present market cycle. It is optimism, not pessimism, about those future opportunities that leads us to avoid reaching for low-return, high-risk equity exposure here. Investors should only expect meaningful total returns to the extent that they wish to speculate that long-term prospective returns will be driven even lower than 2.2% annually (on a 10-year horizon). Of course, that’s really the story of the past few years – a persistent willingness of investors to drive long-term prospective returns lower, as they feel both encouraged and forced to do so by Federal Reserve policies. Just as the willingness of investors to accept lower long-term interest rates implies that a willingness to pay higher bond prices (and vice versa), the willingness of investors to accept lower long-term stock market returns implies a willingness to pay higher stock prices (and vice versa). Objectively, there is no specific level at which investors can be told “no, stop, don’t” once the speculative bit is in their teeth. Historically, however, such periods have typically reached their extremes when a syndrome of overvalued, overbought, overbullish, rising-yield conditions emerges. By the time one observes extreme conditions simultaneously – rich valuations, overbought market conditions, lopsided bullish sentiment, and rising 10-year yields – equity markets have generally been at precarious and climactic highs. Prior to the current market cycle, these points singularly include 1929, 1972, 1987, 2000, and 2007 (slightly broader criteria also would include 1937). In the uncompleted half-cycle since 2009, however, we’ve seen these conditions at the 2011 market peak (followed by a near 20% decline that was truncated by investor enthusiasm about fresh quantitative easing), and several instances over the past year – specifically, February 2013, May 2013, December 2013, and today.
It is the series of extreme instances over the past year that give investors the hope and delusion that historically reckless market conditions will lead only to further gains and greater highs. This is a mistake born of complacency in the face of a nearly uninterrupted, Fed-enabled 5-year market advance, and is the same mistake that was made in 2000 and again in 2007. By the time the present market cycle is completed, we expect the S&P 500 to be at least 40% lower than present levels. Only the reliance on historically unreliable valuation metrics, and what Galbraith called the “extreme brevity of financial memory” makes that assertion seem the least bit controversial. Investors and policy-makers that focus attention on some alternative valuation measure (usually because it seems pleasantly benign) would be well-advised to examine the data, and compare the historical relationship between competing measures and actual subsequent market returns. Remember also that outliers are instructive. For example, the actual total return on equities in the decade following 1964 was much weaker than one would have projected, because stock valuations collapsed at the 1974 market low. Conversely, the actual total return on equities in the decade following 1990 was much stronger than valuations would have projected, because valuations became so extreme by the 2000 bubble peak. To the extent that stocks have done a few percent better in the most recent 10-year period than valuations would have projected, it is because stocks have become so profoundly elevated at present. Such outliers are the first thing to be wiped out over the completion of the market cycle.
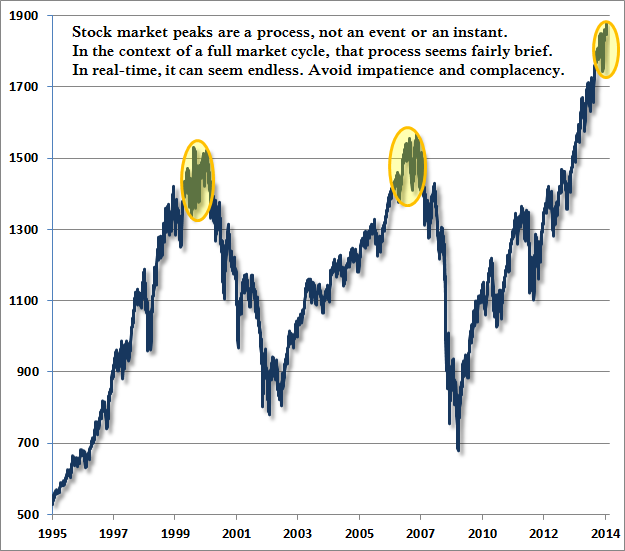
Again, regardless of very short-term market direction, it is urgent for investors to understand where the equity markets are positioned in the context of the full market cycle. While the most extreme overvalued, overbought, overbullish, rising-yield syndrome we define has generally appeared only at the most wicked market peaks in history, investors have ignored those conditions over the past year. We can’t be certain when the deferred consequences will emerge. But a century of market history provides strong reason to believe that any intervening gains will be wiped out in spades. It’s instructive that the 2000-2002 decline wiped out the entire total return of the S&P 500 – in excess of Treasury bills – all the way back to May 1996, while the 2007-2009 decline wiped out the entire excess return of the S&P 500 all the way back to June 1995. Overconfidence and overvaluation always extract a terrible payback. It may also be helpful to remember that market peaks are a process, not an event. In the presence of a broad range of reliable valuation metrics uniformly at more than twice their historical norms, coupled with the most severe overvalued, overbought, overbullish, rising-yield syndrome we define, it is instructive how shorter-term action has evolved near those points. Outside of today and 1929, the other two instances are, not surprisingly, 2000 and 2007. The chart below provides a more granular reminder that market peaks are often a broad process and can involve hard initial downturns and swift recoveries. The ultimate follow-through provides some insight regarding the full scale of our concerns.
A final note – in my view, it is incorrect to believe that the 2008-2009 market plunge and financial crisis were caused by the housing bubble. The housing bubble was merely the expression of a very specific underlying dynamic. The true cause of that episode can be found earlier, in Federal Reserve policies that suppressed short-term interest rates following the 2000-2002 recession, and provoked a multi-year speculative “reach for yield” into mortgage securities. Wall Street was quite happy to supply the desired “product” to investors who – observing that the housing market had never experienced major losses – misinvested trillions of dollars of savings, chasing mortgage securities and financing a speculative bubble. Of course, the only way to generate enough “product” was to make mortgage loans of progressively lower quality to anyone with a pulse. To believe that the housing bubble caused the crash is to ignore its origin in Federal Reserve policies that forced investors to reach for yield. Tragically, the Federal Reserve has done the same thing again – starving investors of safe returns, and promoting a reach for yield into increasingly elevated and speculative assets. Thinking about the crisis only from the perspective of housing, investors and policy-makers have allowed the same process to play out more broadly in the equity market. On a quantitative basis, the overvaluation of the equity market is greater percentage-wise, and greater dollar-wise, than the overvaluation of housing in 2006-2007. We fully expect that from present valuations, U.S. stocks will produce zero or negative returns on every horizon shorter than 7 years. There is no antidote or alchemy that will allow a buy-and-hold approach to squeeze water from this stone. There is no painless monetary fix that will shift the allocation of capital toward productive investment and away from distortive speculation. Instead, one must wait for the rain. Impatient, crowd-following investors are all too willing to wastefully scatter seeds onto this parched desert, thinking that this is their only chance to sow. To wait patiently in the expectation of fertile soil and rain is not an act of pessimism, but an act of optimism and informed experience. The foregoing comments represent the general investment analysis and economic views of the Advisor, and are provided solely for the purpose of information, instruction and discourse. Only comments in the Fund Notes section relate specifically to the Hussman Funds and the investment positions of the Funds. Fund Notes The Hussman Funds continue to carry a defensive stance toward equities, and a moderately constructive stance toward Treasury securities and precious metals shares. From a full-cycle perspective, it may be helpful to understand how the relative performance of risk-managed strategies can shift over the completion of a market cycle. At market peaks, investors often lament the seemingly obvious gains that might have been made had investors held onto stocks without concern about what might happen next. What matters over the course of the complete market cycle, however, is what portion of those gains can actually be retained. In bull market periods, missed returns are very obvious, and can feel tragic. But investors often overlook how bear market periods can create a profound reversal of fortune. During the 2000-2002 bear market for example, the S&P 500 lost 47.44% from its peak (on a total return basis) on 9/1/2000 to its trough on 10/9/2002. Meanwhile Strategic Growth Fund achieved a positive return of 47.83%. From the standpoint of relative performance, the impact was the same as if the Fund had gained 181.26% [= (1+.4783)/(1-.4744)-1] with the S&P 500 unchanged. Similarly, during the 2007-2009 bear market, the S&P 500 lost 55.22% from its peak on 10/9/2007 to its trough on 3/9/2009. Meanwhile, Strategic Growth Fund lost 6.47% (as measures of market action that were reliable in post-war data instead whipsawed much like they did in the Depression era, which is part of what provoked our stress-testing response). From the standpoint of relative performance, the impact of that period was the same as if the Fund had gained 108.87% [= (1-.0647)/(1-.5522)-1] with the S&P 500 unchanged. While the Fund’s performance in these periods is generally reflective of our risk-managed approach, there is no assurance of similar performance or relative performance in future market cycles. Complete performance information for the Funds is available on The Funds page. Our greatest disappointment in the unfinished half-cycle since 2009 is not the past year, and certainly not the market advance of recent weeks. While it’s true that the market has advanced, that advance is in the context of an extreme syndrome of overvalued, overbought, overbullish, rising yield conditions that previously emerged only at the 1929, 1972, 1987, 2000 and 2007 peaks. Our historically informed, risk-conscious strategy does not – and should not be expected to – encourage a material exposure to market risk in these circumstances. We have surely missed market returns, but they are returns that we expect will be fully surrendered by the market over the completion of this cycle. Instead, our greatest disappointment in this cycle is the period of missed returns in 2009 and 2010 that resulted from my fiduciary insistence on stress-testing our methods against Depression-era evidence. To a lesser extent, we might also have benefited – in the face QE-induced speculation – by criteria that we imposed in April 2012 (essentially encouraging market exposure even when our return/risk estimates are negative, provided that our measures of market action are positive and overvalued, overbought, overbullish syndromes are absent). If one looks for what we might have done differently the half-cycle since 2009, it is those points where we would expect our approach to differ in future cycles. At present, however, our defensiveness is strategic (not only fiduciary) and informed by a century of market history. After the 2000-2002 bear market, we eagerly shifted to a constructive and mostly unhedged investment stance (despite valuations that were still rich from a historical perspective). In contrast, our stress-testing against Depression-era evidence after the 2007-2009 plunge (which we had anticipated) prevented a similar shift in the interim. As I’ve frequently noted, we often see the strongest return/risk estimates at points where a material retreat in valuations is followed by an early improvement in our measures of market internals. I expect no stress-testing concerns to prevent a constructive response to such conditions in future cycles. Still, the missed opportunity resulted in a continuous span of defensiveness that might otherwise have been punctuated by a constructive stance, more characteristic of our full-cycle approach. Hence my reputation as a “permabear” to reductionists who ignore our investment process and the narrative of this extraordinary market cycle. It may also help to understand that the same methods that compel us toward a defensive position today would also have encouraged an aggressive investment stance (not only unhedged, but holding a few percent of assets in index call options) more than 50% of the time over the course of history. As I believe we amply demonstrated in the years prior to that 2009 stress-testing decision, I very much expect to substantiate the choice of both the words “Strategic” and “Growth.” Shareholders in Strategic Growth who correctly understand the narrative of the period since 2009 should not be surprised that we are hard-defensive here, nor should they be surprised to observe a point in the coming market cycle where we fully remove our hedges and establish a prolonged aggressive investment stance. If such a shift would be surprising or unanticipated, we urge a fresh review of our Prospectus, annual reports and weekly commentaries. Meanwhile, as always, Strategic Growth Fund is not appropriate for investors with a strong desire to track market fluctuations, particularly over limited portions of the complete market cycle. Similar considerations, of course, remain true for the other Hussman Funds, where our investment stance in various asset classes will change as the evidence shifts over the complete market cycle.--- The foregoing comments represent the general investment analysis and economic views of the Advisor, and are provided solely for the purpose of information, instruction and discourse. Prospectuses for the Hussman Strategic Growth Fund, the Hussman Strategic Total Return Fund, the Hussman Strategic International Fund, and the Hussman Strategic Dividend Value Fund, as well as Fund reports and other information, are available by clicking "The Funds" menu button from any page of this website. |
|||||||||||||||||||||||||
|
For more information about investing in the Hussman Funds, please call us at
1-800-HUSSMAN (1-800-487-7626) 513-326-3551 outside the United States Site and site contents © copyright Hussman Funds. Brief quotations including attribution and a direct link to this site (www.hussmanfunds.com) are authorized. All other rights reserved and actively enforced. Extensive or unattributed reproduction of text or research findings are violations of copyright law. Site design by 1WebsiteDesigners. |