|
|
||||||
|
|

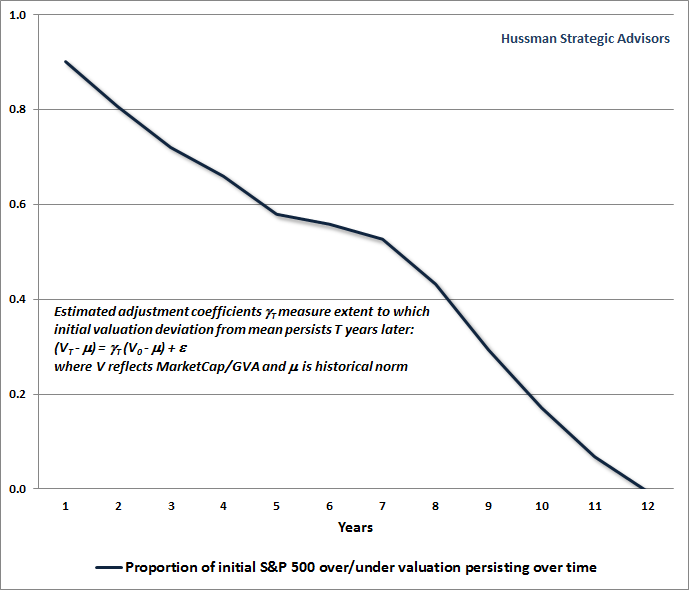
September 28, 2015 Valuations Not Only Mean-Revert; They Mean-Invert “... Almost everyone believed that speculation could be now resumed in earnest. A common feature of all these earlier troubles was that having happened they were over. The worst was reasonably recognized as such. The singular feature of the great crash of 1929 was that the worst continued to worsen. What looked one day like the end proved on the next day to have been only the beginning. Nothing could have been more ingeniously designed to maximize the suffering, and also to ensure that as few as possible escaped the common misfortune. The man with the smart money, who was safely out of the market when the first crash came, naturally went back in to pick up bargains. The bargains then suffered a ruinous fall." “Is our profession really so lazy that we would advise people to risk their financial security based on tinker-toy models and pretty pictures that we don't even have the rigor to test historically? Investors appear eager to ‘scoop up’ so-called ‘bargains’ on the belief that stocks are ‘cheap relative to bonds.’ All of this is predicated on the belief that profit margins will remain at record highs, that the Fed Model is correct, and that P/E ratios based on extremely elevated measures of earnings should be evaluated based on norms for much more restrained measures of earnings. Based on daily closing prices, the S&P 500 has not even experienced a 10% correction, yet the recent decline has been characterized as if investors are acting ‘like the world is about to end.’ This is not the pinnacle of human irrationality, but in fact, quite a shallow selloff from a historical standpoint. The fact that Wall Street is branding it otherwise is evidence that investors have completely forgotten how deep the market's losses can periodically become.” Hussman Weekly Market Comment, August 2007 “Given the damage already wrought on the Nasdaq, there is a natural inclination to buy the dip. We believe that there is little merit in doing so. The current market climate is characterized by extremely unfavorable valuations, unfavorable trend uniformity, and hostile yield trends. This combination is what we define as a Crash Warning, and this climate has historically occurred in less than 4% of market history. That 4% of market history includes the 1929 crash and the 1987 crash, as well as a number of less memorable crashes and panics. We prefer to hedge until there is a rational prospect for market gains. When valuations are favorable, stocks are attractive from the standpoint of ‘investment’ – meaning that stock prices are attractive compared to the conservatively discounted value of cash flows which will be thrown off in the future. When trend uniformity is favorable, stocks are attractive from the standpoint of ‘speculation’ – meaning that regardless of valuation, investors are displaying an increased tolerance for risk which favors a further advance in prices.” Hussman Investment Research & Insight, November 2000 If there is a single pertinent lesson from history at present, it is that once obscenely overvalued, overbought, overbullish market conditions are followed by deterioration in market internals (what we used to call “trend uniformity”), the equity market becomes vulnerable to vertical air-pockets, panics and crashes that don’t limit themselves simply because short-term conditions appear “oversold.” I should immediately add the most pertinent lesson that we’ve learned from our own challenges in the half-cycle advance since 2009. After correctly anticipating the global financial collapse, and even shifting to a constructive outlook after the market plunged by more than 40% in late-2008 (see Why Warren Buffett Is Right and Why Nobody Cares), the out-of-sample behavior of the economy and the financial markets – from the standpoint of post-war data – led me to insist on stress-testing our methods of estimating market return/risk profiles against Depression-era data. The methods that emerged from our stress-testing effort performed better across history, and in holdout data, better than anything we had previously developed. While they included our measures of “trend uniformity,” they also picked up an additional regularity. In prior market cycles across history, the emergence of an extreme overvalued, overbought, overbullish syndrome regularly accompanied or closely preceded deterioration in market internals. As a result, we took a negative market outlook as soon as those overvalued, overbought, overbullish syndromes emerged. If the Federal Reserve’s program of quantitative easing made one thing “different” in recent years, it was to intentionally encourage yield-seeking speculation despite those overbought extremes. That disrupted the historical tendency for “overextended” features of market action to closely precede deterioration in “trend-sensitive” features of market action. One had to wait until market internals had actually deteriorated explicitly before taking a hard-negative outlook. That’s the condition we imposed on our methods in mid-2014. As I’ve noted previously, when market internals have been unfavorable, the market has lost ground, on average – even since 2009. The central lesson that investors should infer from history, and from the advancing half-cycle since 2009, is not that valuations are irrelevant, or that market risk should always be embraced, or even that Fed easing provides reliable support to the market (it certainly didn’t during the 2000-2002 and 2007-2009 collapses). Rather, market cycles across history, including the period since 2009, emphasize that valuations control long-term investment outcomes, while investor attitudes toward risk - as evidenced by the uniformity or divergence of market internals - control shorter-term outcomes. With the S&P 500 still within about 9% of its record May peak, with historically reliable valuation measures still double their historical norms, and importantly, with market internals now clearly negative, present conditions classify the market outlook within the most hostile return/risk profile we identify. That will change as valuations and market internals do. Favorable market internals can significantly delay the tendency of extreme valuations to normalize. When favorable internals drop away, valuations can normalize in the blink of an eye. Keep that in mind here. Not only is the long-term outlook dismal on the basis of current valuations; the near-term outlook is also unusually perilous because recent overvalued, overbought, overbullish extremes have now given way to growing risk-aversion among investors. Valuations not only mean-revert; they mean-invert For decades now, I’ve regularly detailed the historical evidence linking equity valuations to actual subsequent long-term returns in stocks. An important feature of historically reliable measures of valuation is that they mute the impact of cyclical fluctuations in profit margins. Current earnings – or analyst estimates of expected “forward” earnings – should not be taken at face value, because profit margins are not permanent. The most reliable measures of broad market valuation are actually driven by revenues, not earnings. For a review, including the arithmetic linking valuations to actual subsequent market returns, see Ockham’s Razor and the Market Cycle and Margins, Multiples, and The Iron Law of Valuation. It’s sometimes argued that the long-term expected return on stocks is simply the expected long-term growth rate of earnings, dividends and the like, plus the prevailing dividend yield. While this would be true if valuations were held constant for all of eternity, the fact is that elevated and depressed valuations tend to normalize over time, which investors know as “mean reversion.” As a result, higher valuations are systematically related to lower subsequent long-term market returns, and lower valuations are systematically related to higher subsequent long-term market returns. Here are the correlations that we estimate in post-war data between various valuation ratios and actual subsequent 10-year total nominal returns of the S&P 500. A correlation of -1.00 would represent a perfect relationship. The correlations are negative, because higher valuations imply weaker subsequent returns. For a good primer on mean reversion, and to understand why using logarithms is the appropriate way to link valuations and subsequent returns, see my May 4, 2015 comment, Two Point Three Sigmas Above The Norm. log(price/trailing 12-month earnings): -0.76 As a side note, the Fed Model (S&P 500 forward earnings yield – 10-year Treasury yield) is expressed as a “higher is better” figure, so that particular model is positively correlated with subsequent 10-year total returns in the S&P 500. Unfortunately, that correlation is only 0.49, which means that “correcting” the forward earnings yield for interest rates actually destroys information about future returns. Since subtracting the 10-year bond yield from two variables doesn’t change the correlation between them, the correlation between the Fed Model and subsequent 10-year S&P 500 total returns in excess of the 10-year bond yield is 0.79. That isn’t surprising, because it is the same as the correlation between the raw forward earnings yield and the raw 10-year S&P 500 total return. In our view, the best way to estimate the likely “excess” return of the S&P 500 over and above 10-year Treasury yield is simply to estimate the raw total return using MarketCap/GVA and then subtract out the 10-year yield. At present, that approach suggests that the S&P 500 is likely to underperform even the low 2.16% yield on Treasury bonds over the coming decade. So here’s an interesting question: how quickly, historically, have valuations tended to mean-revert? The answer is a bit tricky, because it depends on the condition of market internals. If valuations are elevated and market internals are unfavorable, valuations can retreat vertically. In 2008, for example, the market went from steep overvaluation to slight undervaluation within the span of three months, losing over 40% of its value. On the other hand, rich valuations have periodically been sustained for long periods of time, as they were in the late-1990s and in recent years, because investors stayed in a risk-seeking mood, as evidenced by uniformly favorable market internals. A more appropriate question is this: Over what horizons are valuations most reliably associated with actual subsequent market returns? Asking the question in this way recognizes that short-term factors can certainly accelerate or delay mean-reversion in any given market cycle, but also recognizes that because risk-seeking and risk-aversion tend to come and go, their effect on long-term returns washes out as the horizon increases. The chart below uses the most reliable valuation ratio we identify in publicly available data since the 1940's; the ratio of nonfinancial market capitalization to corporate gross value added. The results are similar using other reasonably reliable measures such as the Shiller P/E. The chart shows the proportion of initial over- or undervaluation in the S&P 500 that has persisted, on average, as time progresses. The result should be intuitive. Over short horizons, of a few years, only a modest proportion of overvaluation or undervaluation tends to be eliminated. As a result, other factors – particularly the risk-seeking or risk-averse preferences of investors – can have more impact on returns than valuations do over those short horizons. In contrast, valuations demonstrate increasingly reliable mean reversion on horizons of 7 years and more. Within 12 years, any initial overvaluation or undervaluation of the market is entirely erased, on average.
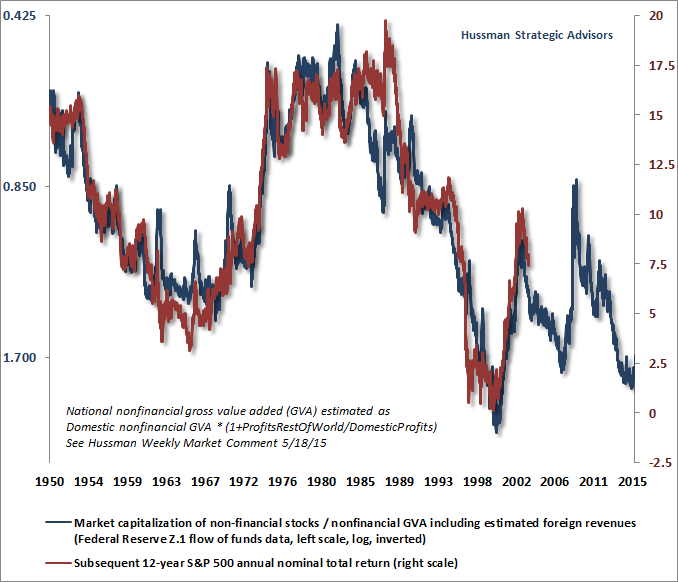
The chart above has an interesting implication. Normally, we use a 10-year horizon to relate market valuation to actual subsequent nominal total returns in the S&P 500. But as indicated above, the most appropriate horizon over which to expect full mean reversion is actually closer to 12 years. To demonstrate this, the following chart shows the ratio of MarketCap/GVA on an inverted log scale (left) versus the actual subsequent 12-year S&P 500 nominal total return. This result, to me, is striking, and indicates that from the May 2015 market peak, investors should expect a 12-year total return on the S&P 500 (out to May 2027) averaging only about 1% annually.
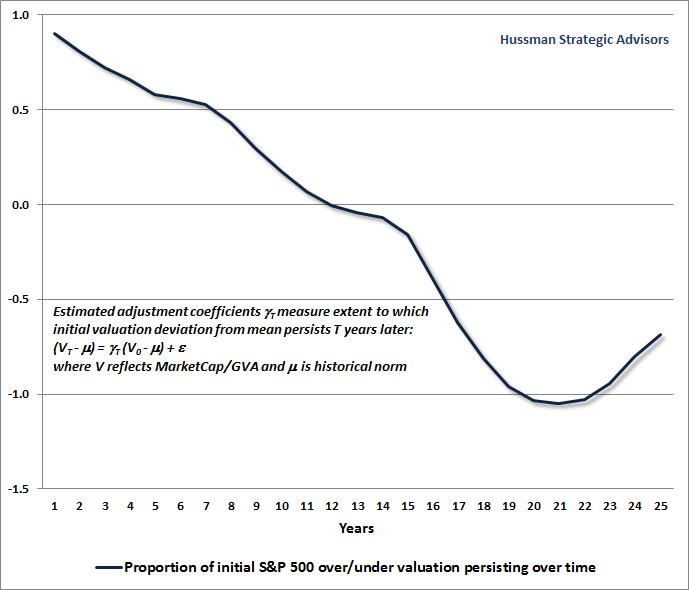
Notice something on the chart above. While valuations and actual subsequent market returns are extremely well-correlated over time, we should still expect the largest “errors” in the chart to be associated with points where valuations were furthest away from their historical norms at the end of a given 12-year horizon. In particular, we would expect actual market returns to have overshot the expected return in 1986-1988 (corresponding to the 1998-2000 bubble peak, 12 years later). That’s exactly what we see, and exactly why we see it. Mean-inversion Having detailed the systematic mean-reversion of reliable valuation measures over time, it turns out that we need to coin a new term: mean-inversion. The definition of “invert” is “to put upside down, or in the opposite position, order, or arrangement.” For valuations to mean-invert, then, is for extreme valuations to be followed some years later by a similar deviation, but entirely in the opposite direction. The next chart, if you’re a long-term bull, may very well make you sick. It shows the proportion of initial over- or undervaluation in the S&P 500 that has persisted, on average, as time progresses. But in this chart, I’ve extended the time horizon beyond 12 years. Risk-seeking among investors can often defer the immediate consequences of extreme valuations, while vertical losses can suddenly emerge when extreme overvaluation is joined by increasing risk-aversion among investors (as evidenced by deterioration in broad market internals). In any event, investors should expect market overvaluation or undervaluation to be reliably “worked off” within a period of about 12 years, on average. That’s mean-reversion, but that’s not where the process ends. Rather, the valuation extremes of the market tend to be fully inverted over a horizon of about 18-21 years; ending with extremes of the same degree but in the opposite direction. That’s what we’ll call “mean-inversion.” Statistically, a period of somewhere close to two decades has typically stood between the wildest exuberance and the deepest despair on Wall Street, and vice-versa. Valuations remain on the wildly exuberant side here.
While the concept of mean-inversion seems strange – almost preposterous – it actually aligns very well with what we know about so-called “secular” market phases. Specifically, we can describe a “secular bull market” as a period that comprises a number of individual bull-bear market cycles, typically reaching successively higher valuations at the peak of each bull market advance. Conversely, a “secular bear market” comprises a number of individual bull-bear market cycles, typically reaching successively lower valuations at the trough of each bear market decline. These “secular” bull and bear phases are each commonly recognized as lasting somewhere about two decades. The chart above is simply the statistical footprint of those long secular swings between extremes of fear and greed. Following the panic of 1908, the stock market enjoyed total returns averaging 14% annually until the 1929 peak. The culmination of that advance was a 9-year period when stocks enjoyed total returns averaging nearly 26% annually. The most memorable secular bear period in U.S. history then began, running from 1929-1949. During those two decades, the stock market would turn in a nominal total return of less than 1% annually, including an interim loss approaching 90%, and a negative real return overall. That period was followed by a secular bull phase from 1950-1965, during which the S&P 500 turned in a nominal total return of about 17.5% annually. The secular bear period that followed from 1965-1982 again left investors with a negative real return after inflation. The 1982-2000 advance represented a classic secular bull market period, and produced a total return for the S&P 500 averaging 20% annually. By the 2000 peak, valuations were so extreme that reliable valuation measures accurately projected negative total returns on a 10-year horizon (as we estimated at the time). The nominal total return of the S&P 500 since the 2000 peak has averaged just 3.5% annually, but even that gain is entirely due to the fact that valuations have again been pushed to offensive extremes. We fully expect that entire total return to be wiped out over the completion of the current market cycle. Doing so would not even bring the most reliable valuation measures back to their historical norms. The beginning and end of secular phases are generally identified on a valuation basis, not on a price basis, so we continue to view the most recent secular peak as being 2000, even though prices are higher today. The 2009 low is often discussed as a “secular” valuation trough. It didn’t even come close. While I did emphasize after the 2008 plunge that stocks had become undervalued relative to historical norms, remember that valuations similar to the 2009 trough were followed, in the Depression, by a further two-thirds loss in the value of the stock market. The market would have had to decline by an additional 50% to match the valuations observed at prior secular lows. I’ve regularly detailed the challenges that followed from my insistence on stress-testing our methods against Depression-era data, and how we fully addressed them in mid-2014. We don’t require anything near valuation levels of 2009, much less 1974 or 1982, in order to encourage a constructive position – provided that we observe an improvement in market internals. But investors shouldn’t kid themselves into thinking that some 18-20 year “count” began in 2009 from which many more years of advancing prices should follow, despite obscene valuations that already eclipse those of 1907, 1929, 1937, 1965, 1972, 1987, and 2007. If there’s any 18-20 year “count” to be considered, investors might consider the one that began at the 2000 peak. They might also consider that the market peak in May of this year reached valuations more extreme than we observed at the beginning of every secular bear phase except 2000. The good news here is not only that secular bear markets contain a series of individual cyclical bull market advances, but also that the low of a secular bear, from a price perspective, has typically occurred earlier than the low from a valuation perspective (for example, the lowest price of the 1965-1982 secular bear was actually in late-1974). So even if we’ve got a full-fledged secular bear phase in our future, the likelihood is that there will be more than enough conditions under which a constructive or even aggressive investment stance is appropriate. My expectation is that disciplines capable of responding to changing valuations and investor risk-preferences should do just fine. The real problem is for passive investors, where the period of depressed overall returns that began in 2000 appears likely to continue, and probably worsen, until much more durable support from valuations is established. The foregoing comments represent the general investment analysis and economic views of the Advisor, and are provided solely for the purpose of information, instruction and discourse. Please see periodic remarks on the Fund Notes and Commentary page for discussion relating specifically to the Hussman Funds and the investment positions of the Funds. --- The foregoing comments represent the general investment analysis and economic views of the Advisor, and are provided solely for the purpose of information, instruction and discourse. Prospectuses for the Hussman Strategic Growth Fund, the Hussman Strategic Total Return Fund, the Hussman Strategic International Fund, and the Hussman Strategic Dividend Value Fund, as well as Fund reports and other information, are available by clicking "The Funds" menu button from any page of this website. |
|||||||||||||||||||||||||
|
For more information about investing in the Hussman Funds, please call us at
1-800-HUSSMAN (1-800-487-7626) 513-326-3551 outside the United States Site and site contents © copyright Hussman Funds. Brief quotations including attribution and a direct link to this site (www.hussmanfunds.com) are authorized. All other rights reserved and actively enforced. Extensive or unattributed reproduction of text or research findings are violations of copyright law. Site design by 1WebsiteDesigners. |