|
|
||||||
|
|

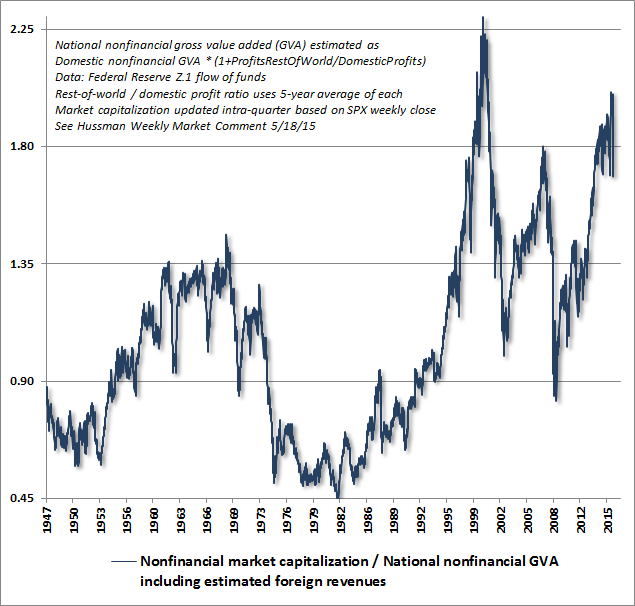
January 25, 2016 Wicked Skew: When Extreme Losses are Standard Outcomes Following the market decline of recent weeks, historically reliable valuation measures remain roughly 80-90% above the norms that have been reached or breached by the completion of every market cycle in history, including recent cycles as well as market cycles prior to the 1960’s, when bond yields were similarly low. Treasury yields have been below 3% during about 30% of the past century, but the most historically reliable equity valuation measures have been higher than present levels in only about 2% of history, primarily around the 2000 market peak. I emphasize the importance of using historically reliable valuation measures because there are certainly many popular valuation measures that appear less extreme, but that also have only moderate or weak correlations with actual subsequent market returns. The chart below presents the ratio of nonfinancial market capitalization to corporate gross value added (MarketCap/GVA) which has the strongest correlation with 10-12 year S&P 500 total returns among any valuation measure we’ve studied.
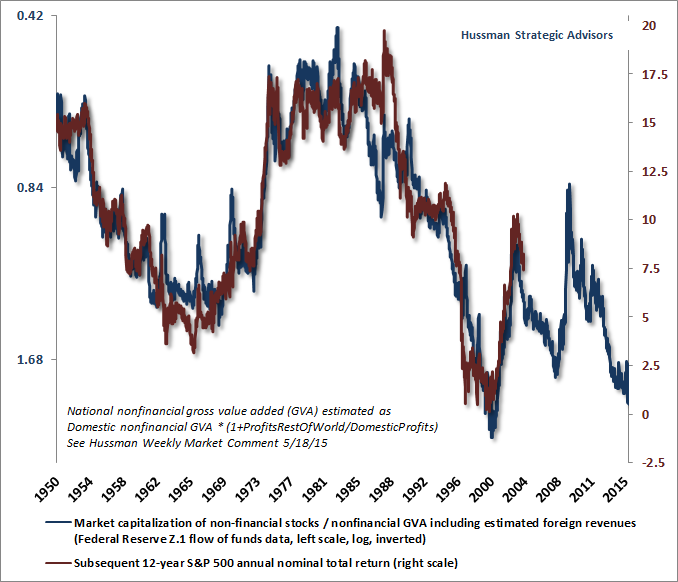
The chart below presents MarketCap/GVA on an inverted log scale (blue), along with the actual subsequent S&P 500 nominal annual total return over the following 12-year period (red). The good news is that the recent market retreat brought the 12-year prospective S&P 500 total return toward 2.5% annually in nominal terms. If this seems low, recall that the 12-year nominal S&P 500 total return following the more extreme 2000 market peak was actually negative. Consider the recent retreat as progress, but don’t imagine for a moment that it has gone a significant distance in resolving the distortion of years of yield-seeking speculation that the Fed provoked through its deranged policy of quantitative easing.
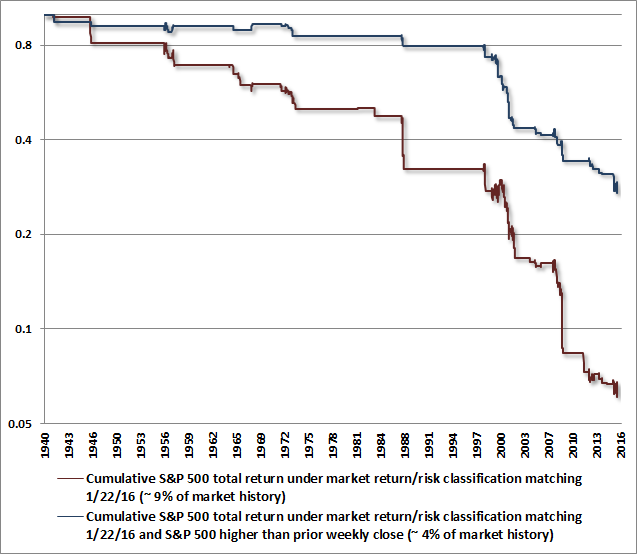
At present, market conditions join these extreme valuations with uniformly poor market internals, based on a broad range of individual stocks, industries, sectors, and security types, including debt securities of varying creditworthiness. Credit spreads spiked to fresh highs last week, and we’re increasingly concerned about the potential for negative events relating to European banks, where gross leverage ratios are a multiple of U.S. leverage ratios and credit default swap spreads have spiked upward. With respect to the market as a whole, I’ve periodically observed that market crashes typically only emerge after the market first loses something on the order of 14%, rebounds from its initial loss, and then breaks that prior support. That support level remains about the 1820-1850 area on the S&P 500. After selling down to that level last week, the market staged a nearly obligatory dip-buying advance, aided by a parade of central bankers brandishing their large but ineffectual bazookas at the World Economic Forum in Davos. The problem with such monetary hopes is two-fold. The first is that breathtaking interventions already pursued by global central banks have produced neither 2% inflation nor robust economic growth (which is not at all surprising given the historically weak correlation between central bank policy tools and the economic targets they imagine they can impact). The second problem, at least for stock market investors, is that in the absence of favorable market internals, central bank easing is associated not with market gains but with steep market losses (see When An Easy Fed Doesn’t Help Stocks, And When It Does). That’s because central bank easing during a period of poor market internals is almost exclusively a response to unexpected economic weakness, but since poor market internals signal risk-aversion among investors, safe low-interest liquidity is a desirable asset, rather than an inferior one. As a result, creating more of the stuff doesn’t provoke risk-seeking speculation, as it does when investors see cash as a hot-potato to be avoided. Put simply, unless market internals are favorable, central bank easing generally fails to support stocks, beyond very short-lived knee-jerk enthusiasm when those shifts are announced. With extreme valuations coupled with uniformly unfavorable market internals, the market return/risk classification we identify here could not be more hostile. In particular, relief rallies under current conditions tend to be truncated by fresh losses. The chart below shows the cumulative total return of the S&P 500 since 1940 (on a log scale) during periods that match the current market return/risk classification we identify (red), as well as during the subset of periods where the S&P 500 had also advanced over the prior week (blue). Much of the occasional choppiness in the red line is the result of relief rallies from prior market declines. Those can feel excruciating from a shorter-term perspective if one is tightly hedged. Though the blue line captures a smaller cumulative loss in the S&P 500, it's also smoother, which is because those relief rallies - once they're in - tend to fail. In either case, however, the average outcomes have been wicked. My use of such strong words here is not hyperbole; it’s a reflection of the terribly skewed return/risk profile that has historically been associated with market conditions similar to those we observe at present.
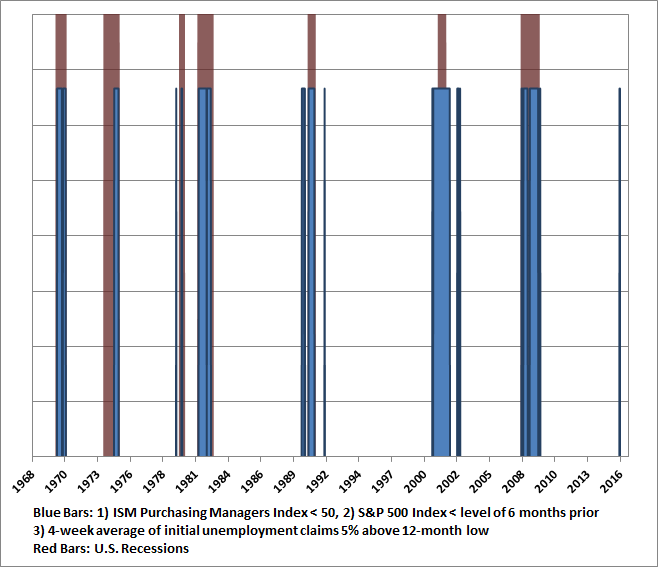
On the economic front, I continue to believe that a U.S. recession is not only a risk, but is now the most probable outcome. As I noted last week, among confirming indicators that generally emerge fairly early once a recession has taken hold, we would be particularly attentive to the following: a sudden drop in consumer confidence about 20 points below its 12-month average (which would currently equate to a drop to the 75 level on the Conference Board measure), a decline in aggregate hours worked below its level 3-months prior, a year-over-year increase of about 20% in new claims for unemployment (which would currently equate to a level of about 340,000 weekly new claims), and slowing growth in real personal income. Last week, new claims for unemployment jumped to 293,000, a level we’ve observed only once since last April. Even at this early point (given that employment measures are among the most lagging economic indicators), we already observe a pickup in claims from last year’s lows. To put this increase into perspective, the chart below shows points where the ISM Purchasing Managers Index was below 50, the S&P 500 was below its level of 6 months prior, and the 4-week average of initial unemployment claims was at least 5% above its 12-month low. While a year-over-year increase in unemployment claims closer to 20% would be a more reliable confirmation of recession, it’s clear that even here, the current combination of evidence is more associated with recession than not.
As usual, it’s important to be very clear about the hinge of market internals. If market internals were to improve materially on our measures, the immediacy of our recession and stock market concerns would be substantially reduced. Moreover, our response to central bank intervention would shift. In the presence of favorable market internals, easier monetary policy would be expected to encourage speculation in a way that we would not expect under present conditions. Market internals deteriorated further last week, and my impression is that an improvement is more likely after a much steeper market loss and a more extended basing process. That distinction relating to market internals is the central lesson to be drawn from our own challenges during the QE bubble. Following my insistence in 2009 (after a market collapse we fully anticipated) on stress-testing our methods of classifying expected market return/risk profiles, the resulting methods relied too strongly on overextended conditions that had consistently been followed quickly by market collapses in prior cycles across history. In the face of yield-seeking speculation intentionally encouraged by the Fed, one had to wait until market internals deteriorated explicitly before taking a hard-negative market outlook. See the Box in The Next Big Short: The Third Crest of a Rolling Tsunami if you're not familiar with that narrative. Presently, I view the likelihood of a U.S. recession as high. In light of the hostile market return/risk profile associated with present market conditions, I also increasingly suspect that the initial part of the completion of the current market cycle (though not the full completion) may emerge in the form of a nearly vertical loss, with a material break of the highly-monitored 1820 area on the S&P 500 as a likely catalyst for concerted selling by trend-following investors. A fairly run-of-the-mill outcome, in the context of present conditions, would be a further vertical retreat on the order of 14% following that break. Such a decline would take the S&P 500 to about 1560, which is interesting because that’s a widely followed level corresponding to the 2000 and 2007 market peaks. I doubt that the full market cycle would be completed by such loss, but even the most severe bear markets have had an ebb-and-flow that typically punctuates periods of decline with periods of stabilization and advance. I should emphasize that levels such as 1820 or 1560 have no particular economic meaning. Those points may prove interesting to monitor, but we don’t base investment decisions on such “support” or “resistance” points. As usual, our focus remains on the combination of valuations and market action. The fact is that the broad market has already clearly broken its late-2014 support levels (see for example the Value Line Arithmetic index). What makes widely-followed technical levels interesting to monitor is that they can serve as gathering points for concerted activity. If one views the equity market as a complex system comprising both a balancing feedback loop of value-conscious investors and a self-reinforcing feedback loop of trend-following speculators (see Complex Systems, Feedback Loops, and the Bubble-Crash Cycle), there appears to be an enormous valuation gap separating the two that is likely to be closed now that market internals indicate that the self-reinforcing speculative loop has shifted from risk-seeking to risk-aversion. Remember also that every security that is issued must be held by somebody until that security is retired. It is quite simply impossible for investors to take money “out” of stocks in aggregate. All that can be done is to transfer ownership of existing shares to someone else. Whether that transaction occurs at a higher price or at a lower one depends only on whether the seller or the buyer is the more eager of the two. Even if a crash emerges, investors will not be “getting out” of stocks in aggregate, nor will there be any additional “cash on the sidelines” that is “taken out of the market” as a result of the decline. Secondary markets don’t work like that, regardless of how often the parade of heads on the financial channels might repeat this nonsense. If Ricky sells stocks to Mickey, the “cash on the sidelines” that Mickey previously held simply ends up in Ricky’s hands instead. At the 1560 level, we estimate that the 10-12 year prospective nominal total return for the S&P 500 would increase to nearly 5% annually. That’s not compelling value by any means, but it would certainly be an improvement. Again, given the obscene valuation extremes at the recent market peak, I doubt that the full market cycle would be completed by such a shallow decline. Investors who rule out a near-term loss of that magnitude, or a much larger loss over the completion of this market cycle, are discarding evidence from a century of market cycles. That said, every share of stock outstanding will have to be held by someone at every moment in time over the completion of this market cycle, and the best investors to do so are those who have chosen that course mindfully after considering our own concerns. I certainly have no objection to investors who recognize these concerns (or disregard them) and choose to maintain their equity market exposure, provided that their risk preference and portfolio horizon are sufficient to tolerate significant market losses.The foregoing comments represent the general investment analysis and economic views of the Advisor, and are provided solely for the purpose of information, instruction and discourse. Please see periodic remarks on the Fund Notes and Commentary page for discussion relating specifically to the Hussman Funds and the investment positions of the Funds. --- The foregoing comments represent the general investment analysis and economic views of the Advisor, and are provided solely for the purpose of information, instruction and discourse. Prospectuses for the Hussman Strategic Growth Fund, the Hussman Strategic Total Return Fund, the Hussman Strategic International Fund, and the Hussman Strategic Dividend Value Fund, as well as Fund reports and other information, are available by clicking "The Funds" menu button from any page of this website. |
|||||||||||||||||||||||||
|
For more information about investing in the Hussman Funds, please call us at
1-800-HUSSMAN (1-800-487-7626) 513-326-3551 outside the United States Site and site contents © copyright Hussman Funds. Brief quotations including attribution and a direct link to this site (www.hussmanfunds.com) are authorized. All other rights reserved and actively enforced. Extensive or unattributed reproduction of text or research findings are violations of copyright law. Site design by 1WebsiteDesigners. |