|
|
||||||
|
|

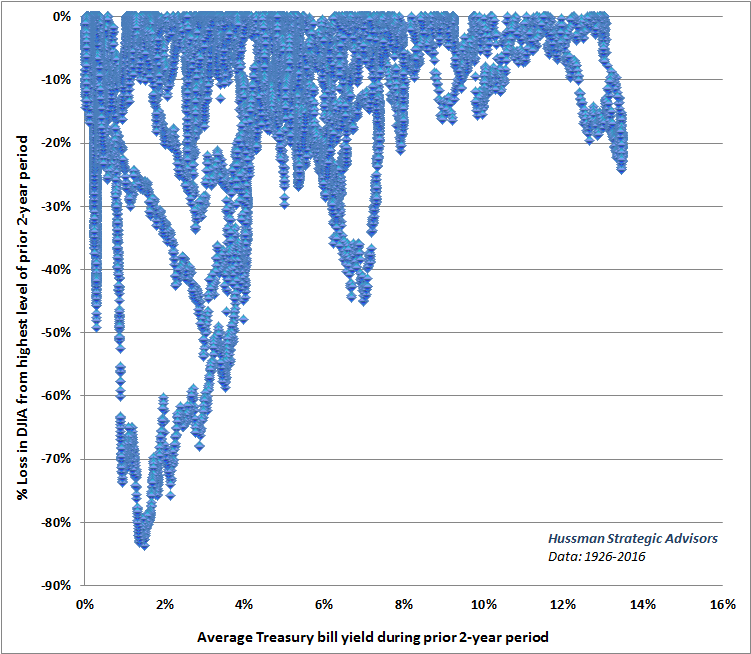
June 6, 2016 Over-Adaptation and Market Drawdowns The speculative premise here, as well as I can discern, seems to be that low short-term interest rates are “good” for the financial markets, and that in the absence of a material increase in interest rates by the Federal Reserve, speculative assets such as stocks, corporate credit, and even junk debt will be naturally driven higher, because they represent a desirable alternative to low-yielding, default-free liquidity. According to this premise, the fact, alone, that the S&P 500 dividend yield of 2.17% is higher than the 10-year Treasury yield of 1.71% should make it clear to anyone that stocks are still a competitive investment. The expectation of future dividend growth, then, only makes a compelling case more so. I think that’s the logic. The one little problem is that it wholly ignores precisely the thing that makes all of those speculative assets different from low-yielding, default-free liquidity: Risk. The argument follows only to the extent than one can rule out capital losses. See, the speculative premise outlined above comes with some verifiable implications. For example, we should expect that periods of low interest rates should be associated, generally, with shallower overall market losses across history. Unfortunately, just the reverse is true. The chart below shows data from 1926 to the present, plotting the loss in the Dow Jones Industrial average from its highest level of the preceding 2-year period, against the average Treasury bill yield over that period. Notably, the deepest market losses (those that followed the 1929, 1937, 2000, and 2007 market peaks) were actually associated with relatively low short-term yields.
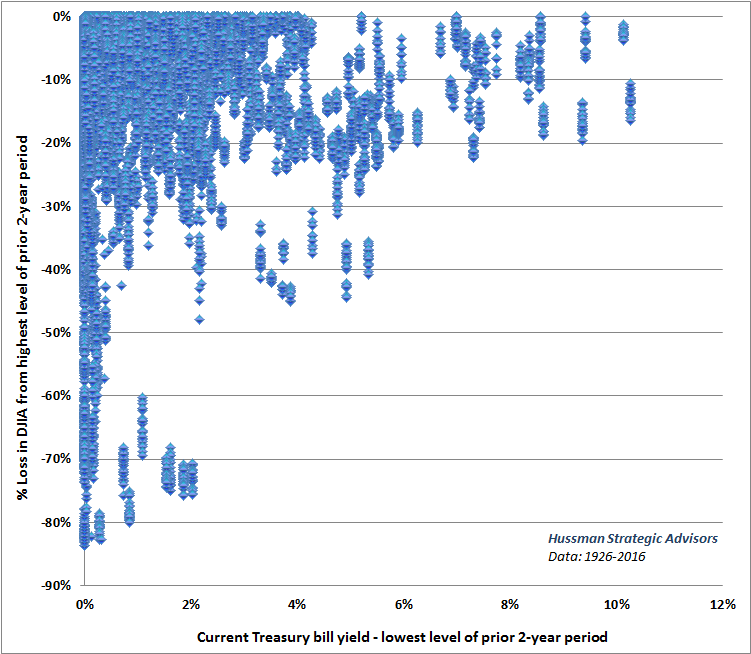
But maybe we’re asking the wrong question. Maybe what matters isn’t the level of the yield, but the change. Surely, we should observe the shallowest market losses in periods where short-term interest rates were stable or falling. Again, unfortunately, the reverse is actually true. The deepest market losses in history were associated with no rise in short-term interest rates at all. The chart below plots the loss in the Dow Jones Industrial Average from its highest point over the preceding 2-year period, versus the change in Treasury bill yields from their lowest point over the preceding 2-year period.
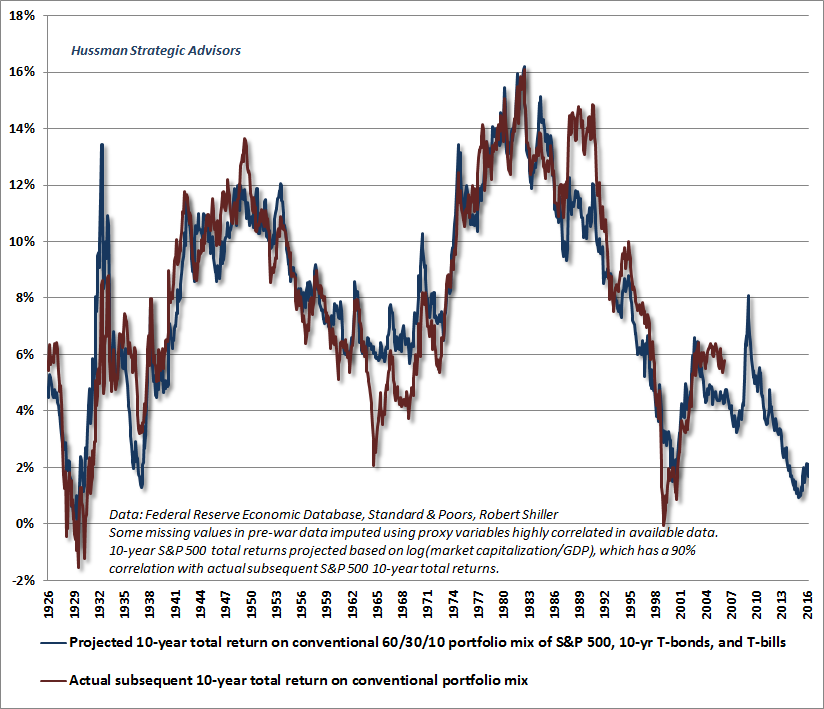
What’s going on here? You’re actually seeing the historical consequences of over-adaptation. In response to suppressed short-term interest rates, investors are encouraged to seek yield by reaching for higher-risk assets. As a result, sustained periods of relatively low short-term interest rates are typically associated with the most extreme valuations. It’s that overvaluation that really drives the subsequent losses. As soon as any underlying economic vulnerability is actually realized, investors quickly recognize that they’ve driven risk-premiums too low. Once investors shift from risk-seeking to risk-aversion, all bets are off. Even aggressive and persistent easing by the Federal Reserve is then unable to encourage speculation, because at that point, safe and default-free liquidity is viewed by investors as a desirable asset rather than an inferior one. Investors can observe this dynamic in the 1929-1932 collapse, the 2000-2002 plunge, and the 2007-2009 global financial crisis. An extended period of modest interest rates encourages investors to forget what I often call the “Iron Law of Valuation”: the higher the price an investor pays for a given set of future cash flows, the lower the long-term investment return one can expect. With every increase in price, what was “expected future return” only a moment earlier is immediately transformed into “realized past return,” leaving less and less future return on the table. Investors over-adapt to low short-term interest rates by chasing yields and driving up the valuations of much riskier securities (mortgage securities during the housing bubble, equities, corporate debt, and covenant-lite junk securities in the current episode). The rising asset prices also convince investors that risky assets really aren’t actually risky, and a self-reinforcing bubble results. Ultimately, low interest rates aren’t followed by high investment returns at all. Rather, low interest rates encourage concurrent yield-seeking speculation for a while, but after an extended period of yield-seeking, the overvaluation is followed by awful subsequent outcomes over the completion of the market cycle. I try to avoid naming the errors of others without immediately pointing out my own. For my part, my greatest mistake in the advancing half-cycle since 2009 wasn’t due to a suspension of the Iron Law of Valuation, but to an excessive focus on extreme “overvalued, overbought, overbullish” warning signs that had regularly been followed by market plunges in previous market cycles across history. What was “different” this time is that the Federal Reserve aggressively and intentionally encouraged speculation in the financial markets even after historically relevant warning signs repeatedly emerged. One had to wait for market internals to deteriorate explicitly - indicating a shift by investors from risk-seeking to risk-aversion - before adopting a hard-negative market outlook (see the Box in The Next Big Short for the full narrative, and the adaptations that we introduced in response). Central bank easing may have encouraged over-adaptation to a far greater extent than usual in the half-cycle since 2009, but this also makes the probable completion of this market cycle even worse. The entire financial market has become a house of cards resting on a "carry trade" mentality that every speculative asset is safe as long as it yields more than Treasury bills do. As we also observed in 2000 and 2007, notions like risk premiums or potential capital losses occupy no space in the current mindset. Unless one wishes to dispense with a century of market history, investors should recognize that there is not a single market cycle where prospective 10-year annual market returns (based on reliable valuation measures) did not reach the 8-10% level by the completion of the cycle. As detailed in numerous prior market comments, current valuations are instead consistent with 10-year S&P 500 nominal total returns of roughly zero, and 12-year expected total returns of just 2% (see for example Blowing Bubbles: QE and the Iron Laws and Choose Your Weapon). Moreover, with 10-year Treasury yields at just 1.71%, investors should not be comparing the dismal return prospects of bonds with the dismal return prospects of stocks, in an attempt to justify continued yield-seeking. Rather, investors should recognize that prospective investment returns on all components of a conventional asset mix are now offensive. Indeed, the prospective return on a conventional 60%, 30%, 10% mix of stocks, Treasury bonds, and T-bills has been driven to the lowest level in history outside of March 2000, January-March 1937, January-September 1929, and a momentary episode in March-May 1930 when the stock market rebounded nearly 50% from its 1929 crash lows before failing and taking the DJIA down -89% from its peak by 1932. The chart below presents estimated 10-year total returns on a conventional asset mix, along with actual subsequent 10-year returns (see The Coming Fed-Induced Pension Bust for more).
Consider a historically “normal” profile of expected returns. From 1926 to the present, median expected 10-year equity total returns have been 9.4%, with a post-war, pre-bubble norm of 11.2%, both estimated using the same valuation measures that currently project about zero for the coming decade. For 10-year bonds, the corresponding medians have been 4.0% and 6.3%. Even if we were to scale these medians down to correspond to the current 1.7% Treasury bond yield, we would still expect the S&P 500 to be priced for expected 10-year nominal total returns of about 7%, which would place the S&P 500 Index somewhere around 1350. That said, there’s actually quite a weak correlation between prospective returns on equities and 10-year bond yields. Indeed, outside of the disinflationary period from 1982-1998, the historical correlation between interest rates and equity yields is about zero, and outside of the inflation-disinflation cycle from 1970-1998, the correlation is actually negative. Suppressed interest rates (particularly on the short-end) may very well encourage investors to over-adapt and speculate by reaching for yield, but once equity valuations reach extreme levels, interest rates exert very little influence on the tendency for equity valuations to mean-revert, and interest rates often plunge while stocks are declining. Overall, the correlation between the two is very loose. Most importantly, no market cycle in history has ended without bringing equity valuations down, and prospective returns up, to the 8-10% range or beyond. How to respond? How should investors respond to the current situation? In my view, investors should continue to save in a disciplined way, but maintain that saving (particularly incremental saving) in a fairly diversified set of defensive assets, including hedged equity, alternative assets, and unfortunately, even low-yielding default-free liquidity. In a weak economy, Treasury bonds may produce a “pickup” over T-bills, but recognize that 10-year Treasury yields need to rise by only 20 basis points for capital losses to wipe out a year of 1.7% interest income. For stocks, the relevant statistic for the S&P 500 isn’t the 2.17% dividend yield, but the roughly -26% decline that would be necessary to bring prospective 10-year returns even to 5%; a figure that we view as rather minimal given cyclical equity market volatility. A decline of -40% to -55% would presently be required to bring prospective 10-year S&P 500 total returns into the 8-10% range that has always been reached or surpassed during the completion of every other market cycle across history. With the adaptations we introduced in mid-2014, our present methods only encourage a hard-negative market outlook in about 9% of periods across market history (about 25% of periods since 2000). The current period is among that subset, at least until valuations or market internals improve. Accordingly, short positions and negative beta exposures may be reasonable here, but should be used selectively. Precious metals and related equities have been a bright spot lately, but are extremely volatile and only appropriate for a limited portion of assets. Outside of deflation concerns that would be reflected by a strong dollar coupled with sharply widening credit spreads, gold stocks are typically supported by relatively weak economic conditions, depressed valuations (e.g. a relatively high gold price/XAU ratio), falling Treasury yields, and at least modestly rising inflation trends. We still observe all of these at present, though we wouldn’t be aggressive about it. In order to lay out all possibilities, even unlikely ones, I should also note that if market internals improve sufficiently, and economic activity recovers to levels even consistent with the period prior to mid-2014, we would likely view a moderately constructive outlook (ideally with a strong safety net) as appropriate for some period of time, despite extreme valuations. Investor psychology typically dominates valuations over the shorter-term, but in prior market cycles there were limits to that. Unfortunately, as I’ve regularly noted since mid-2014, even the most extreme “overvalued, overbought, overbullish” warning signals go out the window when market internals reflect risk-seeking investor attitudes and central banks are encouraging further speculation through quantitative easing. Still, any further extension of this speculative bubble would only make the long-term consequences worse, hence the insistence on a continued safety net (e.g. a line of nearby index put options) in any event. Finally, for passive buy-and-hold investors, I don’t advocate any deviation from your discipline, but it’s important to align your portfolio both with your tolerance for loss, and with your investment horizon. At current valuations, the S&P 500 is effectively an asset with a nearly 50-year duration. At historically normal valuations the effective duration would be closer to 25 years. Simply from the standpoint of aligning the duration of one’s assets with the duration of one’s spending plans, a passive investor should hold a smaller position in equities, as a fraction of their total assets, than they would if valuations were in a lower range. That’s not market timing; it’s straightforward financial planning. You don’t need to act on our expectation of a 40-55% market loss over the completion of this cycle, but do consider your ability to maintain your discipline, and be sure now that you could tolerate that outcome. Central bankers encouraged speculation in the recent half-cycle well after extreme and historically reliable warning signs emerged, and we had to adapt accordingly, but our concerns have repeatedly been correct over the completion of prior market cycles, and to the correct magnitude. There will be opportunities on the other side of this madness, as there were after the tech bubble and the global financial crisis. As I’ve frequently observed, the strongest market return/risk profiles we estimate are associated with a material retreat in valuations coupled with an early improvement in market action. With regard to the difficult and awkward transition that began with my insistence on stress-testing our classification methods against Depression-era data in 2009, and ended with adaptations we introduced in mid-2014, we’ve satisfied any need or inclination to stress-test our methods against additional data sets (which at the point would require us to gather information from the Dutch tulip bulb craze or the South Sea bubble). As a side-note, since mid-2014, the broad market has been flat, but market internals have deteriorated, with many individual stocks behaving weaker than the capitalization-weighted indices. That’s been a challenge for some hedged-equity strategies, as it was in the year prior to the 2007 peak (see When Value Mavens Lag), but that feature of a topping market is separate and generally temporary. It’s important to emphasize that our present methods would encourage a constructive or leveraged investment outlook in about 70% of periods across history, and more than half of periods even since 2000. My misidentification as a “permabear” is an artifact; not only of the challenging transition between 2009 and mid-2014 that I’ve openly addressed, but of a stock market that, even after returning to one of the most obscenely overvalued points in history, has enjoyed a total return of less than 4% annually in the S&P 500 since 2000, virtually all of which is likely to be wiped away by even a run-of-the-mill completion of the current market cycle. Put simply, present extreme valuations, on historically reliable measures, suggest that investors have over-adapted to suppressed short-term interest rates. Sustained periods of low short-term interest rates encourage yield-seeking speculation, which amplifies concurrent market returns for a time, but leaves financial markets vulnerable to wicked losses over the completion of the market cycle. Once extreme valuations are in place, the losses that follow have everything to do with that overvaluation, and nearly nothing to do with the behavior of interest rates. Indeed, the worst market losses across history have been associated with relatively low short-term interest rates during the collapse and the absence of any material hike in interest rates at all as the collapse unfolds. Investors have convinced themselves to tolerate historic valuation extremes, confident that stocks can’t fall unless interest rates rise. They’ve walked right into this setup because they don’t recognize it, and neither central bankers nor the investment profession appear interested in admitting the increasingly pressing risks that they themselves have been complicit in creating.The foregoing comments represent the general investment analysis and economic views of the Advisor, and are provided solely for the purpose of information, instruction and discourse. Please see periodic remarks on the Fund Notes and Commentary page for discussion relating specifically to the Hussman Funds and the investment positions of the Funds. --- The foregoing comments represent the general investment analysis and economic views of the Advisor, and are provided solely for the purpose of information, instruction and discourse. Prospectuses for the Hussman Strategic Growth Fund, the Hussman Strategic Total Return Fund, the Hussman Strategic International Fund, and the Hussman Strategic Dividend Value Fund, as well as Fund reports and other information, are available by clicking "The Funds" menu button from any page of this website. |
|||||||||||||||||||||||||
|
For more information about investing in the Hussman Funds, please call us at
1-800-HUSSMAN (1-800-487-7626) 513-326-3551 outside the United States Site and site contents © copyright Hussman Funds. Brief quotations including attribution and a direct link to this site (www.hussmanfunds.com) are authorized. All other rights reserved and actively enforced. Extensive or unattributed reproduction of text or research findings are violations of copyright law. Site design by 1WebsiteDesigners. |