|
|
||||||
|
|

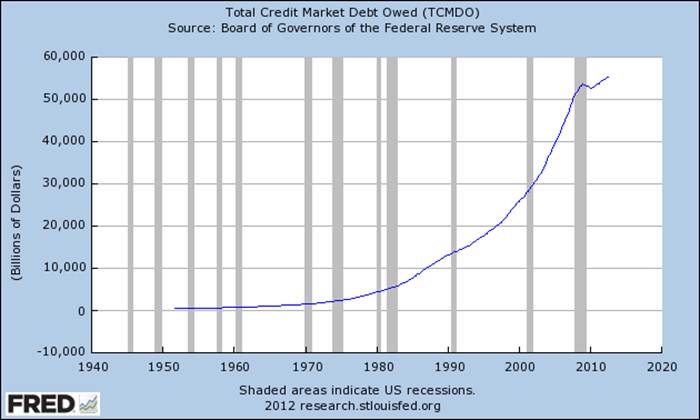
December 24, 2012 Aspirin for a Broken Femur Since 2009, both the stock market and the broad U.S. economy have been dependent on perpetual support from massive federal deficits and unprecedented money creation. Meanwhile, Wall Street is content to ignore the extent of this support, and looks on every movement of the economy as a sign of intrinsic health – which is a lot like admiring the graceful flight of a dead parrot swinging by a string from the ceiling fan. To put some numbers on this, it’s worth noting that since 1940, the S&P 500 has achieved an average annual total return of 14.5% in weeks where it was above its 200-day moving average as of the prior week’s close, and just 4.4% when it was below its 200-day moving average (only slightly more than the 4.2% average Treasury bill yield during that time, and with deep drawdowns usually concentrated in this partition). By contrast, since 2009, the S&P 500 has achieved an average total return of just 5.4% annually when it has been above its 200-day average, versus 36.7% when it has been below. Put another way, advancing trends above the 200-day average have repeatedly failed, making limited net progress overall, but declines have been halted and often breathtakingly reversed with each intervention. This pattern also reflects an unfinished cycle, the completion of which is likely to significantly damage the appeal of reflexively “buying the dip.” The recent pattern isn’t just an artifact of the rebound from the 2009 low. Even since 2010, the S&P 500 has gained just 1.5% annually when it has been above its 200-day moving average, versus a striking 46.3% annual return when it has been below. Needless to say, this pattern is not necessarily indicative of how the S&P 500 will behave in the future, and is in fact contrary to the historical pattern. Policy makers have committed a staggering amount of fiscal and monetary resources to kick-the-can strategies, following policies that ultimately cannot be sustained, in order to prevent outcomes that ultimately cannot be prevented. The eventual restructuring of unserviceable mortgage, sovereign, and financial debt is among those outcomes. A quick look at how the deleveraging of the U.S. economy is going - total credit market debt has now reached $55 trillion, including government, corporate and household sectors, representing 3.5 times GDP (down only slightly from the 3.8 multiple observed at the recession trough of early 2009). To put this in perspective, every 100 basis point change in interest rates on maturing and refinanced debt now implies a redistribution of income between borrowers and lenders on the order of $500 billion annually. The Fed has worked tirelessly to ensure that borrowing is as cheap as possible – the risk being that any departure from that would give every interest rate change of one percent an annual economic effect the same size as the “fiscal cliff.”
Several months ago, we noted the tendency of massive monetary interventions, both in the U.S. and internationally, to provoke beyond a short-run mean reversion in stock prices (see What if the Fed Throws a QE3 and Nobody Comes?). Specifically, each successive round of quantitative easing has been successful only in the limited sense of helping the stock market reverse the loss that it experienced over the preceding 6-month period. On the economic front, quantitative easing has had even less effect, aside from provoking short-lived bursts of pent-up demand for a quarter or two. The stock market is only a few percent from its 6-month high at present, and even an overextended move to about 1490 would put the S&P 500 at its upper Bollinger band (two standard deviations above the 20-period moving average) on daily, weekly and monthly resolutions. That’s something that we saw back in early 2011 (see Extreme Conditions and Typical Outcomes), when the S&P 500 Index was only about 5% below where it is today, and again in September 2012 (see Low Water Mark) when the S&P 500 was above where it is today. Overextended moves like that, coupled with other features of an overvalued, overbought, overbullish syndrome, are typically associated with awful outcomes over the following 6-18 months, though not always immediately. Aside from the early 2011 instance, which was followed by a nearly 20% plunge before Bernanke launched QE2, and the September 2012 instance, the outcome of which remains to be seen, other points where the S&P 500 has reached its upper Bollinger band on a monthly resolution, an overvalued Shiller P/E above 18 (S&P 500 divided by the 10-year average of inflation-adjusted earnings), a 20-point spread between advisory bulls and bears, and an overbought S&P 500, 8% above the 52-week average and at least 50% above its 4-year low include: early 2007 and late 1999 – both just before separate 50% market losses, mid-1998 before the market plunge associated with the Asian crisis, August 1987 before the October 1987 crash, and late 1972 as the market rolled over into a 50% market plunge. Notably, one instance – the span from mid-1996 to early 1997 during the late-1990’s market bubble – was followed by strong continued gains. While the 2009 market decline wiped out the entire total return that the S&P 500 had achieved in excess of Treasury bills, all the way back to June 1995, it’s fair to note that overextended market conditions did not produce losses in short-order in the midst of that bubble. Following each market setback of the past few years, the kick-the-can rebounds back to overvalued, overbought, overbullish conditions have made the market seem like it is boundlessly running away. The reality is that the S&P 500 Index is presently within 5% of its level of April 2011 – more than 18 months ago – and even a few weeks ago the index was within about 11% of its April 2010 level. A correction comparable to the ones we observed separately in 2010 and in 2011, and not even qualifying as a bear market, would wipe out the total return of the S&P 500 since early 2010 (the point that our present ensembles would have moved away from a significant and sustained exposure to market risk). Since then, the market has been a chronicle of shakeouts from overbought highs and rescues at the first sign of material weakness. What has changed over the past few years, relative to history, is the enormous effort by the Federal Reserve to short-circuit not only ordinary corrections, but also the deeper and more typical resolution of the market cycle. Despite the near-term success of these rescues during the past couple of years, the sustainability of these interventions is increasingly questionable. On the fiscal side, we are likely to observe a combination of spending cuts and tax increases to reduce the federal deficit. The message from Republicans last week was that no tax increase of any kind is acceptable. We see no particular reason not to take them at their word on a matter that, right or wrong, is among their core principles. Accordingly, it seems likely that the U.S. will briefly go over the “fiscal cliff,” which will automatically kick in a rash of spending cuts and across-the-board tax increases, which Congress will then likely reverse a few days later with an agreement to both cut spending and also reduce the then-higher taxes for various income groups. Frankly, we’ll be surprised if the GOP agrees to vote for tax hikes before year-end when they can wait a few days and get the identical result by voting for tax cuts in January. Aspirin for a Broken Femur On the monetary side, the Federal Reserve has continued its policy of quantitative easing, but it is not at all clear that the Fed maintains much ability to drive long-term interest rates lower, absent a moderate further decline that we expect as a result of general economic weakness. The chart below depicts a version of the “liquidity preference” curve that we’ve regularly presented, but in this case, the 10-year Treasury yield is used instead of the Treasury bill yield. Even for long-term Treasury yields, a clear relationship between base money (per dollar of GDP) and interest rates is evident in the data, at least in data prior to 2008. However, note that the curve flattens significantly once the monetary base expands beyond about 10 cents per dollar of GDP. So well-before the crisis, one would have expected that moving long-term interest rates below 2% would be very difficult even in a non-inflationary environment. [Geek’s note - an inflationary environment would “fight” the attempt to expand monetary base per dollar of nominal GDP, as inflation would raise nominal GDP proportionately with the monetary base. Once inflation takes hold, expanding the monetary base can even result in rising interest rates, in which case inflation typically accelerates faster than base money, as we observed in the 1970’s].
In the past few years, the Federal Reserve has expanded the monetary base to about 18 cents per dollar of GDP, but predictably, it has been quite difficult to hold interest rates below 2% for extended periods. While further economic weakness could very well produce a period of stagnant or even somewhat lower yields for a few quarters, it is already clear that the link between further increases in base money and further reductions in long-term interest rates has become unreliable. Certainly, we don’t see the tight relationship that – at least for now – continues to hold for Treasury bill yields.
Despite this deterioration in the relationship, Ben Bernanke recently promised to continue quantitative easing until the employment rate improves to 6.5%, or 2-year inflation expectations exceed 2.5%. What is odd about this is that whatever benefit might be expected from quantitative easing only exists in the range of 5-12 cents of monetary base per dollar of nominal GDP, after which QE has no predictable effect even on long-term interest rates. Until we stop bailing out every new consequence of unserviceable debt both here and abroad, and instead proceed with restructuring of old debt and requiring adequate capital against new debt, there is nearly no end in sight to slow economic growth – ask Japan, which decided to pursue Bernanke’s prescription more than a decade ago. The Federal Reserve under Bernanke is like a bad doctor facing a patient with a broken femur. Being both unable and unwilling to restructure the broken bone, he announces that he will keep shoving aspirin down the patient’s throat until the bone heals. Despite virtually no relationship between the injury and the treatment, that femur might eventually heal enough on its own to allow the patient to hobble out of bed. But by then, the patient will need to be treated for liver failure. What’s even more bizarre is that everybody quietly knows this, but as he shoves another handful of aspirin down the patient’s throat, nobody proposes restructuring the broken bone, and they instead stand around helplessly saying “well, ya gotta do somethin’ don’t ya?” I continue to believe that most of the economic impact of policy changes in the past few years can be traced to a) the abandonment of accounting transparency by changing FASB rules, which allowed banks to suspend mark-to-market accounting and effectively relieved them of capital requirements, and; b) the U.S. guarantee of bad mortgage debt extended by Fannie and Freddie. Both of those policy changes will impose enormous costs over the long-term, but they did allow the financial system to abandon the immediate need to actually restructure bad debts. As noted above, with regard to stock prices, both U.S. and international experience with quantitative easing is consistent with the general tendency for stocks to recover the loss that they experienced over the preceding 6-month period, and for the economy to expand weakly for one to two quarters as the intervention releases a bit of pent-up demand. On a longer-term basis, however, we observe no consistent relationship between stock yields (or subsequent stock returns) and the monetary base, and have no historical or theoretical basis to support the idea that QE is helpful to the real economy. Decades of historical data are available to demonstrate that a 1% change in stock market value affects GDP by only 0.03-0.05%, and even that effect is transitory. Even launching a stock market bubble will get you less than 1% of short-lived GDP impact. Anyone who understands the basics of consumption theory and the concept of “permanent income” recognized this three years ago. Below, Fed liquidity is plotted against earnings yields. The chart uses cyclically adjusted earnings – the 10-year average of inflation-adjusted S&P 500 earnings – divided by the S&P 500 Index. This improves the fit, but still leaves a very unreliable relationship between the monetary base and stock valuations, even prior to 2008.
Notice that since bond yields have generally been closely related to the monetary base (at least in the range of 5-10 cents of base money per dollar of GDP) but stock yields have not, one would expect that stock returns have also not been very well-correlated with bond yields over time either. That expectation turns out to be correct (see Begging for Trouble). As a result, even if one presumes that Fed policy will reliably affect bond yields here, it doesn’t follow that stock valuations will be predictably affected. About the best one can probably hope for is that as we move out further to the right, stock yields will remain depressed for a while (stock valuations will remain elevated), at levels close to where they are at present, and not far from valuation levels that have regularly proved awful for long-term investors. As a side note, between 1929 and 2008, the quantity of base money generally fluctuated between 5 cents and 12 cents per dollar of nominal GDP. The exceptions were 1981, when Paul Volcker intentionally reduced the monetary base to less than 5 cents per dollar of nominal GDP, ending a 15-year period of escalating inflation in the process, and World War II, when the U.S. government ran massive deficits and the Fed more than doubled the monetary base. As a result, the quantity of base money rose as high as 17 cents per dollar of GDP in the early 1940’s. How did the Fed get the ratio of monetary base to GDP back to pre-war levels of less than 10 cents per dollar of GDP (a level that has historically been consistent with Treasury bill yields still only about 2%)? Did the Fed reverse course, as Bernanke promises can be done “in 15 minutes” to avoid inflation? No, it did not. Instead, the consumer price index shot up by 90% between 1940 and 1951, with the majority of that inflation in the back-half of the 1940’s. Stock prices churned and struggled, driving the Shiller P/E below 9 and leaving the S&P 500 index at two-thirds the level it had reached more than 20 years earlier. Then again, none of that is relevant to Wall Street – forget that the U.S. government continues to run massive deficits and the Fed has already tripled the monetary base, on course toward 27 cents of base money per dollar of nominal GDP by the end of next year. Somehow, investors remain comfortable in the belief that perpetual deficit spending and money creation will have no consequence, because this economy is somehow different from every other one in history. If that faith proves to be unfounded, as we expect it will – not over a year or two, but during the back-half of this decade – few of the policymakers responsible for getting us to this point will be around to answer for it. That’s why kick-the-can policies are so attractive. Still, it’s likely that Congress will agree to some amount of deficit reduction in the near-term. Given the economic identity that the surplus of one sector must equal the deficits of the other sectors, we’ve noted in recent months that U.S. corporate profit margins have been elevated about 70% above their historical norms as a result of massive federal deficits coupled with a low personal savings rate. While analysts seem happy to value stocks on the assumption that historically elevated profit margins will be sustained indefinitely, stock valuations appear unusually rich on the basis of normalized earnings, and any amount of deficit reduction is likely to press profit margins toward more typical levels. In my view, the economic underpinnings and depressed valuations that give rise to long-term, sustained secular bull markets remain well beyond where we are today. We will most likely experience a number of cyclical bull-bear markets before that point, and I would expect extended opportunities to accept market risk during those cycles. The best opportunities generally arrive at the point where significantly reduced valuations (often but not always to levels that would be considered “undervalued”) are followed by an early firming of market action. We observe no such opportunity at present. The foregoing comments represent the general investment analysis and economic views of the Advisor, and are provided solely for the purpose of information, instruction and discourse. Only comments in the Fund Notes section relate specifically to the Hussman Funds and the investment positions of the Funds. Fund Notes As of last week, market conditions remained characterized by an overvalued, overbought, overbullish, rising-yields syndrome that, coupled with other conditions, is associated with an unusually negative return/risk profile on our estimates. Strategic Growth remains fully hedged, with a staggered-strike hedge that raises the strike prices of our index put options closer to market levels. Still, we have been less aggressive than in past years to raise the strike prices of our put options, and they remain a few percent below present market levels, representing about 1.5% of assets going out to springtime. The Fund continues to underweight financials and various cyclically-sensitive and highly-leveraged stocks that investors classify as “risk-on” investments, while some of our larger holdings are in pharmaceuticals, dividend paying stocks and other sectors often classified as “risk off.” As a result, periodic days that heavily favor risk-on vs. risk-off stocks, or vice versa, can be a modest source of day-to-day Fund volatility. As always, we maintain a value-conscious, full-cycle perspective in our stock selection strategy, and I see these risk-on/risk-off variations as more a fact of life than a reliable driver of investment choices. To date, the Fed has been reasonably effective in convincing investors that they have a free virtual “put option” in Ben Bernanke. As a result, actual put options have been less effective in some market conditions than they have been historically, and we introduced restrictions to our hedging criteria earlier this year to limit the use of staggered strike positions – regardless of how negative our return/risk estimates are – to conditions where either market internals are unfavorable or hostile indicator syndromes (e.g. overvalued, overbought, overbullish) are already in place. As risk-conscious investors, the periodic combination of option premium decay and outperformance of “risk on” stocks has been uncomfortable. While the impact of QE has become progressively smaller in recent years, we’ve still had to work to contain the effects of these bouts of transient speculation. Of course, with the S&P 500 Index within a couple of percent of where it was in March, with our return/risk estimates still strongly negative, and with an army of hostile indicator syndromes in place since March, that change has had little opportunity to show an obvious effect on our investment positions just yet. As I’ve frequently noted, the introduction of ensemble methods for our return/risk estimates in 2010, and the smaller change to our hedging restrictions earlier this year, address what I view as the primary challenges of the recent market cycle – increasing the robustness of our approach to a broader range of market environments than we’ve observed in post-war data, and reducing (though possibly not eliminating) the adverse effect of monetary-induced speculative runs. Strategic International remains fully hedged, Strategic Dividend Value is hedged at about 50% of the value of its stock holdings, and Strategic Total Return continues to hold about 15% of assets in precious metals, just under 5% of assets in utility shares, and a duration of slightly more than 3 years (meaning that a 100 basis point move in interest rates would be expected to impact the Fund by about 3% on the basis of bond price fluctuations). Wishing you wonderful holidays, a very Merry Christmas, and hoping your Hanukkah was happy and bright. I’m grateful for your investment, for your trust, for your patience – though I expect not to ask nearly as much in the cycles ahead – and for the friendship and thoughtfulness that shows in the notes that some of you send my way. --- The foregoing comments represent the general investment analysis and economic views of the Advisor, and are provided solely for the purpose of information, instruction and discourse. Prospectuses for the Hussman Strategic Growth Fund, the Hussman Strategic Total Return Fund, the Hussman Strategic International Fund, and the Hussman Strategic Dividend Value Fund, as well as Fund reports and other information, are available by clicking "The Funds" menu button from any page of this website. |
|||||||||||||||||||||||||
|
For more information about investing in the Hussman Funds, please call us at
1-800-HUSSMAN (1-800-487-7626) 513-326-3551 outside the United States Site and site contents © copyright Hussman Funds. Brief quotations including attribution and a direct link to this site (www.hussmanfunds.com) are authorized. All other rights reserved and actively enforced. Extensive or unattributed reproduction of text or research findings are violations of copyright law. Site design by 1WebsiteDesigners. |