|
|
||||||
|
|

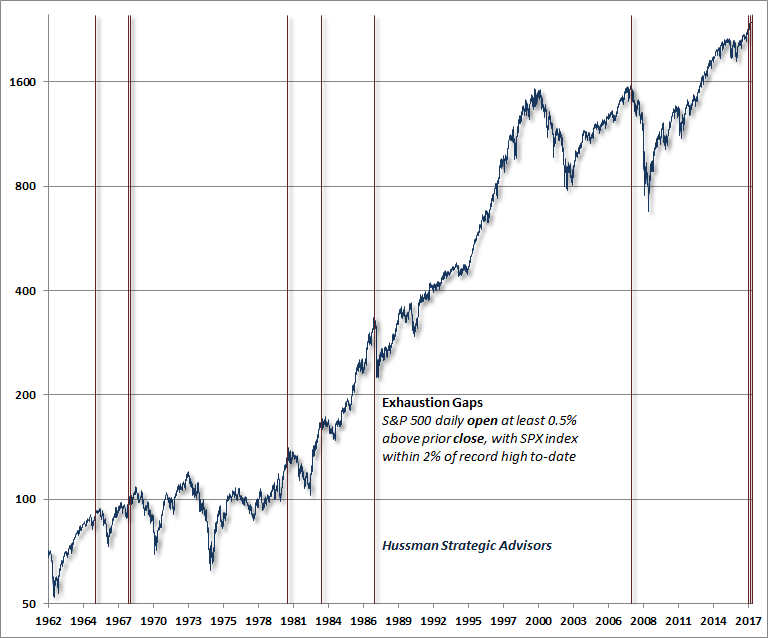
May 1, 2017 Exhaustion Gaps and the Fear of Missing Out Despite extreme valuations, investors’ fear of missing out is looking increasingly desperate. In market cycles across history, that has been an unfortunate impulse. On Monday, the major indices “gapped” higher on relief about the first round of French elections, with another opening gap for the Dow on Tuesday. A gap is a point where the opening price on a given day is materially higher than the prior day’s closing level. The stock market also gapped higher on March 1, which marked the record closing high for the S&P 500 to-date, as the banner headline on the CNBC news ticker read “Best Move: Just Buy Everything?” Gap openings are fairly common when a stock or the broad market breaks out from a significant low, or when crossing above some widely-followed moving average. These “breakaway gaps” are often on high volume, and reflect the coordinated belief among some set of investors that the overall trend has reversed. In contrast, when gaps occur after an extended advance, they are called “exhaustion gaps,” and they can signal desperation among investors to chase the prevailing trend. For individual stocks, these gaps are sometimes just temporary areas of consolidation. For the overall market, however, they tend to have far more hostile outcomes, particularly when they are associated with record highs, rich valuations, lopsided bullish sentiment, and deterioration in the uniformity of market internals. Last week, Bill Hester walked into my office with a version of the following chart, which he conceived while examining data on gap openings last week. The sheer simplicity of the conditions is striking, relative to the market outcomes that typically follow. The chart shows all days where the opening level of the S&P 500 was at least 0.5% above the prior day’s closing price, and the S&P 500 was within 2% of an all-time high. In some cases, those two conditions briefly preceded the final market high. In others, including August 1987 and October 2007, they occurred within a few days before or after the market peak.
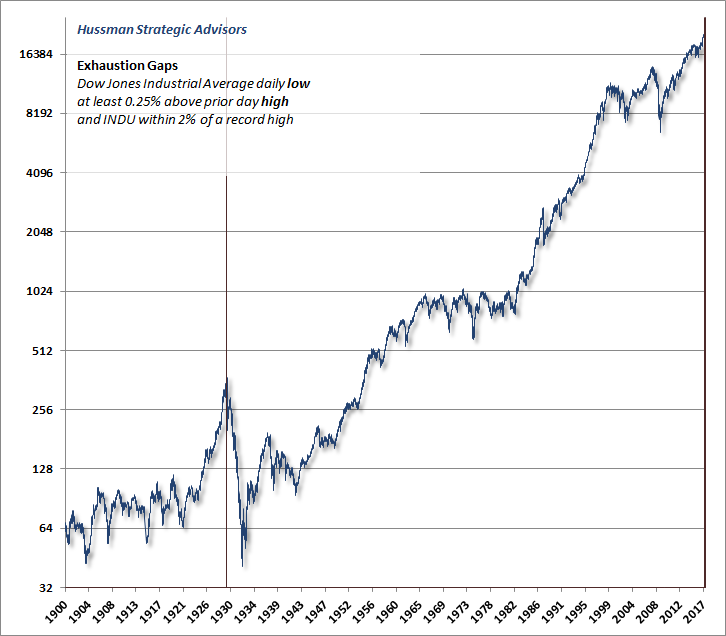
Bill and I wondered whether the same regularity held for the Dow Jones Industrial Average. One problem, unfortunately, is that opening data for the Dow becomes increasingly spotty the further one goes back in history, and often disagrees between data providers. Another problem is that as a price-based index, daily movements in the Dow can be slightly erratic because they are strongly influenced by its higher-priced members. Still, the question was interesting. Despite the spotty opening data, it's clear that if the daily low of the Dow Industrials is at least, say 0.25% above the prior day’s high, there must be a gap as well. The chart below shows all of the points where this occurred within 2% of a record high. Clearly, the criteria are too tight. They only capture two instances in market history: a series of three daily signals in August 1929, and the signals we’ve observed in recent weeks.
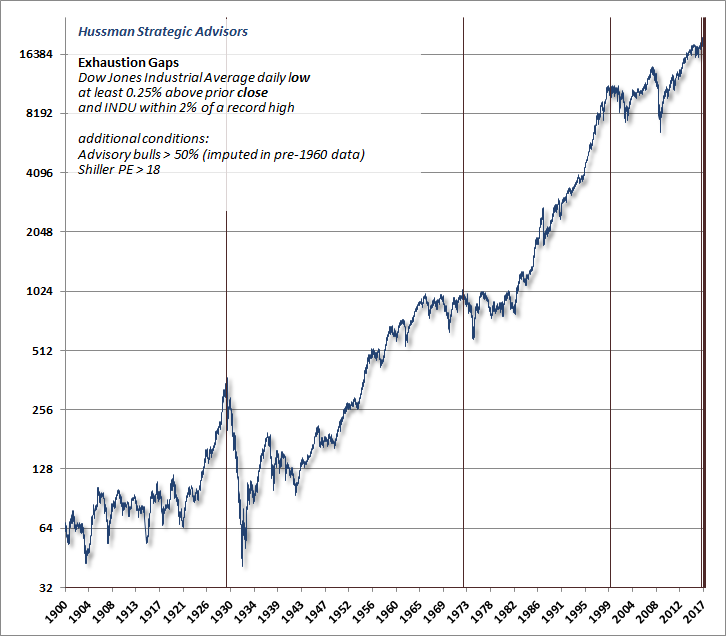
A looser condition is to look for points where the daily low of the Dow Industrials is at least 0.25% above the prior day’s close, without requiring that the low be all the way above the prior day’s high. That condition captures several additional instances, but a handful of these are false signals, invariably occurring at points where “all time high” wasn’t really synonymous with rich valuations or lopsided bullish sentiment. So the chart below tightens the criteria slightly, showing all days where the daily low of the Dow Industrials was at least 0.25% above the prior day’s close, the Dow was within 2% of an all-time high, the Shiller P/E was above 18, and advisory bullishness was greater than 50% Just a note on the choice of those additional criteria: we certainly think there are better measures than the Shiller CAPE, but it’s widely followed, and we’ve regularly used the 18 level in the past as a rough measure of overvaluation - the current level is close to 28. For bullish sentiment, a level of at least 47% (Investors Intelligence) tends to be an effective threshold of “overbullish” across history, but 50% seems less arbitrary. Those levels of bullish sentiment are usually associated with bearishness in the 20% range, the rest being in the correction category. We impute sentiment data prior to the 1960’s. Below, it’s clear that exhaustion gaps, particularly in the context of overvalued, overbullish conditions, are generally not friendly indications.
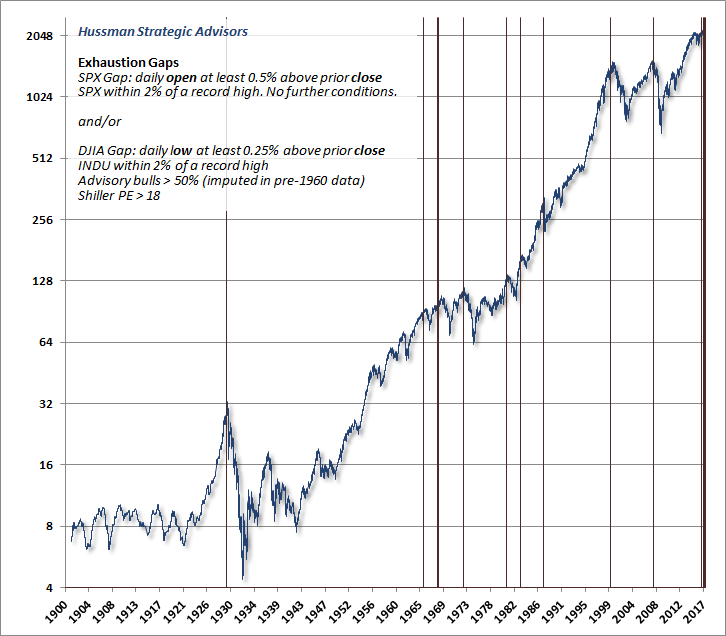
The chart below combines the S&P exhaustion gaps with those for the Dow Industrials. Given such simple criteria, the outcomes are rather disturbing.
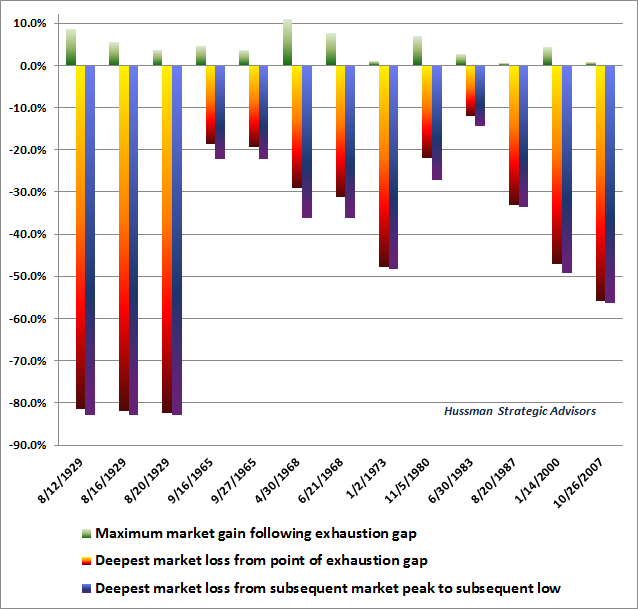
To offer a sense of the market return/risk profile that has typically been associated with exhaustion gaps at overvalued, overbought, overbullish extremes, the chart below shows the maximum gain and maximum loss in the market as measured from each instance to the subsequent bear market low. Multiple exhaustion gaps in the same market cycle are depicted separately.
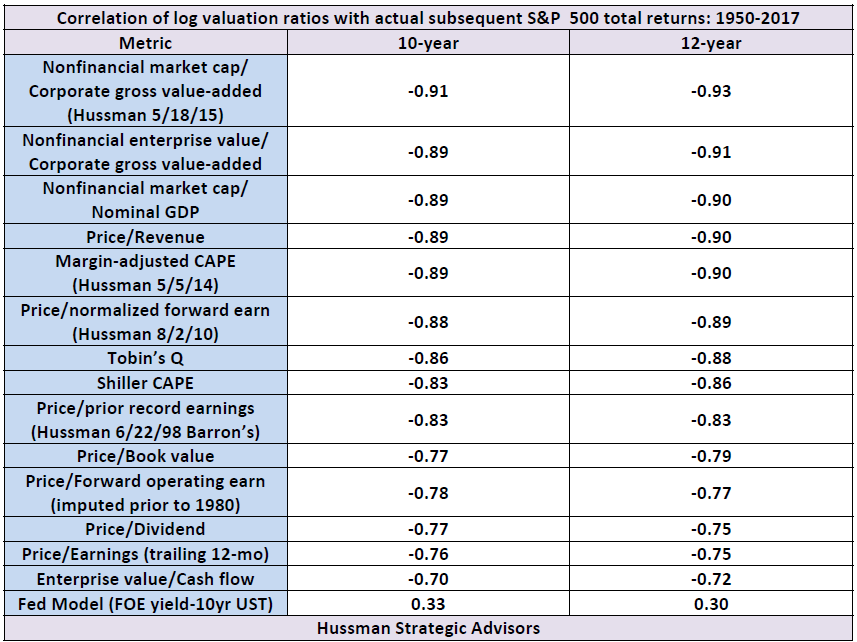
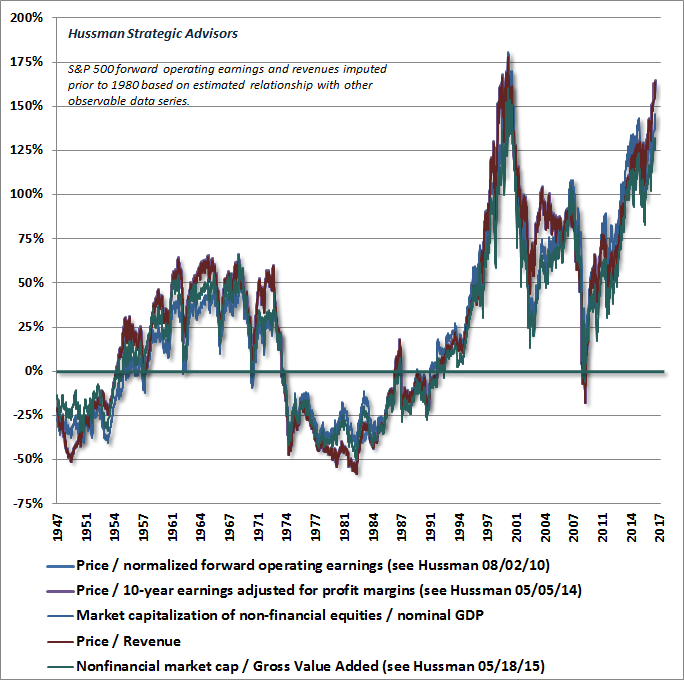
I recognize that my regular comments about the likelihood of the S&P 500 losing half or more of its value over the completion of this cycle may seem preposterous. A review of market history may help to understand these expectations, which are consistent with both the valuation evidence later in this comment, and with the outcomes that have typically completed prior speculative market cycles. Two caveats are important here. First, given the simplicity of the conditions that define an exhaustion gap above, and their reliance on daily market behavior, it’s not clear that investors should wait for such gaps in future market cycles if other danger signs are already present. The best way to view these exhaustion gaps, I think, is that they represent points, late in a bull market cycle, where investors become overwhelmed by fear of missing out (FOMO), leaving a lopsided equilibrium where the remaining pool of potential buyers evaporates and the pool of potential sellers becomes saturated. Conversely, it seems likely that simple daily signals like the exhaustion gaps above could be misleading in the future, if more robust measures still indicate persistent risk-seeking among investors. It’s important to recognize that the set of conditions we’ve reviewed here are very simple versions of “overvalued, overbought, overbullish” syndromes. I’ve regularly observed that my 2009 insistence on stress-testing our methods against Depression-era data resulted in methods that relied too heavily on the historical effectiveness of such syndromes. Unfortunately, the Federal Reserve’s deranged exercise in quantitative easing encouraged continued yield-seeking speculation among investors, even after extreme and previously reliable overvalued, overbought, overbullish syndromes emerged. In the face of zero-interest rate policy, one had to wait for explicit deterioration in the uniformity of market internals (signaling a shift toward increasing risk-aversion among investors) before adopting a hard-negative outlook. Most of the period since late-2014 has been characterized by the combination of extreme valuations and divergent market internals. Despite the fact that the S&P 500 Index is 14% higher since then, history suggests that this entire gain is likely to be wiped out in the blink of an eye, quite early in the completion of this cycle. This time is not different. Complacency is not your friend. We'll respond to the evidence as it changes. For example, if we were to observe a resumption of zero interest rate policy, and market internals were to recruit the same uniformity they exhibited prior to 2015, despite current valuation extremes, we would have to allow for a deferral of these risks. It’s unfortunate that our failure to do so through much of this cycle, as an inadvertent consequence of that 2009 stress-testing decision, has encouraged investors to forget how our discipline came out in the complete market cycles that ended with the 2000-2002 and 2007-2009 collapses. Because of that, it’s too easy to dismiss current objective market risks by pointing to our difficulty in the advancing portion of the recent cycle. My hope is that investors understand the distinctions here. Those distinctions are important, particularly at current extremes. I certainly shot myself in the heel early in this cycle, and hobbled through the first half as central banks pressed salt into the wound. Still, we’ve won enough races, and we’ve been open enough about the first half of this one, that it should be clear why the recent half cycle departed from our experience in other complete market cycles. Current market risks should be evident based on the data alone. As for our own discipline, the bullet has been pulled, and we’ve adapted and healed more than may be obvious, as we prepare ourselves for the hazardous terrain indicated by reliable signs. We can also allow for future episodes of QE and zero interest rate policy if they emerge. It’s not certain how this particular race will come out in the end, but then, I’ve kicked into a wicked second-half sprint more than once, particularly relative to a crowd that, confident of its lead, ignores the signs and strides directly over the cliff. Valuation extremes and the range of probable market losses In the face of extreme valuations, near-record highs, lopsided bullishness, interest rates now well-off the zero-bound, and deterioration in the uniformity of market internals that characterized most of the period since 2009, we’ve seen a spate of articles offering notions to investors like “you are here” relative to the valuations at the 2000 peak. Articles in both Bloomberg and the Wall Street Journal (h/t Mike Shedlock) encourage investors to believe that “this time really is different” and that the market still has “room to melt up.” These arguments essentially rely on using the single most extreme bubble in U.S. financial history as a benchmark for investors’ expectations. Recall that this bubble was followed by a collapse of -83% in tech-heavy Nasdaq 100 Index and a 50% loss in the S&P 500 Index by October 2002, wiping out the entire total return of the S&P 500 in excess of Treasury bills, all the way back to May 1996. By the 2009 market low, the S&P 500 had underperformed risk-free Treasury bills all the way back to June 1995. Yet even using the 2000 extreme as our benchmark, the fact is that the most reliable measures of valuation (those best correlated with actual subsequent market outcomes in cycles across history) are actually less than 7% below their 2000 extremes, on average, and are already beyond every other market extreme on record. Moreover, because the most egregious valuations of the tech bubble were concentrated among a small subset of stocks, the median price/revenue ratio across S&P 500 components is already more than 50% beyond the 2000 peak, easily the highest level in history. Examine the data, and you’ll find that Wall Street’s euphoria invariably relies on valuation measures that are weakly linked to actual subsequent market outcomes. The less reliable the valuation metric, the more investors should plug their ears. Moreover, even ignoring the fact that rich valuations imply poor subsequent market returns regardless of the level of interest rates, you’ll still find that interest rates cannot “justify” current valuation levels by any stretch of the imagination (see The Most Broadly Overvalued Moment in Market History). Earnings junkies will also find that the correlation between year-over-year growth in S&P 500 earnings and changes in the index itself is roughly zero. My concern is not that the market will be weak because earnings will be weak. Rather, I’ve regularly argued that earnings-based valuation measures are inept because cyclical fluctuations in profit margins make near-term earnings a poor “sufficient statistic” for decades of long-term cash flows. The following are estimated correlations between various valuation measures and actual subsequent 10-year and 12-year S&P 500 total returns, ranked from strongest to weakest. I should also note that while nonfinancial enterprise value (equity + debt) to GVA is useful in gauging overall financial market valuations, it has a somewhat lower correlation with subsequent stock market returns than nonfinancial equity market cap to GVA because of the inclusion of debt in the numerator. Enterprise value to cash flow works poorly because it does two things: it includes debt in the numerator, which makes it less relevant for equity market outcomes, and it uses raw corporate cash flows without adjusting them for the position of profit margins within the business cycle. As a reminder of where market valuations stand, based on what actually works across market cycles, the chart below presents several of the most historically reliable equity valuation measures we track. We can form expectations about the likely range of market losses over the completion of this cycle by asking what amount of retreat would be required to bring these measures to either: a) the highest level of valuation reached at any previous bear market low, or b) the historical norm of each measure. Emphatically, these estimates do not assume that valuations will move below their historical norms at the next bear market low (as they did, in fact, as recently as the 2009 low). The smallest expected loss estimate comes in at -45.6%, while the largest loss estimate (taking each measure to its respective historical norm) is -62.1%. The average range of estimated market losses is -47.7% to -60.1%, while the median range is -45.6% to -62.0%.
The foregoing comments represent the general investment analysis and economic views of the Advisor, and are provided solely for the purpose of information, instruction and discourse. Please see periodic remarks on the Fund Notes and Commentary page for discussion relating specifically to the Hussman Funds and the investment positions of the Funds. --- The foregoing comments represent the general investment analysis and economic views of the Advisor, and are provided solely for the purpose of information, instruction and discourse. Prospectuses for the Hussman Strategic Growth Fund, the Hussman Strategic Total Return Fund, the Hussman Strategic International Fund, and the Hussman Strategic Dividend Value Fund, as well as Fund reports and other information, are available by clicking "The Funds" menu button from any page of this website. |
|||||||||||||||||||||||||
|
For more information about investing in the Hussman Funds, please call us at
1-800-HUSSMAN (1-800-487-7626) 513-326-3551 outside the United States Site and site contents © copyright Hussman Funds. Brief quotations including attribution and a direct link to this site (www.hussmanfunds.com) are authorized. All other rights reserved and actively enforced. Extensive or unattributed reproduction of text or research findings are violations of copyright law. Site design by 1WebsiteDesigners. |